Search Market Research Report

Discover Our Latest Reports
Discover Our Featured Reports
Discover Top Selling Reports

Clean Energy Technologies Market Size, Share Global Analysis Report, , 2021 – 2026

report img

Clean Energy Technologies Market by Technology Type (Hydropower Technology, Wind Technology, Clean Coal Technology, Solar Technology, and Others) and By End-Use (Industrial, Residential, Commercial, and Others) By Region: Global and Regional Industry Perspective, Comprehensive Analysis, and Forecast, 2021 – 2026

Industry Insights

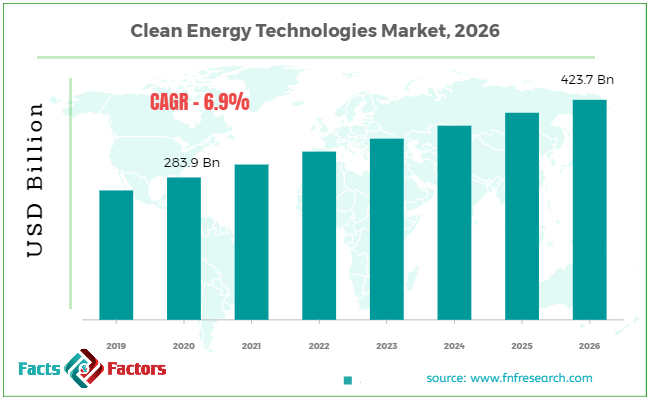
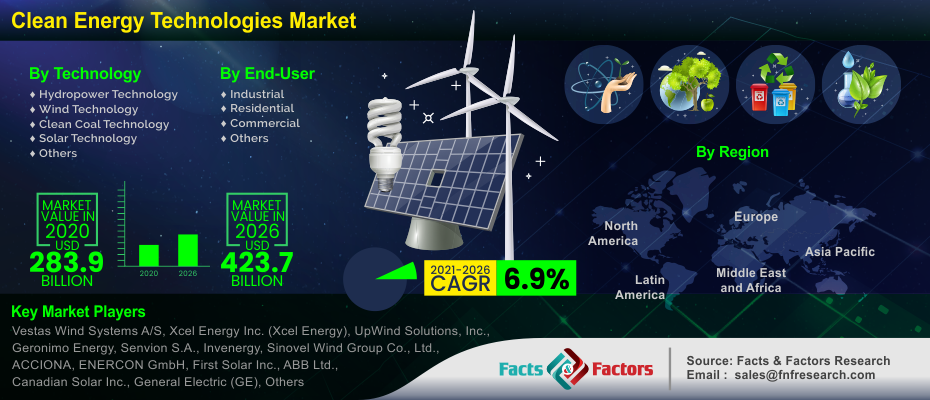
[223+ Pages Report] The analysts at Facts and Factors Research have stated that the global clean energy technologies market was valued at approximately USD 283.9 Billion in the year 2020. The projected value of the market is predicted to be about USD 423.7 Billion by 2026 year-end. The published report provides an anticipated growth rate of roughly 6.9% CAGR during the forecast period till 2026.

Clean Energy Technologies Market Size

To know more about this report | Request Free Sample Copy

logoMarket Overview   

Any process, product, or service that decreases negative environmental consequences through major energy efficiency gains, sustainable resource usage, or environmental protection efforts is referred to as clean energy technology. Clean energy technologies also help to sustain economic growth by increasing energy supply and addressing environmental issues caused by the usage of other traditional energy sources. The environmental advantages of clean energy technology are the most essential component of a global energy future. Clean, renewable fuels not only help to conserve the world's natural resources, but also minimize the danger of environmental disasters like fuel spills and natural gas leaks. It is feasible to establish stable power supplies to increase energy security, ensuring there is enough to fulfill our demands, through fuel diversity, which involves diverse power plants employing different energy sources.

A number of environmental and economic benefits are also provided by such technology, including a reduction in air pollution. A diversified sustainable energy source decreases reliance on foreign fuels as well (and the associated financial and environmental costs this incurs). These technologies also save money since there's no need to harvest and transport fuels like oil or coal because the resources renew themselves spontaneously. The development of jobs to research, manufacture, and install future clean energy resources is another industrial advantage of a clean energy mix.

Clean Energy Technologies Market

To know more about this report | Request Free Sample Copy

logoIndustry Growth Factors

The global demand for clean energy technologies is increasing as a result of growing urbanization and industrialization. As a result, the usage of fossil fuels grows. Excessive use of fossil fuels, on the other hand, leads to increased carbon dioxide gas emissions, which pollute the environment. As a result, there is an increasing need for clean energy sources, which will help reduce carbon emissions and enable the ecologically sustainable generation of power from natural resources. Clean energy technologies will be adopted at a faster rate as demand for clean energy sources grows, enhancing the market's development potential. However, renewable energy generation, on the other hand, necessitates a significant investment. During the projected period, this factor is expected to limit the market growth. Furthermore, due to its cost-effective nature in comparison to other locations, fossil fuels are mostly employed to create energy in the Middle East, stifling industry expansion. Continuous technological advancements and increasing government financing in the renewable energy sector, on the other hand, will provide attractive development possibilities over the assessment period. The size of the sector is also growing as government restrictions on climate change become more rigorous in both developed and emerging nations.

logoSegmentation Analysis

The global clean energy technologies market is segregated based on technology type, end-use, and region.

Hydropower technology, wind technology, clean coal technology, solar technology, and others make up the technology type segment of the global clean energy technologies industry.  The global clean energy technologies market can be divided into industrial, residential, commercial, and others based on the end-use segment.

Sustainable coal technology is a form of clean energy technology used to minimize the environmental effect of coal-fired power generation while also addressing climate change. Clean coal technology is widely used in the power generating industry because it can achieve ultra-high efficiency. Clean coal technology's growing popularity can be due to its capacity to minimize carbon dioxide emissions from coal-fired power plants. As a result of these factors, clean coal technology will gain in popularity, propelling the global clean energy technologies market forward.

logo Regional Analysis

During the projected period, the Asia Pacific region is expected to expand the most. The expansion of industrialization in this area, particularly in nations like India and China, would result in ever-increasing energy consumption, propelling renewable energy market trends upwards. Growing population and favorable government regulations will both help to boost income from the clean energy technologies sector in this region.

According to Electric Power Annual, the worldwide energy-producing capacity from clean fuel sources is anticipated to grow at a CAGR of 23.1 percent from 2016 to 2018, resulting in a total of 277.77 GW of clean energy. Clean energy is also the European Union's long-term goal, with the goal of making Europe a climate-neutral continent by 2050. To achieve this aim, the European Green Deal highlights the necessity of achieving offshore clean energy - a project that will further strengthen the continent's renewable energy industry.

logoReport Scope

Report Attribute

Details

Market Size in 2020

USD 283.9 Billion

Projected Market Size in 2026

USD 423.7 Billion

CAGR Growth Rate

6.9% CAGR

Base Year

2020

Forecast Years

2021-2026

Key Market Players

Vestas Wind Systems A/S, Xcel Energy Inc. (Xcel Energy), UpWind Solutions, Inc., Geronimo Energy, Senvion S.A., Invenergy, Sinovel Wind Group Co., Ltd., ACCIONA, ENERCON GmbH, First Solar Inc., ABB Ltd., Canadian Solar Inc., General Electric (GE), Jinko Solar Holding Co. Ltd, The Tata Power Company Limited, Suzlon Energy Ltd., Innergex, Siemens, Enel Spa (Enel), and Calpine Corporation amongst others.

Key Segment

By Technology Type, By End-Use, and By Region

Major Regions Covered

North America, Europe, Asia Pacific, Latin America, and the Middle East & Africa

Purchase Options

Request customized purchase options to meet your research needs. Explore purchase options

logo Competitive Players

Some main participants of the global clean energy technologies market are :

  • Vestas Wind Systems A/S
  • Xcel Energy Inc. (Xcel Energy)
  • UpWind Solutions Inc.
  • Geronimo Energy
  • Senvion S.A.
  • Invenergy
  • Sinovel Wind Group Co. Ltd.
  • ACCIONA
  • ENERCON GmbH
  • First Solar Inc.
  • ABB Ltd.
  • Canadian Solar Inc.
  • General Electric (GE)
  • Jinko Solar Holding Co. Ltd
  • The Tata Power Company Limited
  • Suzlon Energy Ltd.
  • Innergex
  • Siemens
  • Enel Spa (Enel)
  • Calpine Corporation

logo By Technology Type:

  • Hydropower Technology
  • Wind Technology
  • Clean Coal Technology
  • Solar Technology
  • Others

logo By End-Use:

  • Industrial
  • Residential
  • Commercial
  • Others

logo By Region:

  • North America
    • The U.S.
    • Canada
  • Europe
    • France
    • The UK
    • Spain
    • Germany
    • Italy
    • Rest of Europe
  • Asia Pacific
    • China
    • Japan
    • India
    • South Korea
    • Southeast Asia
    • Rest of Asia Pacific
  • Latin America
    • Brazil
    • Mexico
    • Rest of Latin America
  • Middle East & Africa
    • GCC Countries
    • South Africa
    • Rest of Middle East & Africa

Table of Content

  1. Chapter 1 Executive Summary
    1. 1.1. Introduction of Clean Energy Technologies
    2. 1.2. Global Clean Energy Technologies Market, 2020 & 2026 (USD Million)
    3. 1.3. Global Clean Energy Technologies Market, 2016 – 2026 (USD Million)
    4. 1.4. Global Clean Energy Technologies Market Absolute Revenue Opportunity, 2016 – 2026 (USD Million)
    5. 1.5. Global Clean Energy Technologies Market Incremental Revenue Opportunity, 2020 – 2026 (USD Million)
  2. Chapter 2 Clean Energy Technologies Market – Technology Type Analysis
    1. 2.1. Global Clean Energy Technologies Market – Technology Type Overview
    2. 2.2. Global Clean Energy Technologies Market Share, by Technology Type, 2020 & 2026 (USD Million)
    3. 2.3. Hydropower Technology
      1. 2.3.1. Global Hydropower Technology Clean Energy Technologies Market, 2016 – 2026 (USD Million)
    4. 2.4. Wind Technology
      1. 2.4.1. Global Wind Technology Clean Energy Technologies Market, 2016 – 2026 (USD Million)
    5. 2.5. Clean Coal Technology
      1. 2.5.1. Global Clean Coal Technology Clean Energy Technologies Market, 2016 – 2026 (USD Million)
    6. 2.6. Solar Technology
      1. 2.6.1. Global Solar Technology Clean Energy Technologies Market, 2016 – 2026 (USD Million)
    7. 2.7. Others
      1. 2.7.1. Global Others Clean Energy Technologies Market, 2016 – 2026 (USD Million)
  3. Chapter 3 Clean Energy Technologies Market – End-Use Analysis
    1. 3.1. Global Clean Energy Technologies Market – End-Use Overview
    2. 3.2. Global Clean Energy Technologies Market Share, by End-Use, 2020 & 2026 (USD Million)
    3. 3.3. Industrial
      1. 3.3.1. Global Industrial Clean Energy Technologies Market, 2016 – 2026 (USD Million)
    4. 3.4. Residential
      1. 3.4.1. Global Residential Clean Energy Technologies Market, 2016 – 2026 (USD Million)
    5. 3.5. Commercial
      1. 3.5.1. Global Commercial Clean Energy Technologies Market, 2016 – 2026 (USD Million)
    6. 3.6. Others
      1. 3.6.1. Global Others Clean Energy Technologies Market, 2016 – 2026 (USD Million)
  4. Chapter 4 Clean Energy Technologies Market – Regional Analysis
    1. 4.1. Global Clean Energy Technologies Market Regional Overview
    2. 4.2. Global Clean Energy Technologies Market Share, by Region, 2020 & 2026 (USD Million)
    3. 4.3. North America
      1. 4.3.1. North America Clean Energy Technologies Market, 2016 – 2026 (USD Million)
        1. 4.3.1.1. North America Clean Energy Technologies Market, by Country, 2016 - 2026 (USD Million)
      2. 4.3.2. North America Clean Energy Technologies Market, by Technology Type, 2016 – 2026
        1. 4.3.2.1. North America Clean Energy Technologies Market, by Technology Type, 2016 – 2026 (USD Million)
      3. 4.3.3. North America Clean Energy Technologies Market, by End-Use, 2016 – 2026
        1. 4.3.3.1. North America Clean Energy Technologies Market, by End-Use, 2016 – 2026 (USD Million)
      4. 4.3.4. U.S.
        1. 4.3.4.1. U.S. Clean Energy Technologies Market, 2016 – 2026 (USD Million)
      5. 4.3.5. Canada
        1. 4.3.5.1. Canada Clean Energy Technologies Market, 2016 – 2026 (USD Million)
    4. 4.4. Europe
      1. 4.4.1. Europe Clean Energy Technologies Market, 2016 – 2026 (USD Million)
        1. 4.4.1.1. Europe Clean Energy Technologies Market, by Country, 2016 - 2026 (USD Million)
      2. 4.4.2. Europe Clean Energy Technologies Market, by Technology Type, 2016 – 2026
        1. 4.4.2.1. Europe Clean Energy Technologies Market, by Technology Type, 2016 – 2026 (USD Million)
      3. 4.4.3. Europe Clean Energy Technologies Market, by End-Use, 2016 – 2026
        1. 4.4.3.1. Europe Clean Energy Technologies Market, by End-Use, 2016 – 2026 (USD Million)
      4. 4.4.4. Germany
        1. 4.4.4.1. Germany Clean Energy Technologies Market, 2016 – 2026 (USD Million)
      5. 4.4.5. France
        1. 4.4.5.1. France Clean Energy Technologies Market, 2016 – 2026 (USD Million)
      6. 4.4.6. U.K.
        1. 4.4.6.1. U.K. Clean Energy Technologies Market, 2016 – 2026 (USD Million)
      7. 4.4.7. Italy
        1. 4.4.7.1. Italy Clean Energy Technologies Market, 2016 – 2026 (USD Million)
      8. 4.4.8. Spain
        1. 4.4.8.1. Spain Clean Energy Technologies Market, 2016 – 2026 (USD Million)
      9. 4.4.9. Rest of Europe
        1. 4.4.9.1. Rest of Europe Clean Energy Technologies Market, 2016 – 2026 (USD Million)
    5. 4.5. Asia Pacific
      1. 4.5.1. Asia Pacific Clean Energy Technologies Market, 2016 – 2026 (USD Million)
        1. 4.5.1.1. Asia Pacific Clean Energy Technologies Market, by Country, 2016 - 2026 (USD Million)
      2. 4.5.2. Asia Pacific Clean Energy Technologies Market, by Technology Type, 2016 – 2026
        1. 4.5.2.1. Asia Pacific Clean Energy Technologies Market, by Technology Type, 2016 – 2026 (USD Million)
      3. 4.5.3. Asia Pacific Clean Energy Technologies Market, by End-Use, 2016 – 2026
        1. 4.5.3.1. Asia Pacific Clean Energy Technologies Market, by End-Use, 2016 – 2026 (USD Million)
      4. 4.5.4. China
        1. 4.5.4.1. China Clean Energy Technologies Market, 2016 – 2026 (USD Million)
      5. 4.5.5. Japan
        1. 4.5.5.1. Japan Clean Energy Technologies Market, 2016 – 2026 (USD Million)
      6. 4.5.6. India
        1. 4.5.6.1. India Clean Energy Technologies Market, 2016 – 2026 (USD Million)
      7. 4.5.7. South Korea
        1. 4.5.7.1. South Korea Clean Energy Technologies Market, 2016 – 2026 (USD Million)
      8. 4.5.8. South-East Asia
        1. 4.5.8.1. South-East Asia Clean Energy Technologies Market, 2016 – 2026 (USD Million)
      9. 4.5.9. Rest of Asia Pacific
        1. 4.5.9.1. Rest of Asia Pacific Clean Energy Technologies Market, 2016 – 2026 (USD Million)
    6. 4.6. Latin America
      1. 4.6.1. Latin America Clean Energy Technologies Market, 2016 – 2026 (USD Million)
        1. 4.6.1.1. Latin America Clean Energy Technologies Market, by Country, 2016 - 2026 (USD Million)
      2. 4.6.2. Latin America Clean Energy Technologies Market, by Technology Type, 2016 – 2026
        1. 4.6.2.1. Latin America Clean Energy Technologies Market, by Technology Type, 2016 – 2026 (USD Million)
      3. 4.6.3. Latin America Clean Energy Technologies Market, by End-Use, 2016 – 2026
        1. 4.6.3.1. Latin America Clean Energy Technologies Market, by End-Use, 2016 – 2026 (USD Million)
      4. 4.6.4. Brazil
        1. 4.6.4.1. Brazil Clean Energy Technologies Market, 2016 – 2026 (USD Million)
      5. 4.6.5. Mexico
        1. 4.6.5.1. Mexico Clean Energy Technologies Market, 2016 – 2026 (USD Million)
      6. 4.6.6. Rest of Latin America
        1. 4.6.6.1. Rest of Latin America Clean Energy Technologies Market, 2016 – 2026 (USD Million)
    7. 4.7. The Middle-East and Africa
      1. 4.7.1. The Middle-East and Africa Clean Energy Technologies Market, 2016 – 2026 (USD Million)
        1. 4.7.1.1. The Middle-East and Africa Clean Energy Technologies Market, by Country, 2016 - 2026 (USD Million)
      2. 4.7.2. The Middle-East and Africa Clean Energy Technologies Market, by Technology Type, 2016 – 2026
        1. 4.7.2.1. The Middle-East and Africa Clean Energy Technologies Market, by Technology Type, 2016 – 2026 (USD Million)
      3. 4.7.3. The Middle-East and Africa Clean Energy Technologies Market, by End-Use, 2016 – 2026
        1. 4.7.3.1. The Middle-East and Africa Clean Energy Technologies Market, by End-Use, 2016 – 2026 (USD Million)
      4. 4.7.4. GCC Countries
        1. 4.7.4.1. GCC Countries Clean Energy Technologies Market, 2016 – 2026 (USD Million)
      5. 4.7.5. South Africa
        1. 4.7.5.1. South Africa Clean Energy Technologies Market, 2016 – 2026 (USD Million)
      6. 4.7.6. Rest of Middle-East Africa
        1. 4.7.6.1. Rest of Middle-East Africa Clean Energy Technologies Market, 2016 – 2026 (USD Million)
  5. Chapter 5 Clean Energy Technologies Market – Competitive Landscape
    1. 5.1. Competitor Market Share – Revenue
    2. 5.2. Market Concentration Rate Analysis, Top 3 and Top 5 Players
    3. 5.3. Strategic Developments
      1. 5.3.1. Acquisitions and Mergers
      2. 5.3.2. New Products
      3. 5.3.3. Research & Development Activities
  6. Chapter 6 Company Profiles
    1. 6.1. Vestas Wind Systems A/S
      1. 6.1.1. Company Overview
      2. 6.1.2. Product/Service Portfolio
      3. 6.1.3. Vestas Wind Systems A/S Sales, Revenue, and Gross Margin
      4. 6.1.4. Vestas Wind Systems A/S Revenue and Growth Rate
      5. 6.1.5. Vestas Wind Systems A/S Market Share
      6. 6.1.6. Recent Initiatives, Funding/VC Activities, and Technological Innovations
    2. 6.2. Xcel Energy Inc. (Xcel Energy)
      1. 6.2.1. Company Overview
      2. 6.2.2. Product/Service Portfolio
      3. 6.2.3. Xcel Energy Inc. (Xcel Energy) Sales, Revenue, and Gross Margin
      4. 6.2.4. Xcel Energy Inc. (Xcel Energy) Revenue and Growth Rate
      5. 6.2.5. Xcel Energy Inc. (Xcel Energy) Market Share
      6. 6.2.6. Recent Initiatives, Funding/VC Activities, and Technological Innovations
    3. 6.3. UpWind Solutions, Inc.
      1. 6.3.1. Company Overview
      2. 6.3.2. Product/Service Portfolio
      3. 6.3.3. UpWind Solutions, Inc. Sales, Revenue, and Gross Margin
      4. 6.3.4. UpWind Solutions, Inc. Revenue and Growth Rate
      5. 6.3.5. UpWind Solutions, Inc. Market Share
      6. 6.3.6. Recent Initiatives, Funding/VC Activities, and Technological Innovations
    4. 6.4. Geronimo Energy
      1. 6.4.1. Company Overview
      2. 6.4.2. Product/Service Portfolio
      3. 6.4.3. Geronimo Energy Sales, Revenue, and Gross Margin
      4. 6.4.4. Geronimo Energy Revenue and Growth Rate
      5. 6.4.5. Geronimo Energy Market Share
      6. 6.4.6. Recent Initiatives, Funding/VC Activities, and Technological Innovations
    5. 6.5. Senvion S.A.
      1. 6.5.1. Company Overview
      2. 6.5.2. Product/Service Portfolio
      3. 6.5.3. Senvion S.A. Sales, Revenue, and Gross Margin
      4. 6.5.4. Senvion S.A. Revenue and Growth Rate
      5. 6.5.5. Senvion S.A. Market Share
      6. 6.5.6. Recent Initiatives, Funding/VC Activities, and Technological Innovations
    6. 6.6. Invenergy
      1. 6.6.1. Company Overview
      2. 6.6.2. Product/Service Portfolio
      3. 6.6.3. Invenergy Sales, Revenue, and Gross Margin
      4. 6.6.4. Invenergy Revenue and Growth Rate
      5. 6.6.5. Invenergy Market Share
      6. 6.6.6. Recent Initiatives, Funding/VC Activities, and Technological Innovations
    7. 6.7. Sinovel Wind Group Co., Ltd.
      1. 6.7.1. Company Overview
      2. 6.7.2. Product/Service Portfolio
      3. 6.7.3. Sinovel Wind Group Co., Ltd. Sales, Revenue, and Gross Margin
      4. 6.7.4. Sinovel Wind Group Co., Ltd. Revenue and Growth Rate
      5. 6.7.5. Sinovel Wind Group Co., Ltd. Market Share
      6. 6.7.6. Recent Initiatives, Funding/VC Activities, and Technological Innovations
    8. 6.8. ACCIONA
      1. 6.8.1. Company Overview
      2. 6.8.2. Product/Service Portfolio
      3. 6.8.3. ACCIONA Sales, Revenue, and Gross Margin
      4. 6.8.4. ACCIONA Revenue and Growth Rate
      5. 6.8.5. ACCIONA Market Share
      6. 6.8.6. Recent Initiatives, Funding/VC Activities, and Technological Innovations
    9. 6.9. ENERCON GmbH
      1. 6.9.1. Company Overview
      2. 6.9.2. Product/Service Portfolio
      3. 6.9.3. ENERCON GmbH Sales, Revenue, and Gross Margin
      4. 6.9.4. ENERCON GmbH Revenue and Growth Rate
      5. 6.9.5. ENERCON GmbH Market Share
      6. 6.9.6. Recent Initiatives, Funding/VC Activities, and Technological Innovations
    10. 6.10. First Solar Inc.
      1. 6.10.1. Company Overview
      2. 6.10.2. Product/Service Portfolio
      3. 6.10.3. First Solar Inc. Sales, Revenue, and Gross Margin
      4. 6.10.4. First Solar Inc. Revenue and Growth Rate
      5. 6.10.5. First Solar Inc. Market Share
      6. 6.10.6. Recent Initiatives, Funding/VC Activities, and Technological Innovations
    11. 6.11. ABB Ltd.
      1. 6.11.1. Company Overview
      2. 6.11.2. Product/Service Portfolio
      3. 6.11.3. ABB Ltd. Sales, Revenue, and Gross Margin
      4. 6.11.4. ABB Ltd. Revenue and Growth Rate
      5. 6.11.5. ABB Ltd. Market Share
      6. 6.11.6. Recent Initiatives, Funding/VC Activities, and Technological Innovations
    12. 6.12. Canadian Solar Inc.
      1. 6.12.1. Company Overview
      2. 6.12.2. Product/Service Portfolio
      3. 6.12.3. Canadian Solar Inc. Sales, Revenue, and Gross Margin
      4. 6.12.4. Canadian Solar Inc. Revenue and Growth Rate
      5. 6.12.5. Canadian Solar Inc. Market Share
      6. 6.12.6. Recent Initiatives, Funding/VC Activities, and Technological Innovations
    13. 6.13. General Electric (GE)
      1. 6.13.1. Company Overview
      2. 6.13.2. Product/Service Portfolio
      3. 6.13.3. General Electric (GE) Sales, Revenue, and Gross Margin
      4. 6.13.4. General Electric (GE) Revenue and Growth Rate
      5. 6.13.5. General Electric (GE) Market Share
      6. 6.13.6. Recent Initiatives, Funding/VC Activities, and Technological Innovations
    14. 6.14. Jinko Solar Holding Co. Ltd
      1. 6.14.1. Company Overview
      2. 6.14.2. Product/Service Portfolio
      3. 6.14.3. Jinko Solar Holding Co. Ltd Sales, Revenue, and Gross Margin
      4. 6.14.4. Jinko Solar Holding Co. Ltd Revenue and Growth Rate
      5. 6.14.5. Jinko Solar Holding Co. Ltd Market Share
      6. 6.14.6. Recent Initiatives, Funding/VC Activities, and Technological Innovations
    15. 6.15. The Tata Power Company Limited
      1. 6.15.1. Company Overview
      2. 6.15.2. Product/Service Portfolio
      3. 6.15.3. The Tata Power Company Limited Sales, Revenue, and Gross Margin
      4. 6.15.4. The Tata Power Company Limited Revenue and Growth Rate
      5. 6.15.5. The Tata Power Company Limited Market Share
      6. 6.15.6. Recent Initiatives, Funding/VC Activities, and Technological Innovations
    16. 6.16. Suzlon Energy Ltd.
      1. 6.16.1. Company Overview
      2. 6.16.2. Product/Service Portfolio
      3. 6.16.3. Suzlon Energy Ltd. Sales, Revenue, and Gross Margin
      4. 6.16.4. Suzlon Energy Ltd. Revenue and Growth Rate
      5. 6.16.5. Suzlon Energy Ltd. Market Share
      6. 6.16.6. Recent Initiatives, Funding/VC Activities, and Technological Innovations
    17. 6.17. Innergex
      1. 6.17.1. Company Overview
      2. 6.17.2. Product/Service Portfolio
      3. 6.17.3. Innergex Sales, Revenue, and Gross Margin
      4. 6.17.4. Innergex Revenue and Growth Rate
      5. 6.17.5. Innergex Market Share
      6. 6.17.6. Recent Initiatives, Funding/VC Activities, and Technological Innovations
    18. 6.18. Siemens
      1. 6.18.1. Company Overview
      2. 6.18.2. Product/Service Portfolio
      3. 6.18.3. Siemens Sales, Revenue, and Gross Margin
      4. 6.18.4. Siemens Revenue and Growth Rate
      5. 6.18.5. Siemens Market Share
      6. 6.18.6. Recent Initiatives, Funding/VC Activities, and Technological Innovations
    19. 6.19. Enel Spa (Enel)
      1. 6.19.1. Company Overview
      2. 6.19.2. Product/Service Portfolio
      3. 6.19.3. Enel Spa (Enel) Sales, Revenue, and Gross Margin
      4. 6.19.4. Enel Spa (Enel) Revenue and Growth Rate
      5. 6.19.5. Enel Spa (Enel) Market Share
      6. 6.19.6. Recent Initiatives, Funding/VC Activities, and Technological Innovations
    20. 6.20. Calpine Corporation
      1. 6.20.1. Company Overview
      2. 6.20.2. Product/Service Portfolio
      3. 6.20.3. Calpine Corporation Sales, Revenue, and Gross Margin
      4. 6.20.4. Calpine Corporation Revenue and Growth Rate
      5. 6.20.5. Calpine Corporation Market Share
      6. 6.20.6. Recent Initiatives, Funding/VC Activities, and Technological Innovations
    21. 6.21. Others
      1. 6.21.1. Company Overview
      2. 6.21.2. Product/Service Portfolio
      3. 6.21.3. Others Sales, Revenue, and Gross Margin
      4. 6.21.4. Others Revenue and Growth Rate
      5. 6.21.5. Others Market Share
      6. 6.21.6. Recent Initiatives, Funding/VC Activities, and Technological Innovations
  7. Chapter 7 Clean Energy Technologies — Industry Analysis
    1. 7.1. Introduction and Taxonomy
    2. 7.2. Clean Energy Technologies Market – Key Trends
      1. 7.2.1. Market Drivers
      2. 7.2.2. Market Restraints
      3. 7.2.3. Market Opportunities
    3. 7.3. Value Chain Analysis
    4. 7.4. Key Mandates and Regulations
    5. 7.5. Technology Roadmap and Timeline
    6. 7.6. Clean Energy Technologies Market – Attractiveness Analysis
      1. 7.6.1. By Technology Type
      2. 7.6.2. By End-Use
      3. 7.6.3. By Region
  8. Chapter 8 Industrial Chain, Sourcing Strategy, and Downstream Buyers
    1. 8.1. Clean Energy Technologies Industrial Chain Analysis
    2. 8.2. Downstream Buyers
    3. 8.3. Distributors/Traders List
  9. Chapter 9 Marketing Strategy Analysis
    1. 9.1. Marketing Channel
    2. 9.2. Direct Marketing
    3. 9.3. Indirect Marketing
    4. 9.4. Marketing Channel Development Trends
    5. 9.5. Economic/Political Environmental Change
  10. Chapter 10 Report Conclusion & Key Insights
    1. 10.1. Key Insights from Primary Interviews & Surveys Respondents
    2. 10.2. Key Takeaways from Analysts, Consultants, and Industry Leaders
  11. Chapter 11 Research Approach & Methodology
    1. 11.1. Report Description
    2. 11.2. Research Scope
    3. 11.3. Research Methodology
      1. 11.3.1. Secondary Research
      2. 11.3.2. Primary Research
      3. 11.3.3. Statistical Models
        1. 11.3.3.1. Company Share Analysis Model
        2. 11.3.3.2. Revenue Based Modeling
      4. 11.3.4. Research Limitations

      List of Figures

      Fig.1	Product Picture of Clean Energy Technologies
      Fig.2	Global Clean Energy Technologies Market, 2016 – 2026 (USD Million)
      Fig.3	Global Clean Energy Technologies Market Absolute Revenue Opportunity, 2016 – 2026 (USD Million)
      Fig.4	Global Clean Energy Technologies Market Incremental Revenue Opportunity, 2020 – 2026 (USD Million)
      Fig.5	Global Clean Energy Technologies Market Share, by Technology Type, 2020 & 2026 (USD Million)
      Fig.6	Global Hydropower Technology Clean Energy Technologies Market, 2016 – 2026 (USD Million)
      Fig.7	Global Wind Technology Clean Energy Technologies Market, 2016 – 2026 (USD Million)
      Fig.8	Global Clean Coal Technology Clean Energy Technologies Market, 2016 – 2026 (USD Million)
      Fig.9	Global Solar Technology Clean Energy Technologies Market, 2016 – 2026 (USD Million)
      Fig.10	Global Others Clean Energy Technologies Market, 2016 – 2026 (USD Million)
      Fig.11	Global Clean Energy Technologies Market Share, by End-Use, 2020 & 2026 (USD Million)
      Fig.12	Global Industrial Clean Energy Technologies Market, 2016 – 2026 (USD Million)
      Fig.13	Global Residential Clean Energy Technologies Market, 2016 – 2026 (USD Million)
      Fig.14	Global Commercial Clean Energy Technologies Market, 2016 – 2026 (USD Million)
      Fig.15	Global Others Clean Energy Technologies Market, 2016 – 2026 (USD Million)
      Fig.16	Global Clean Energy Technologies Market Share, by Region, 2020 & 2026 (USD Million)
      Fig.17	North America Clean Energy Technologies Market, 2016 – 2026 (USD Million)
      Fig.18	U.S. Clean Energy Technologies Market, 2016 – 2026 (USD Million)
      Fig.19	Canada Clean Energy Technologies Market, 2016 – 2026 (USD Million)
      Fig.20	Europe Clean Energy Technologies Market, 2016 – 2026 (USD Million)
      Fig.21	Germany Clean Energy Technologies Market, 2016 – 2026 (USD Million)
      Fig.22	France Clean Energy Technologies Market, 2016 – 2026 (USD Million)
      Fig.23	U.K. Clean Energy Technologies Market, 2016 – 2026 (USD Million)
      Fig.24	Italy Clean Energy Technologies Market, 2016 – 2026 (USD Million)
      Fig.25	Spain Clean Energy Technologies Market, 2016 – 2026 (USD Million)
      Fig.26	Rest of Europe Clean Energy Technologies Market, 2016 – 2026 (USD Million)
      Fig.27	Asia Pacific Clean Energy Technologies Market, 2016 – 2026 (USD Million)
      Fig.28	China Clean Energy Technologies Market, 2016 – 2026 (USD Million)
      Fig.29	Japan Clean Energy Technologies Market, 2016 – 2026 (USD Million)
      Fig.30	India Clean Energy Technologies Market, 2016 – 2026 (USD Million)
      Fig.31	South  Korea Clean Energy Technologies Market, 2016 – 2026 (USD Million)
      Fig.32	South-East Asia Clean Energy Technologies Market, 2016 – 2026 (USD Million)
      Fig.33	Rest of Asia Pacific Clean Energy Technologies Market, 2016 – 2026 (USD Million)
      Fig.34	Latin America Clean Energy Technologies Market, 2016 – 2026 (USD Million)
      Fig.35	Brazil Clean Energy Technologies Market, 2016 – 2026 (USD Million)
      Fig.36	Mexico Clean Energy Technologies Market, 2016 – 2026 (USD Million)
      Fig.37	Rest of Latin America Clean Energy Technologies Market, 2016 – 2026 (USD Million)
      Fig.38	The Middle-East and Africa Clean Energy Technologies Market, 2016 – 2026 (USD Million)
      Fig.39	GCC Countries Clean Energy Technologies Market, 2016 – 2026 (USD Million)
      Fig.40	South Africa Clean Energy Technologies Market, 2016 – 2026 (USD Million)
      Fig.41	Rest of Middle-East Africa Clean Energy Technologies Market, 2016 – 2026 (USD Million)
      Fig.42	Competitor Market Share – Revenue
      Fig.43	Vestas Wind Systems A/S Revenue and Growth Rate
      Fig.44	Vestas Wind Systems A/S Market Share
      Fig.45	Xcel Energy Inc. (Xcel Energy) Revenue and Growth Rate
      Fig.46	Xcel Energy Inc. (Xcel Energy) Market Share
      Fig.47	UpWind Solutions, Inc. Revenue and Growth Rate
      Fig.48	UpWind Solutions, Inc. Market Share
      Fig.49	Geronimo Energy Revenue and Growth Rate
      Fig.50	Geronimo Energy Market Share
      Fig.51	Senvion S.A. Revenue and Growth Rate
      Fig.52	Senvion S.A. Market Share
      Fig.53	Invenergy Revenue and Growth Rate
      Fig.54	Invenergy Market Share
      Fig.55	Sinovel Wind Group Co., Ltd. Revenue and Growth Rate
      Fig.56	Sinovel Wind Group Co., Ltd. Market Share
      Fig.57	ACCIONA Revenue and Growth Rate
      Fig.58	ACCIONA Market Share
      Fig.59	ENERCON GmbH Revenue and Growth Rate
      Fig.60	ENERCON GmbH Market Share
      Fig.61	First Solar Inc. Revenue and Growth Rate
      Fig.62	First Solar Inc. Market Share
      Fig.63	ABB Ltd. Revenue and Growth Rate
      Fig.64	ABB Ltd. Market Share
      Fig.65	Canadian Solar Inc. Revenue and Growth Rate
      Fig.66	Canadian Solar Inc. Market Share
      Fig.67	General Electric (GE) Revenue and Growth Rate
      Fig.68	General Electric (GE) Market Share
      Fig.69	Jinko Solar Holding Co. Ltd Revenue and Growth Rate
      Fig.70	Jinko Solar Holding Co. Ltd Market Share
      Fig.71	The Tata Power Company Limited Revenue and Growth Rate
      Fig.72	The Tata Power Company Limited Market Share
      Fig.73	Suzlon Energy Ltd. Revenue and Growth Rate
      Fig.74	Suzlon Energy Ltd. Market Share
      Fig.75	Innergex Revenue and Growth Rate
      Fig.76	Innergex Market Share
      Fig.77	Siemens Revenue and Growth Rate
      Fig.78	Siemens Market Share
      Fig.79	Enel Spa (Enel) Revenue and Growth Rate
      Fig.80	Enel Spa (Enel) Market Share
      Fig.81	Calpine Corporation Revenue and Growth Rate
      Fig.82	Calpine Corporation Market Share
      Fig.83	Others Revenue and Growth Rate
      Fig.84	Others Market Share
      Fig.85	Market Dynamics
      Fig.86	Global Clean Energy Technologies – Value Chain Analysis
      Fig.87	Key Mandates and Regulations
      Fig.88	Technology Roadmap and Timeline
      Fig.89	Market Attractiveness Analysis – By Technology Type
      Fig.90	Market Attractiveness Analysis – By End-Use
      Fig.91	Market Attractiveness Analysis – By Region
      Fig.92	Clean Energy Technologies Industrial Chain Analysis
      Fig.93	Market Channels
      Fig.94	Marketing Channel Development Trend
      Fig.95	Growth in World Gross Product, 2008-2018
      

      List of Tables

      	
      Table 1	Global Clean Energy Technologies Market, 2020 & 2026 (USD Million)
      Table 2	Global Clean Energy Technologies Market, by Technology Type, 2016 – 2026 (USD Million)
      Table 3	Global Clean Energy Technologies Market, by End-Use, 2016 – 2026 (USD Million)
      Table 4	Global Clean Energy Technologies Market, by Region, 2016 – 2026 (USD Million)
      Table 5	North America Clean Energy Technologies Market, by Country, 2016 – 2026 (USD Million)
      Table 6	North America Clean Energy Technologies Market, by Technology Type, 2016 – 2026 (USD Million)
      Table 7	North America Clean Energy Technologies Market, by End-Use, 2016 – 2026 (USD Million)
      Table 8	Europe Clean Energy Technologies Market, by Country, 2016 – 2026 (USD Million)
      Table 9	Europe Clean Energy Technologies Market, by Technology Type, 2016 – 2026 (USD Million)
      Table 10 Europe Clean Energy Technologies Market, by End-Use, 2016 – 2026 (USD Million)
      Table 11 Asia Pacific Clean Energy Technologies Market, by Country, 2016 – 2026 (USD Million)
      Table 12 Asia Pacific Clean Energy Technologies Market, by Technology Type, 2016 – 2026 (USD Million)
      Table 13 Asia Pacific Clean Energy Technologies Market, by End-Use, 2016 – 2026 (USD Million)
      Table 14 Latin America Clean Energy Technologies Market, by Country, 2016 – 2026 (USD Million)
      Table 15 Latin America Clean Energy Technologies Market, by Technology Type, 2016 – 2026 (USD Million)
      Table 16 Latin America Clean Energy Technologies Market, by End-Use, 2016 – 2026 (USD Million)
      Table 17 The Middle-East and Africa Clean Energy Technologies Market, by Country, 2016 – 2026 (USD Million)
      Table 18 The Middle-East and Africa Clean Energy Technologies Market, by Technology Type, 2016 – 2026 (USD Million)
      Table 19 The Middle-East and Africa Clean Energy Technologies Market, by End-Use, 2016 – 2026 (USD Million)
      Table 20 Global Clean Energy Technologies Market - Company Revenue Analysis, 2016 – 2019 (USD Million)
      Table 21 Global Clean Energy Technologies Market - Company Revenue Share Analysis, 2016 – 2019 (%)
      Table 22 Acquisitions and Mergers
      Table 23 Market Drivers – Impact Analysis
      Table 24 Market Restraints
      Table 25 Market Opportunities
      Table 26 Major Buyers of Clean Energy Technologies
      Table 27 Distributors/Traders of Clean Energy Technologies by Region
      

Industry Major Market Players

  • Vestas Wind Systems A/S
  • Xcel Energy Inc. (Xcel Energy)
  • UpWind Solutions Inc.
  • Geronimo Energy
  • Senvion S.A.
  • Invenergy
  • Sinovel Wind Group Co. Ltd.
  • ACCIONA
  • ENERCON GmbH
  • First Solar Inc.
  • ABB Ltd.
  • Canadian Solar Inc.
  • General Electric (GE)
  • Jinko Solar Holding Co. Ltd
  • The Tata Power Company Limited
  • Suzlon Energy Ltd.
  • Innergex
  • Siemens
  • Enel Spa (Enel)
  • Calpine Corporation