Search Market Research Report

Discover Our Latest Reports
Discover Our Featured Reports
Discover Top Selling Reports

Cerium Oxide Nanoparticles Market Size, Share Global Analysis Report, s 2020–2026

report img

Cerium Oxide Nanoparticles Market By Form (Dispersion, Powder) and By Application (Chemical Mechanical Planarization, Catalyst, Biomedical, Energy): Global Industry Outlook, Market Size, Business Intelligence, Consumer Preferences, Statistical Surveys, Comprehensive Analysis, Historical Developments, Current Trends, and Forecasts 2020–2026

Industry Insights

The Cerium Oxide Nanoparticles market report analyzes and notifies the industry statistics at the global as well as regional and country levels in order to acquire a thorough perspective of the entire Cerium Oxide Nanoparticles market. The historical and past insights are provided for FY 2016 to FY 2019 whereas projected trends are delivered for FY 2020 to FY 2026. The quantitative and numerical data is represented in terms of both volume (Kilo Tons) and value (USD Million) from FY 2016 – 2026.

This specialized and expertise-oriented industry research report scrutinizes the technical and commercial business outlook of the Cerium Oxide Nanoparticles industry. The report analyzes and declares the historical and current trends analysis of the Cerium Oxide Nanoparticles industry & subsequently recommends the projected trends anticipated to be observed in the Cerium Oxide Nanoparticles market during the upcoming years.Cerium Oxide Nanoparticles Market Size

To know more about this report | Request Free Sample Copy


logo
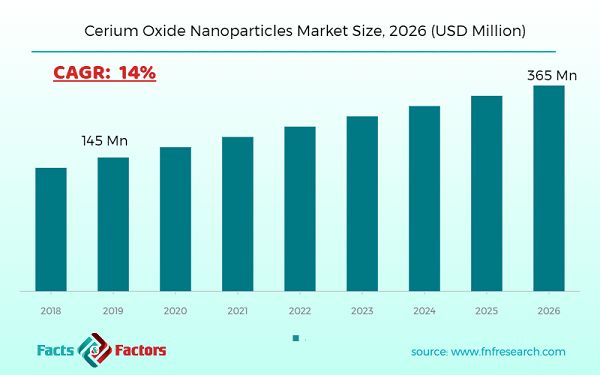
Key Insights from Primary Research

  • As per our primary respondents, the Cerium Oxide Nanoparticles Market is set to grow annually at a rate of around 14%.
  • It was established through primary research that the Cerium Oxide Nanoparticles Market was valued at around USD 145 billion in 2019.
  • The “dispersion” category, based on form segmentation, is expected to share the maximum revenue in the year 2019
  • Based on application segmentation, the “Chemical Mechanical Planarization (CMP)” category is anticipated to hold the maximum revenue in 2019.
  • The region of North America is predicted to dominate the market share owing to its increased usage in various CMP and biomedical applications.

logoKey Recommendations from Analysts

  • As per our analyst, the Cerium Oxide Nanoparticles Market is set to have a good market share in the forecasted period owing to its penetration in multiple industrial applications such as paints, biomedical, and catalytic operations.
  • Growing at a CAGR around 14%, Cerium Oxide Nanoparticles Market provides numerous opportunities for all of the involved stakeholders across the entire value chain.
  • The increased focus of the governments of various developed countries in R&D investments has provided several growths and investment options for the manufactures in establishing and expanding their business in these countries.
  • The increased demand for the market in the region of Asia Pacific also provides numerous investment and penetration options for the existing manufacturers in developing countries like China and India.
  • Our analysts have identified “Biomedical” categories as the leading investment pockets for Cerium Oxide Nanoparticles Market in terms of application segmentation respectively.

The quantitative data is further underlined and reinforced by comprehensive qualitative data which comprises various across-the-board market dynamics. The rationales which directly or indirectly impact the Cerium Oxide Nanoparticles industry are exemplified through parameters such as growth drivers, restraints, challenges, and opportunities among other impacting factors.

Throughout our research report, we have encompassed all the proven models and tools of industry analysis and extensively illustrated all the key business strategies and business models adopted in the Cerium Oxide Nanoparticles industry. The report provides an all-inclusive and detailed competitive landscape prevalent in the Cerium Oxide Nanoparticles market.

The report utilizes established industry analysis tools and models such as Porter’s Five Forces framework to analyze and recognize critical business strategies adopted by various stakeholders involved in the entire value chain of the Cerium Oxide Nanoparticles industry. The Cerium Oxide Nanoparticles market report additionally employs SWOT analysis and PESTLE analysis models for further in-depth analysis.

The report study further includes an in-depth analysis of industry players' market shares and provides an overview of leading players' market position in the Cerium Oxide Nanoparticles sector. Key strategic developments in the Cerium Oxide Nanoparticles market competitive landscape such as acquisitions & mergers, inaugurations of different products and services, partnerships & joint ventures, MoU agreements, VC & funding activities, R&D activities, and geographic expansion among other noteworthy activities by key players of the Cerium Oxide Nanoparticles market are appropriately highlighted in the report.

Cerium oxide nanoparticles also known as nanoceria are cerium nanoparticles that have a diameter of 1-500 nm. It belongs in the periodic table to the lanthanide group and is called a rare earth oxide metal and is used in various applications such as personal care, electricity, and medicine. It is found richly in bastnaesite and monazite minerals and is considered significant due to the highly reactive nature of oxygen. In the forecast era, the use of cerium oxide nanoparticles in various applications such as oil, chemical, and medical would likely drive the market. Furthermore, the attention of major developed countries in the area of Europe and North America on advancing nanotechnology work to be applied through specific defense and aerospace technologies has also helped push the industry forward. Developing region countries such as China and India are also focused on investing large sums of their economies in pharmaceutical sector research and development.

The Cerium Oxide Nanoparticles market research report delivers an acute valuation and taxonomy of the Cerium Oxide Nanoparticles industry by practically splitting the market on the basis of different types, applications, and regions. Through the analysis of the historical and projected trends, all the segments and sub-segments were evaluated through the bottom-up approach, and different market sizes have been projected for FY 2020 to FY 2026. The regional segmentation of the Cerium Oxide Nanoparticles industry includes the complete classification of all the major continents including North America, Latin America, Europe, Asia Pacific, and the Middle East & Africa. Further, country-wise data for the Cerium Oxide Nanoparticles industry is provided for the leading economies of the world.

The Cerium Oxide Nanoparticles market is segmented based on Form and Application. On the basis of form segmentation, the market is classified into Dispersion and Powder. In terms of Application segmentation, the market is bifurcated into Chemical Mechanical Planarization, Catalyst, Biomedical, and Energy.

logoReport Scope

Report Attribute

Details

Market Size in 2019

USD 145 Million

Projected Market Size in 2026

USD 365 Million

CAGR Growth Rate

14% CAGR

Base Year

2019

Forecast Years

2020-2026

Key Market Players

Cerion, Plasmachem, American Elements, Inframat Advanced Materials, NYACOL Nano Technologies, Nanophase Technologies, and others.

Key Segment

By Form, Application, and Region

Major Regions Covered

North America, Europe, Asia Pacific, Latin America, and the Middle East &, Africa

Purchase Options

Request customized purchase options to meet your research needs. Explore purchase options

logoSome of the essential players operating in the Cerium Oxide Nanoparticles market, but not restricted to include

  • Cerion
  •  Plasmachem
  •  American Elements
  •  Inframat Advanced Materials
  •  NYACOL Nano Technologies
  •  Nanophase Technologies

The taxonomy of the Cerium Oxide Nanoparticles industry by its scope and segmentation is as follows:

logo By Form Segmentation Analysis (Customizable)

  • Dispersion
  • Powder

logo By Application Segmentation Analysis (Customizable)

  • Chemical Mechanical Planarization
  • Catalyst
  • Biomedical
  • Energy

logo Regional Segmentation Analysis (Customizable)

  • North America
    • The U.S.
    • Canada
  • Europe
    • Germany
    • The UK
    • France
    • Spain
    • Italy
    • Rest of Europe
  • Asia Pacific
    • China
    • Japan
    • India
    • South Korea
    • Southeast Asia
    • Rest of Asia Pacific
  • Latin America
    • Brazil
    • Mexico
    • Rest of Latin America
  • Middle East & Africa
    • GCC
    • South Africa
    • Rest of the Middle East & Africa

Table of Content

  1. CHAPTER 1. Executive Summary
  2. CHAPTER 2. Cerium Oxide Nanoparticles market – Form Analysis
    1. 2.1. Global Cerium Oxide Nanoparticles Market – Form Overview
    2. 2.2. Global Cerium Oxide Nanoparticles Market Share, by Form, 2018 & 2025 (USD Million)
    3. 2.3. Global Cerium Oxide Nanoparticles Market share, by Form, 2018 & 2025 (Kilo Tons)
    4. 2.4. Dispersion
      1. 2.4.1. Global Dispersion Cerium Oxide Nanoparticles Market, 2016-2026 (USD Million)
      2. 2.4.2. Global Dispersion Cerium Oxide Nanoparticles Market, 2016-2026 (Kilo Tons)
    5. 2.5. Powder
      1. 2.5.1. Global Powder Cerium Oxide Nanoparticles Market, 2016-2026 (USD Million)
      2. 2.5.2. Global Powder Cerium Oxide Nanoparticles Market, 2016-2026 (Kilo Tons)
  3. CHAPTER 3. Cerium Oxide Nanoparticles market – Application Analysis
    1. 3.1. Global Cerium Oxide Nanoparticles Market – Application Overview
    2. 3.2. Global Cerium Oxide Nanoparticles Market Share, by Application, 2018 & 2025 (USD Million)
    3. 3.3. Global Cerium Oxide Nanoparticles Market share, by Application, 2018 & 2025 (Kilo Tons)
    4. 3.4. Chemical Mechanical Planarization
      1. 3.4.1. Global Chemical Mechanical Planarization Cerium Oxide Nanoparticles Market, 2016-2026 (USD Million)
      2. 3.4.2. Global Chemical Mechanical Planarization Cerium Oxide Nanoparticles Market, 2016-2026 (Kilo Tons)
    5. 3.5. Catalyst
      1. 3.5.1. Global Catalyst Cerium Oxide Nanoparticles Market, 2016-2026 (USD Million)
      2. 3.5.2. Global Catalyst Cerium Oxide Nanoparticles Market, 2016-2026 (Kilo Tons)
    6. 3.6. Biomedical
      1. 3.6.1. Global Biomedical Cerium Oxide Nanoparticles Market, 2016-2026 (USD Million)
      2. 3.6.2. Global Biomedical Cerium Oxide Nanoparticles Market, 2016-2026 (Kilo Tons)
    7. 3.7. Energy
      1. 3.7.1. Global Energy Cerium Oxide Nanoparticles Market, 2016-2026 (USD Million)
      2. 3.7.2. Global Energy Cerium Oxide Nanoparticles Market, 2016-2026 (Kilo Tons)
  4. CHAPTER 4. Cerium Oxide Nanoparticles market – Regional Analysis
    1. 4.1. Global Cerium Oxide Nanoparticles Market Regional Overview
    2. 4.2. Global Cerium Oxide Nanoparticles Market Share, by Region, 2018 & 2025 (Value)
    3. 4.3. Global Cerium Oxide Nanoparticles Market Share, by Region, 2018 & 2025 (Volume)
    4. 4.4. North America
      1. 4.4.1. North America Cerium Oxide Nanoparticles Market size and forecast, 2016-2026
      2. 4.4.2. North America Cerium Oxide Nanoparticles Market, by Country, 2018 - 2025 (USD Million)
      3. 4.4.3. North America Market size and forecast, 2016-2026 (Kilo Tons)
      4. 4.4.4. North America Cerium Oxide Nanoparticles Market, by Country, 2018 - 2025 (Kilo Tons)
      5. 4.4.5. North America Cerium Oxide Nanoparticles Market, by Form, 2016-2026
        1. 4.4.5.1. North America Cerium Oxide Nanoparticles Market, by Form, 2016-2026 (USD Million)
        2. 4.4.5.2. North America Cerium Oxide Nanoparticles Market, by Form, 2016-2026 (Kilo Tons)
      6. 4.4.6. North America Cerium Oxide Nanoparticles Market, by Application, 2016-2026
        1. 4.4.6.1. North America Cerium Oxide Nanoparticles Market, by Application, 2016-2026 (USD Million)
        2. 4.4.6.2. North America Cerium Oxide Nanoparticles Market, by Application, 2016-2026 (Kilo Tons)
      7. 4.4.7. U.S.
        1. 4.4.7.1. U.S. Market size and forecast, 2016-2026 (USD Million)
        2. 4.4.7.2. U.S. Market size and forecast, 2016-2026 (Kilo Tons)
      8. 4.4.8. Canada
        1. 4.4.8.1. Canada Market size and forecast, 2016-2026 (USD Million)
        2. 4.4.8.2. Canada Market size and forecast, 2016-2026 (Kilo Tons)
    5. 4.5. Europe
      1. 4.5.1. Europe Cerium Oxide Nanoparticles Market size and forecast, 2016-2026
      2. 4.5.2. Europe Cerium Oxide Nanoparticles Market, by Country, 2018 - 2025 (USD Million)
      3. 4.5.3. Europe Market size and forecast, 2016-2026 (Kilo Tons)
      4. 4.5.4. Europe Cerium Oxide Nanoparticles Market, by Country, 2018 - 2025 (Kilo Tons)
      5. 4.5.5. Europe Cerium Oxide Nanoparticles Market, by Form, 2016-2026
        1. 4.5.5.1. Europe Cerium Oxide Nanoparticles Market, by Form, 2016-2026 (USD Million)
        2. 4.5.5.2. Europe Cerium Oxide Nanoparticles Market, by Form, 2016-2026 (Kilo Tons)
      6. 4.5.6. Europe Cerium Oxide Nanoparticles Market, by Application, 2016-2026
        1. 4.5.6.1. Europe Cerium Oxide Nanoparticles Market, by Application, 2016-2026 (USD Million)
        2. 4.5.6.2. Europe Cerium Oxide Nanoparticles Market, by Application, 2016-2026 (Kilo Tons)
      7. 4.5.7. Germany
        1. 4.5.7.1. Germany Market size and forecast, 2016-2026 (USD Million)
        2. 4.5.7.2. Germany Market size and forecast, 2016-2026 (Kilo Tons)
      8. 4.5.8. France
        1. 4.5.8.1. France Market size and forecast, 2016-2026 (USD Million)
        2. 4.5.8.2. France Market size and forecast, 2016-2026 (Kilo Tons)
      9. 4.5.9. U.K.
        1. 4.5.9.1. U.K. Market size and forecast, 2016-2026 (USD Million)
        2. 4.5.9.2. U.K. Market size and forecast, 2016-2026 (Kilo Tons)
      10. 4.5.10. Italy
        1. 4.5.10.1. Italy Market size and forecast, 2016-2026 (USD Million)
        2. 4.5.10.2. Italy Market size and forecast, 2016-2026 (Kilo Tons)
      11. 4.5.11. Spain
        1. 4.5.11.1. Spain Market size and forecast, 2016-2026 (USD Million)
        2. 4.5.11.2. Spain Market size and forecast, 2016-2026 (Kilo Tons)
      12. 4.5.12. Rest of Europe
        1. 4.5.12.1. Rest of Europe Market size and forecast, 2016-2026 (USD Million)
        2. 4.5.12.2. Rest of Europe Market size and forecast, 2016-2026 (Kilo Tons)
    6. 4.6. Asia Pacific
      1. 4.6.1. Asia Pacific Cerium Oxide Nanoparticles Market size and forecast, 2016-2026
      2. 4.6.2. Asia Pacific Cerium Oxide Nanoparticles Market, by Country, 2018 - 2025 (USD Million)
      3. 4.6.3. Asia Pacific Market size and forecast, 2016-2026 (Kilo Tons)
      4. 4.6.4. Asia Pacific Cerium Oxide Nanoparticles Market, by Country, 2018 - 2025 (Kilo Tons)
      5. 4.6.5. Asia Pacific Cerium Oxide Nanoparticles Market, by Form, 2016-2026
        1. 4.6.5.1. Asia Pacific Cerium Oxide Nanoparticles Market, by Form, 2016-2026 (USD Million)
        2. 4.6.5.2. Asia Pacific Cerium Oxide Nanoparticles Market, by Form, 2016-2026 (Kilo Tons)
      6. 4.6.6. Asia Pacific Cerium Oxide Nanoparticles Market, by Application, 2016-2026
        1. 4.6.6.1. Asia Pacific Cerium Oxide Nanoparticles Market, by Application, 2016-2026 (USD Million)
        2. 4.6.6.2. Asia Pacific Cerium Oxide Nanoparticles Market, by Application, 2016-2026 (Kilo Tons)
      7. 4.6.7. China
        1. 4.6.7.1. China Market size and forecast, 2016-2026 (USD Million)
        2. 4.6.7.2. China Market size and forecast, 2016-2026 (Kilo Tons)
      8. 4.6.8. Japan
        1. 4.6.8.1. Japan Market size and forecast, 2016-2026 (USD Million)
        2. 4.6.8.2. Japan Market size and forecast, 2016-2026 (Kilo Tons)
      9. 4.6.9. India
        1. 4.6.9.1. India Market size and forecast, 2016-2026 (USD Million)
        2. 4.6.9.2. India Market size and forecast, 2016-2026 (Kilo Tons)
      10. 4.6.10. South Korea
        1. 4.6.10.1. South Korea Market size and forecast, 2016-2026 (USD Million)
        2. 4.6.10.2. South Korea Market size and forecast, 2016-2026 (Kilo Tons)
      11. 4.6.11. South-East Asia
        1. 4.6.11.1. South-East Asia Market size and forecast, 2016-2026 (USD Million)
        2. 4.6.11.2. South-East Asia Market size and forecast, 2016-2026 (Kilo Tons)
      12. 4.6.12. Rest of Asia Pacific
        1. 4.6.12.1. Rest of Asia Pacific Market size and forecast, 2016-2026 (USD Million)
        2. 4.6.12.2. Rest of Asia Pacific Market size and forecast, 2016-2026 (Kilo Tons)
    7. 4.7. Latin America
      1. 4.7.1. Latin America Cerium Oxide Nanoparticles Market size and forecast, 2016-2026
      2. 4.7.2. Latin America Cerium Oxide Nanoparticles Market, by Country, 2018 - 2025 (USD Million)
      3. 4.7.3. Latin America Market size and forecast, 2016-2026 (Kilo Tons)
      4. 4.7.4. Latin America Cerium Oxide Nanoparticles Market, by Country, 2018 - 2025 (Kilo Tons)
      5. 4.7.5. Latin America Cerium Oxide Nanoparticles Market, by Form, 2016-2026
        1. 4.7.5.1. Latin America Cerium Oxide Nanoparticles Market, by Form, 2016-2026 (USD Million)
        2. 4.7.5.2. Latin America Cerium Oxide Nanoparticles Market, by Form, 2016-2026 (Kilo Tons)
      6. 4.7.6. Latin America Cerium Oxide Nanoparticles Market, by Application, 2016-2026
        1. 4.7.6.1. Latin America Cerium Oxide Nanoparticles Market, by Application, 2016-2026 (USD Million)
        2. 4.7.6.2. Latin America Cerium Oxide Nanoparticles Market, by Application, 2016-2026 (Kilo Tons)
      7. 4.7.7. Brazil
        1. 4.7.7.1. Brazil Market size and forecast, 2016-2026 (USD Million)
        2. 4.7.7.2. Brazil Market size and forecast, 2016-2026 (Kilo Tons)
      8. 4.7.8. Mexico
        1. 4.7.8.1. Mexico Market size and forecast, 2016-2026 (USD Million)
        2. 4.7.8.2. Mexico Market size and forecast, 2016-2026 (Kilo Tons)
      9. 4.7.9. Rest of Latin America
        1. 4.7.9.1. Rest of Latin America Market size and forecast, 2016-2026 (USD Million)
        2. 4.7.9.2. Rest of Latin America Market size and forecast, 2016-2026 (Kilo Tons)
    8. 4.8. The Middle-East and Africa
      1. 4.8.1. The Middle-East and Africa Cerium Oxide Nanoparticles Market size and forecast, 2016-2026
      2. 4.8.2. The Middle-East and Africa Cerium Oxide Nanoparticles Market, by Country, 2018 - 2025 (USD Million)
      3. 4.8.3. The Middle-East and Africa Market size and forecast, 2016-2026 (Kilo Tons)
      4. 4.8.4. The Middle-East and Africa Cerium Oxide Nanoparticles Market, by Country, 2018 - 2025 (Kilo Tons)
      5. 4.8.5. The Middle-East and Africa Cerium Oxide Nanoparticles Market, by Form, 2016-2026
        1. 4.8.5.1. The Middle-East and Africa Cerium Oxide Nanoparticles Market, by Form, 2016-2026 (USD Million)
        2. 4.8.5.2. The Middle-East and Africa Cerium Oxide Nanoparticles Market, by Form, 2016-2026 (Kilo Tons)
      6. 4.8.6. The Middle-East and Africa Cerium Oxide Nanoparticles Market, by Application, 2016-2026
        1. 4.8.6.1. The Middle-East and Africa Cerium Oxide Nanoparticles Market, by Application, 2016-2026 (USD Million)
        2. 4.8.6.2. The Middle-East and Africa Cerium Oxide Nanoparticles Market, by Application, 2016-2026 (Kilo Tons)
      7. 4.8.7. GCC Countries
        1. 4.8.7.1. GCC Countries Market size and forecast, 2016-2026 (USD Million)
        2. 4.8.7.2. GCC Countries Market size and forecast, 2016-2026 (Kilo Tons)
      8. 4.8.8. South Africa
        1. 4.8.8.1. South Africa Market size and forecast, 2016-2026 (USD Million)
        2. 4.8.8.2. South Africa Market size and forecast, 2016-2026 (Kilo Tons)
      9. 4.8.9. Rest of Middle-East Africa
        1. 4.8.9.1. Rest of Middle-East Africa Market size and forecast, 2016-2026 (USD Million)
        2. 4.8.9.2. Rest of Middle-East Africa Market size and forecast, 2016-2026 (Kilo Tons)
  5. CHAPTER 5. Cerium Oxide Nanoparticles Production, Consumption, Export, Import by Regions
    1. 5.1. Global Cerium Oxide Nanoparticles production and revenue, 2015-2025 (USD Million) (Kilo Tons)
    2. 5.2. Global Import and Export Analysis, by Region
  6. CHAPTER 6. Cerium Oxide Nanoparticles market – Competitive Landscape
    1. 6.1. Competitor Market Share – Revenue
    2. 6.2. Market Concentration Rate Analysis, Top 3 and Top 5 Players
    3. 6.3. Competitor Market Share – Volume
    4. 6.4. Strategic Development
      1. 6.4.1. Acquisitions and Mergers
      2. 6.4.2. New Products
      3. 6.4.3. Research & Development Activities
  7. CHAPTER 7. Company Profiles
    1. 7.1. Cerion
      1. 7.1.1. Company Overview
      2. 7.1.2. Cerion Sales, Revenue, Price, and Gross Margin
      3. 7.1.3. Product portfolio
      4. 7.1.4. Recent initiatives
    2. 7.2. Plasmachem
      1. 7.2.1. Company Overview
      2. 7.2.2. Plasmachem Sales, Revenue, Price, and Gross Margin
      3. 7.2.3. Product portfolio
      4. 7.2.4. Recent initiatives
    3. 7.3. American Elements
      1. 7.3.1. Company Overview
      2. 7.3.2. American Elements Sales, Revenue, Price, and Gross Margin
      3. 7.3.3. Product portfolio
      4. 7.3.4. Recent initiatives
    4. 7.4. Inframat Advanced Materials
      1. 7.4.1. Company Overview
      2. 7.4.2. Inframat Advanced Materials Sales, Revenue, Price, and Gross Margin
      3. 7.4.3. Product portfolio
      4. 7.4.4. Recent initiatives
    5. 7.5. NYACOL Nano Technologies
      1. 7.5.1. Company Overview
      2. 7.5.2. NYACOL Nano Technologies Sales, Revenue, Price, and Gross Margin
      3. 7.5.3. Product portfolio
      4. 7.5.4. Recent initiatives
    6. 7.6. Nanophase Technologies
      1. 7.6.1. Company Overview
      2. 7.6.2. Nanophase Technologies Sales, Revenue, Price, and Gross Margin
      3. 7.6.3. Product portfolio
      4. 7.6.4. Recent initiatives
    7. 7.7. Others
      1. 7.7.1. Company Overview
      2. 7.7.2. Others Sales, Revenue, Price, and Gross Margin
      3. 7.7.3. Product portfolio
      4. 7.7.4. Recent initiatives
  8. CHAPTER 8. Cerium Oxide Nanoparticles — Industry Analysis
    1. 8.1. Introduction and Taxonomy
    2. 8.2. Cerium Oxide Nanoparticles Market – Key Trends
      1. 8.2.1. Market Drivers
      2. 8.2.2. Market Restraints
      3. 8.2.3. Market Opportunities
    3. 8.3. Value Chain Analysis
    4. 8.4. Key Mandates and Regulations
    5. 8.5. Technology Roadmap and Timeline
    6. 8.6. Cerium Oxide Nanoparticles market – Attractiveness Analysis
      1. 8.6.1. By Form
      2. 8.6.2. By Application
      3. 8.6.3. By Region
  9. CHAPTER 9. Raw Material analysis
    1. 9.1. Cerium Oxide Nanoparticles Key Raw Material Analysis
      1. 9.1.1. Key Raw Materials
      2. 9.1.2. Price Trend of Key Raw Materials
    2. 9.2. Key Suppliers of Raw Materials
    3. 9.3. Proportion of Manufacturing Cost Structure
      1. 9.3.1. Raw Materials
      2. 9.3.2. Labor Cost
    4. 9.4. Manufacturing Expenses Analysis of Cerium Oxide Nanoparticles
  10. CHAPTER 10. Industrial Chain, Sourcing Strategy and Downstream Buyers
    1. 10.1. Cerium Oxide Nanoparticles Industrial Chain Analysis
    2. 10.2. Upstream Raw Materials Sourcing
      1. 10.2.1. Risk Mitigation:
      2. 10.2.2. Supplier Relationships:
      3. 10.2.3. Business Processes:
      4. 10.2.4. Securing the Product:
    3. 10.3. Raw Materials Sources of Cerium Oxide Nanoparticles Major Manufacturers in 2016
    4. 10.4. Downstream Buyers
    5. 10.5. Distributors/Traders List
  11. CHAPTER 11. Marketing Strategy Analysis, Distributors
    1. 11.1. Marketing Channel
    2. 11.2. Direct Marketing
    3. 11.3. Indirect Marketing
    4. 11.4. Marketing Channel Development Trend
    5. 11.5. Economic/Political Environmental Change
  12. CHAPTER 12. Report Conclusion
  13. CHAPTER 13. Research Approach & Methodology
    1. 13.1. Report Description
    2. 13.2. Research Scope
    3. 13.3. Research Methodology
      1. 13.3.1. Secondary Research
      2. 13.3.2. Primary Research
      3. 13.3.3. Models
        1. 13.3.3.1. Company Share Analysis Model
        2. 13.3.3.2. Revenue Based Modeling
        3. 13.3.3.3. Research Limitations

        List of Figures

        FIG. 1 Global Cerium Oxide Nanoparticles Market, 2016-2026 (USD Million)
        FIG. 2 Global Cerium Oxide Nanoparticles Market Share, by Form, 2018 & 2025 (USD Million)
        FIG. 3 Global Cerium Oxide Nanoparticles Market share, by Form, 2018 & 2025 (Kilo Tons)
        FIG. 4 Global Dispersion Cerium Oxide Nanoparticles Market, 2016-2026 (USD Million)
        FIG. 5 Global Dispersion Cerium Oxide Nanoparticles  Market, 2016-2026 (Kilo Tons)
        FIG. 6 Global Powder Cerium Oxide Nanoparticles Market, 2016-2026 (USD Million)
        FIG. 7 Global Powder Cerium Oxide Nanoparticles  Market, 2016-2026 (Kilo Tons)
        FIG. 8 Global Cerium Oxide Nanoparticles Market Share, by Application, 2018 & 2025 (USD Million)
        FIG. 9 Global Cerium Oxide Nanoparticles Market share, by Application, 2018 & 2025 (Kilo Tons)
        FIG. 10 Global Chemical Mechanical Planarization Cerium Oxide Nanoparticles Market, 2016-2026 (USD Million)
        FIG. 11 Global Chemical Mechanical Planarization Cerium Oxide Nanoparticles  Market, 2016-2026 (Kilo Tons)
        FIG. 12 Global Catalyst Cerium Oxide Nanoparticles Market, 2016-2026 (USD Million)
        FIG. 13 Global Catalyst Cerium Oxide Nanoparticles  Market, 2016-2026 (Kilo Tons)
        FIG. 14 Global Biomedical Cerium Oxide Nanoparticles Market, 2016-2026 (USD Million)
        FIG. 15 Global Biomedical Cerium Oxide Nanoparticles  Market, 2016-2026 (Kilo Tons)
        FIG. 16 Global Energy Cerium Oxide Nanoparticles Market, 2016-2026 (USD Million)
        FIG. 17 Global Energy Cerium Oxide Nanoparticles  Market, 2016-2026 (Kilo Tons)
        FIG. 18 Global Cerium Oxide Nanoparticles Market Share, by Region, 2018 & 2025
        FIG. 19 Global Cerium Oxide Nanoparticles Market Share, by Region, 2018 & 2025
        FIG. 20 North America Cerium Oxide Nanoparticles Market, 2016-2026
        FIG. 21 North America Cerium Oxide Nanoparticles  Market, 2016-2026 (Kilo Tons)
        FIG. 22 U.S. Cerium Oxide Nanoparticles Market, 2016-2026
        FIG. 23 U.S. Cerium Oxide Nanoparticles  Market, 2016-2026 (Kilo Tons)
        FIG. 24 Canada Cerium Oxide Nanoparticles Market, 2016-2026
        FIG. 25 Canada Cerium Oxide Nanoparticles  Market, 2016-2026 (Kilo Tons)
        FIG. 26 Europe Cerium Oxide Nanoparticles Market, 2016-2026
        FIG. 27 Europe Cerium Oxide Nanoparticles  Market, 2016-2026 (Kilo Tons)
        FIG. 28 Germany Cerium Oxide Nanoparticles Market, 2016-2026
        FIG. 29 Germany Cerium Oxide Nanoparticles  Market, 2016-2026 (Kilo Tons)
        FIG. 30 France Cerium Oxide Nanoparticles Market, 2016-2026
        FIG. 31 France Cerium Oxide Nanoparticles  Market, 2016-2026 (Kilo Tons)
        FIG. 32 U.K. Cerium Oxide Nanoparticles Market, 2016-2026
        FIG. 33 U.K. Cerium Oxide Nanoparticles  Market, 2016-2026 (Kilo Tons)
        FIG. 34 Italy Cerium Oxide Nanoparticles Market, 2016-2026
        FIG. 35 Italy Cerium Oxide Nanoparticles  Market, 2016-2026 (Kilo Tons)
        FIG. 36 Spain Cerium Oxide Nanoparticles Market, 2016-2026
        FIG. 37 Spain Cerium Oxide Nanoparticles  Market, 2016-2026 (Kilo Tons)
        FIG. 38 Rest of Europe Cerium Oxide Nanoparticles Market, 2016-2026
        FIG. 39 Rest of Europe Cerium Oxide Nanoparticles  Market, 2016-2026 (Kilo Tons)
        FIG. 40 Asia Pacific Cerium Oxide Nanoparticles Market, 2016-2026
        FIG. 41 Asia Pacific Cerium Oxide Nanoparticles  Market, 2016-2026 (Kilo Tons)
        FIG. 42 China Cerium Oxide Nanoparticles Market, 2016-2026
        FIG. 43 China Cerium Oxide Nanoparticles  Market, 2016-2026 (Kilo Tons)
        FIG. 44 Japan Cerium Oxide Nanoparticles Market, 2016-2026
        FIG. 45 Japan Cerium Oxide Nanoparticles  Market, 2016-2026 (Kilo Tons)
        FIG. 46 India Cerium Oxide Nanoparticles Market, 2016-2026
        FIG. 47 India Cerium Oxide Nanoparticles  Market, 2016-2026 (Kilo Tons)
        FIG. 48 South  Korea Cerium Oxide Nanoparticles Market, 2016-2026
        FIG. 49 South  Korea Cerium Oxide Nanoparticles  Market, 2016-2026 (Kilo Tons)
        FIG. 50 South-East Asia Cerium Oxide Nanoparticles Market, 2016-2026
        FIG. 51 South-East Asia Cerium Oxide Nanoparticles  Market, 2016-2026 (Kilo Tons)
        FIG. 52 Rest of Asia Pacific Cerium Oxide Nanoparticles Market, 2016-2026
        FIG. 53 Rest of Asia Pacific Cerium Oxide Nanoparticles  Market, 2016-2026 (Kilo Tons)
        FIG. 54 Latin America Cerium Oxide Nanoparticles Market, 2016-2026
        FIG. 55 Latin America Cerium Oxide Nanoparticles  Market, 2016-2026 (Kilo Tons)
        FIG. 56 Brazil Cerium Oxide Nanoparticles Market, 2016-2026
        FIG. 57 Brazil Cerium Oxide Nanoparticles  Market, 2016-2026 (Kilo Tons)
        FIG. 58 Mexico Cerium Oxide Nanoparticles Market, 2016-2026
        FIG. 59 Mexico Cerium Oxide Nanoparticles  Market, 2016-2026 (Kilo Tons)
        FIG. 60 Rest of Latin America Cerium Oxide Nanoparticles Market, 2016-2026
        FIG. 61 Rest of Latin America Cerium Oxide Nanoparticles  Market, 2016-2026 (Kilo Tons)
        FIG. 62 The Middle-East and Africa Cerium Oxide Nanoparticles Market, 2016-2026
        FIG. 63 The Middle-East and Africa Cerium Oxide Nanoparticles  Market, 2016-2026 (Kilo Tons)
        FIG. 64 GCC Countries Cerium Oxide Nanoparticles Market, 2016-2026
        FIG. 65 GCC Countries Cerium Oxide Nanoparticles  Market, 2016-2026 (Kilo Tons)
        FIG. 66 South Africa Cerium Oxide Nanoparticles Market, 2016-2026
        FIG. 67 South Africa Cerium Oxide Nanoparticles  Market, 2016-2026 (Kilo Tons)
        FIG. 68 Rest of Middle-East Africa Cerium Oxide Nanoparticles Market, 2016-2026
        FIG. 69 Rest of Middle-East Africa Cerium Oxide Nanoparticles  Market, 2016-2026 (Kilo Tons)
        FIG. 70 Global Cerium Oxide Nanoparticles production and revenue, 2015-2025 (USD Million) (Kilo Tons)
        FIG. 71 North America Cerium Oxide Nanoparticles production and revenue, 2015-2025 (USD Million) (Kilo Tons)
        FIG. 72 Europe Cerium Oxide Nanoparticles production and revenue, 2015-2025 (USD Million) (Kilo Tons)
        FIG. 73 Asia Pacific Cerium Oxide Nanoparticles production and revenue, 2015-2025 (USD Million) (Kilo Tons)
        FIG. 74 Latin America Cerium Oxide Nanoparticles production and revenue, 2015-2025 (USD Million) (Kilo Tons)
        FIG. 75 Middle East and Africa Cerium Oxide Nanoparticles production and revenue, 2015-2025 (USD Million) (Kilo Tons)
        FIG. 76 Competitor Market Share – Revenue
        FIG. 77 Competitor Market Share – Volume
        FIG. 78 Cerion Revenue and Growth Rate
        FIG. 79 Cerion Market Share
        FIG. 80 Plasmachem Revenue and Growth Rate
        FIG. 81 Plasmachem Market Share
        FIG. 82 American Elements Revenue and Growth Rate
        FIG. 83 American Elements Market Share
        FIG. 84 Inframat Advanced Materials Revenue and Growth Rate
        FIG. 85 Inframat Advanced Materials Market Share
        FIG. 86 NYACOL Nano Technologies Revenue and Growth Rate
        FIG. 87 NYACOL Nano Technologies Market Share
        FIG. 88 Nanophase Technologies Revenue and Growth Rate
        FIG. 89 Nanophase Technologies Market Share
        FIG. 90 Others Revenue and Growth Rate
        FIG. 91 Others Market Share
        FIG. 92 Market Dynamics
        FIG. 93 Global Cerium Oxide Nanoparticles – Value Chain Analysis
        FIG. 94 Key Mandates and Regulations
        FIG. 95 Technology Roadmap and Timeline
        FIG. 96 Market Attractiveness Analysis – By Form
        FIG. 97 Market Attractiveness Analysis – By Application
        FIG. 98 Market Attractiveness Analysis – By Region
        FIG. 99 Manufacturing Cost Structure of Cerium Oxide Nanoparticles
        FIG. 100 Cerium Oxide Nanoparticles Industrial Chain Analysis
        FIG. 101 Market Channel
        FIG. 102 Marketing Channel Development Trend
        FIG. 103 Growth in World Gross Product, 2008-2018

        List of Tables

        TABLE 1 Global Cerium Oxide Nanoparticles market, 2018 & 2025 (USD Million)
        TABLE 2 Global Cerium Oxide Nanoparticles market, by Form, 2016-2026 (USD Million)
        TABLE 3 Global Cerium Oxide Nanoparticles market, by Form, 2016-2026 (Kilo Tons)
        TABLE 4 Global Cerium Oxide Nanoparticles market, by Application, 2016-2026 (USD Million)
        TABLE 5 Global Cerium Oxide Nanoparticles market, by Application, 2016-2026 (Kilo Tons)
        TABLE 6 Global Cerium Oxide Nanoparticles market, by region, 2016-2026 (USD Million)
        TABLE 7 Global Cerium Oxide Nanoparticles market, by region, 2016-2026 (Kilo Tons)
        TABLE 8 North America Cerium Oxide Nanoparticles Market, by Form, 2016-2026 (USD Million)
        TABLE 9 North America Cerium Oxide Nanoparticles Market, by Form, 2016-2026 (Kilo Tons)
        TABLE 10 North America Cerium Oxide Nanoparticles Market, by Application, 2016-2026 (USD Million)
        TABLE 11 North America Cerium Oxide Nanoparticles Market, by Application, 2016-2026 (Kilo Tons)
        TABLE 12 Europe Cerium Oxide Nanoparticles Market, by Form, 2016-2026 (USD Million)
        TABLE 13 Europe Cerium Oxide Nanoparticles Market, by Form, 2016-2026 (Kilo Tons)
        TABLE 14 Europe Cerium Oxide Nanoparticles Market, by Application, 2016-2026 (USD Million)
        TABLE 15 Europe Cerium Oxide Nanoparticles Market, by Application, 2016-2026 (Kilo Tons)
        TABLE 16 Asia Pacific Cerium Oxide Nanoparticles Market, by Form, 2016-2026 (USD Million)
        TABLE 17 Asia Pacific Cerium Oxide Nanoparticles Market, by Form, 2016-2026 (Kilo Tons)
        TABLE 18 Asia Pacific Cerium Oxide Nanoparticles Market, by Application, 2016-2026 (USD Million)
        TABLE 19 Asia Pacific Cerium Oxide Nanoparticles Market, by Application, 2016-2026 (Kilo Tons)
        TABLE 20 Latin America Cerium Oxide Nanoparticles Market, by Form, 2016-2026 (USD Million)
        TABLE 21 Latin America Cerium Oxide Nanoparticles Market, by Form, 2016-2026 (Kilo Tons)
        TABLE 22 Latin America Cerium Oxide Nanoparticles Market, by Application, 2016-2026 (USD Million)
        TABLE 23 Latin America Cerium Oxide Nanoparticles Market, by Application, 2016-2026 (Kilo Tons)
        TABLE 24 The Middle-East and Africa Cerium Oxide Nanoparticles Market, by Form, 2016-2026 (USD Million)
        TABLE 25 The Middle-East and Africa Cerium Oxide Nanoparticles Market, by Form, 2016-2026 (Kilo Tons)
        TABLE 26 The Middle-East and Africa Cerium Oxide Nanoparticles Market, by Application, 2016-2026 (USD Million)
        TABLE 27 The Middle-East and Africa Cerium Oxide Nanoparticles Market, by Application, 2016-2026 (Kilo Tons)
        TABLE 28 North America Cerium Oxide Nanoparticles Production, Consumption, Export, Import, 2016-2019
        TABLE 29 Europe Cerium Oxide Nanoparticles Production, Consumption, Export, Import, 2016-2019
        TABLE 30 Asia Pacific Cerium Oxide Nanoparticles Production, Consumption, Export, Import, 2016-2019
        TABLE 31 Latin America Cerium Oxide Nanoparticles Production, Consumption, Export, Import, 2016-2019
        TABLE 32 Middle East & Africa Cerium Oxide Nanoparticles Production, Consumption, Export, Import, 2016-2019
        TABLE 33 Global Cerium Oxide Nanoparticles Market - Company Revenue Analysis 2016-2019 (USD Million)
        TABLE 34 Global Cerium Oxide Nanoparticles Market - Company Revenue Share Analysis 2016-2019(%)
        TABLE 35 Global Cerium Oxide Nanoparticles Market - Company Volume Analysis 2016-2019 (Kilo Tons)
        TABLE 36 Global Cerium Oxide Nanoparticles Market - Company Volume Share Analysis 2016-2019(%)
        TABLE 37 Acquisitions and Mergers
        TABLE 38 New Product/Service Launch
        TABLE 39 Research & Development Activities
        TABLE 40 Market Drivers
        TABLE 41 Market Restraints
        TABLE 42 Market Opportunities
        TABLE 43 Production Base and Market Concentration Rate of Raw Material
        TABLE 44 Key Suppliers of Raw Materials
        TABLE 45 Raw Materials Sources of Cerium Oxide Nanoparticles Major Manufacturers in 2016
        TABLE 46 Major Buyers of Cerium Oxide Nanoparticles
        TABLE 47 Distributors/Traders of Cerium Oxide Nanoparticles by Region

Industry Major Market Players

  • Cerion
  •  Plasmachem
  •  American Elements
  •  Inframat Advanced Materials
  •  NYACOL Nano Technologies
  •  Nanophase Technologies