Search Market Research Report

Discover Our Latest Reports
Discover Our Featured Reports
Discover Top Selling Reports

Caustic Soda Market Size, Share Global Analysis Report, 2020–2026

report img

Caustic Soda Market By Production Process (Diaphragm Cell, Membrane Cell, and Others) and By Application (Organic Chemical, Water Treatment , Inorganic Chemical, Soap & Detergent, Alumina, Pulp & Paper, and Others): Global Industry Outlook, Market Size, Business Intelligence, Consumer Preferences, Statistical Surveys, Comprehensive Analysis, Historical Developments, Current Trends, and Forecast 2020–2026

Industry Insights

The Caustic Soda market report analyzes and notifies the industry statistics at the global as well as regional and country levels in order to acquire a thorough perspective of the entire Caustic Soda market. The historical and past insights are provided for FY 2016 to FY 2019 whereas projected trends are delivered for FY 2020 to FY 2026. The quantitative and numerical data is represented in terms of both volume (Units) and value (USD Million) from FY 2016 – 2026.

This specialized and expertise-oriented industry research report scrutinizes the technical and commercial business outlook of the Caustic Soda industry. The report analyzes and declares the historical and current trends analysis of the Caustic Soda industry and subsequently recommends the projected trends anticipated to be observed in the Caustic Soda market during the upcoming years.

Caustic Soda Market Size

To know more about this report | Request Free Sample Copy


logoKey Insights from Primary Research

  • Asia Pacific is expected to hold the largest market share of the Caustic Soda market in terms of revenue, in 2019.
  • The “Membrane Cell” category, on the basis of production process segmentation, contributing as the highest revenue-generating category.
  • According to end-use based segmentation the “Soap & Detergent” category, was the leading revenue-generating category in 2019.
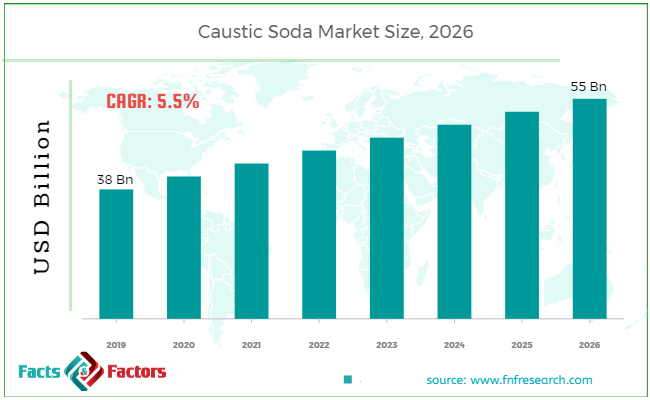
  • It was recognized through primary research that the Caustic Soda market was valued at around USD 38 Billion in 2019.
  • According our primary respondents, the Caustic Soda market is set to grow annually at a rate of around 5.5%.

logoKey Recommendations from Analysts

  • As per our Analysts, The increase in demand for consumer products such as soaps and detergents owing to rising awareness regarding hygiene is projected to fuel market growth.
  • The growth of textiles and pulp and paper industry is estimated to generate significant demand for caustic soda.
  • The significant textile production in countries like India and China is projected to boost market growth. Around 40% of total production is delivered by China owing to the presence of major industries in the country.
  • North America is projected to grow at a moderate growth rate. The demand for textiles and soap is estimated to make favorable conditions for the caustic soda market in North America.
  • The membrane cell production process has unique advantages. The sodium hydroxide solution is formed in this process without contaminating another solution. The solution delivered by this method is very pure in nature.

logoCaustic Soda Market Share in 2019, by Application


The quantitative data is further underlined and reinforced by comprehensive qualitative data which comprises various across-the-board market dynamics. The rationales which directly or indirectly impact the Caustic Soda industry are exemplified through parameters such as growth drivers, restraints, challenges, and opportunities among other impacting factors.

Throughout our research report, we have encompassed all the proven models and tools of industry analysis and extensively illustrated all the key business strategies and business models adopted in the Caustic Soda industry. The report provides an all-inclusive and detailed competitive landscape prevalent in the Caustic Soda market.

The report utilizes established industry analysis tools and models such as Porter’s Five Forces framework to analyze and recognize critical business strategies adopted by various stakeholders involved in the entire value chain of the Caustic Soda industry. The Caustic Soda market report additionally employs SWOT analysis and PESTLE analysis models for further in-depth analysis.

The report study further includes an in-depth analysis of industry players' market shares and provides an overview of leading players' market position in the Caustic Soda sector. Key strategic developments in the Caustic Soda market competitive landscape such as acquisitions & mergers, inaugurations of different products and services, partnerships & joint ventures, MoU agreements, VC & funding activities, R&D activities, and geographic expansion among other noteworthy activities by key players of the Caustic Soda market are appropriately highlighted in the report.

The Caustic Soda market research report delivers an acute valuation and taxonomy of the Caustic Soda industry by practically splitting the market on the basis of different types, applications, and regions. Through the analysis of the historical and projected trends, all the segments and sub-segments were evaluated through the bottom-up approach, and different market sizes have been projected for FY 2020 to FY 2026. The regional segmentation of the Caustic Soda industry includes the complete classification of all the major continents including North America, Latin America, Europe, Asia Pacific, and Middle East & Africa. Further, country-wise data for the Caustic Soda industry is provided for the leading economies of the world.

The caustic soda market is segmented based on production process and application. On the basis of production process segmentation, the market is classified into diaphragm cells, membrane cells, and others. In terms of Application segmentation, the market is bifurcated into organic chemical, water treatment, inorganic chemical, soap & detergent, alumina, pulp & paper, and others.

logoReport Scope

Report Attribute

Details

Market Size in 2019

USD 38 Billion

Projected Market Size in 2026

USD 55 Billion

CAGR Growth Rate

5.5% CAGR

Base Year

2019

Forecast Years

2020-2026

Key Market Players

Dow Chemical Company, Tata Chemicals Limited., Occidental Petroleum Corporation, BAYER AG, AkzoNobel, Arkema Group, Solvay SA, Eastman Chemical Company, BASF, and FMC Corporation.

Key Segment

By Production Process, By Application, By Region

Major Regions Covered

North America, Europe, Asia Pacific, Latin America, and the Middle East & Africa

Purchase Options

Request customized purchase options to meet your research needs. Explore purchase options

logoSome of the essential players operating in the Caustic Soda market, but not restricted to include

  • Dow Chemical Company
  •  Tata Chemicals Limited.
  •  Occidental Petroleum Corporation
  •  BAYER AG
  •  AkzoNobel
  •  Arkema Group
  •  Solvay SA
  •  Eastman Chemical Company
  •  BASF
  •  FMC Corporation

The taxonomy of the Caustic Soda industry by its scope and segmentation is as follows:

logo By Production Process Segmentation Analysis (Customizable)

  • Diaphragm Cell
  • Membrane Cell
  • Others

logo By Application Segmentation Analysis (Customizable)

  • Organic Chemical
  • Water Treatment
  • Inorganic Chemical
  • Soap & Detergent
  • Alumina
  • Pulp & Paper
  • Others

logo Regional Segmentation Analysis (Customizable)

  • North America
    • The U.S.
    • Canada
  • Europe
    • Germany
    • The UK
    • France
    • Spain
    • Italy
    • Rest of Europe
  • Asia Pacific
    • China
    • Japan
    • India
    • South Korea
    • Southeast Asia
    • Rest of Asia Pacific
  • Latin America
    • Brazil
    • Mexico
    • Rest of Latin America
  • Middle East & Africa
    • GCC
    • South Africa
    • Rest of the Middle East & Africa

Table of Content

  1. CHAPTER 1. Executive Summary
  2. CHAPTER 2. Caustic Soda market – Production Process Analysis
    1. 2.1. Global Caustic Soda Market – Production Process Overview
    2. 2.2. Global Caustic Soda Market Share, by Production Process, 2019 & 2026 (USD Million)
    3. 2.3. Global Caustic Soda Market share, by Production Process, 2019 & 2026 (Kilo Tons)
    4. 2.4. Diaphragm Cell
      1. 2.4.1. Global Diaphragm Cell Caustic Soda Market, 2016-2026 (USD Million)
      2. 2.4.2. Global Diaphragm Cell Caustic Soda Market, 2016-2026 (Kilo Tons)
    5. 2.5. Membrane Cell
      1. 2.5.1. Global Membrane Cell Caustic Soda Market, 2016-2026 (USD Million)
      2. 2.5.2. Global Membrane Cell Caustic Soda Market, 2016-2026 (Kilo Tons)
    6. 2.6. Others
      1. 2.6.1. Global Others Caustic Soda Market, 2016-2026 (USD Million)
      2. 2.6.2. Global Others Caustic Soda Market, 2016-2026 (Kilo Tons)
  3. CHAPTER 3. Caustic Soda market – Application Analysis
    1. 3.1. Global Caustic Soda Market – Application Overview
    2. 3.2. Global Caustic Soda Market Share, by Application, 2019 & 2026 (USD Million)
    3. 3.3. Global Caustic Soda Market share, by Application, 2019 & 2026 (Kilo Tons)
    4. 3.4. Organic Chemical
      1. 3.4.1. Global Organic Chemical Caustic Soda Market, 2016-2026 (USD Million)
      2. 3.4.2. Global Organic Chemical Caustic Soda Market, 2016-2026 (Kilo Tons)
    5. 3.5. Water Treatment
      1. 3.5.1. Global Water Treatment Caustic Soda Market, 2016-2026 (USD Million)
      2. 3.5.2. Global Water Treatment Caustic Soda Market, 2016-2026 (Kilo Tons)
    6. 3.6. Inorganic Chemical
      1. 3.6.1. Global Inorganic Chemical Caustic Soda Market, 2016-2026 (USD Million)
      2. 3.6.2. Global Inorganic Chemical Caustic Soda Market, 2016-2026 (Kilo Tons)
    7. 3.7. Soap & Detergent
      1. 3.7.1. Global Soap & Detergent Caustic Soda Market, 2016-2026 (USD Million)
      2. 3.7.2. Global Soap & Detergent Caustic Soda Market, 2016-2026 (Kilo Tons)
    8. 3.8. Alumina
      1. 3.8.1. Global Alumina Caustic Soda Market, 2016-2026 (USD Million)
      2. 3.8.2. Global Alumina Caustic Soda Market, 2016-2026 (Kilo Tons)
    9. 3.9. Pulp & Paper
      1. 3.9.1. Global Pulp & Paper Caustic Soda Market, 2016-2026 (USD Million)
      2. 3.9.2. Global Pulp & Paper Caustic Soda Market, 2016-2026 (Kilo Tons)
    10. 3.10. Others
      1. 3.10.1. Global Others Caustic Soda Market, 2016-2026 (USD Million)
      2. 3.10.2. Global Others Caustic Soda Market, 2016-2026 (Kilo Tons)
  4. CHAPTER 4. Caustic Soda market – Regional Analysis
    1. 4.1. Global Caustic Soda Market Regional Overview
    2. 4.2. Global Caustic Soda Market Share, by Region, 2019 & 2026 (Value)
    3. 4.3. Global Caustic Soda Market Share, by Region, 2019 & 2026 (Volume)
    4. 4.4. North America
      1. 4.4.1. North America Caustic Soda Market size and forecast, 2016-2026
      2. 4.4.2. North America Caustic Soda Market, by Country, 2019 - 2026 (USD Million)
      3. 4.4.3. North America Market size and forecast, 2016-2026 (Kilo Tons)
      4. 4.4.4. North America Caustic Soda Market, by Country, 2019 - 2026 (Kilo Tons)
      5. 4.4.5. North America Caustic Soda Market, by Production Process, 2016-2026
        1. 4.4.5.1. North America Caustic Soda Market, by Production Process, 2016-2026 (USD Million)
        2. 4.4.5.2. North America Caustic Soda Market, by Production Process, 2016-2026 (Kilo Tons)
      6. 4.4.6. North America Caustic Soda Market, by Application, 2016-2026
        1. 4.4.6.1. North America Caustic Soda Market, by Application, 2016-2026 (USD Million)
        2. 4.4.6.2. North America Caustic Soda Market, by Application, 2016-2026 (Kilo Tons)
      7. 4.4.7. U.S.
        1. 4.4.7.1. U.S. Market size and forecast, 2016-2026 (USD Million)
        2. 4.4.7.2. U.S. Market size and forecast, 2016-2026 (Kilo Tons)
      8. 4.4.8. Canada
        1. 4.4.8.1. Canada Market size and forecast, 2016-2026 (USD Million)
        2. 4.4.8.2. Canada Market size and forecast, 2016-2026 (Kilo Tons)
    5. 4.5. Europe
      1. 4.5.1. Europe Caustic Soda Market size and forecast, 2016-2026
      2. 4.5.2. Europe Caustic Soda Market, by Country, 2019 - 2026 (USD Million)
      3. 4.5.3. Europe Market size and forecast, 2016-2026 (Kilo Tons)
      4. 4.5.4. Europe Caustic Soda Market, by Country, 2019 - 2026 (Kilo Tons)
      5. 4.5.5. Europe Caustic Soda Market, by Production Process, 2016-2026
        1. 4.5.5.1. Europe Caustic Soda Market, by Production Process, 2016-2026 (USD Million)
        2. 4.5.5.2. Europe Caustic Soda Market, by Production Process, 2016-2026 (Kilo Tons)
      6. 4.5.6. Europe Caustic Soda Market, by Application, 2016-2026
        1. 4.5.6.1. Europe Caustic Soda Market, by Application, 2016-2026 (USD Million)
        2. 4.5.6.2. Europe Caustic Soda Market, by Application, 2016-2026 (Kilo Tons)
      7. 4.5.7. Germany
        1. 4.5.7.1. Germany Market size and forecast, 2016-2026 (USD Million)
        2. 4.5.7.2. Germany Market size and forecast, 2016-2026 (Kilo Tons)
      8. 4.5.8. France
        1. 4.5.8.1. France Market size and forecast, 2016-2026 (USD Million)
        2. 4.5.8.2. France Market size and forecast, 2016-2026 (Kilo Tons)
      9. 4.5.9. U.K.
        1. 4.5.9.1. U.K. Market size and forecast, 2016-2026 (USD Million)
        2. 4.5.9.2. U.K. Market size and forecast, 2016-2026 (Kilo Tons)
      10. 4.5.10. Italy
        1. 4.5.10.1. Italy Market size and forecast, 2016-2026 (USD Million)
        2. 4.5.10.2. Italy Market size and forecast, 2016-2026 (Kilo Tons)
      11. 4.5.11. Spain
        1. 4.5.11.1. Spain Market size and forecast, 2016-2026 (USD Million)
        2. 4.5.11.2. Spain Market size and forecast, 2016-2026 (Kilo Tons)
      12. 4.5.12. Rest of Europe
        1. 4.5.12.1. Rest of Europe Market size and forecast, 2016-2026 (USD Million)
        2. 4.5.12.2. Rest of Europe Market size and forecast, 2016-2026 (Kilo Tons)
    6. 4.6. Asia Pacific
      1. 4.6.1. Asia Pacific Caustic Soda Market size and forecast, 2016-2026
      2. 4.6.2. Asia Pacific Caustic Soda Market, by Country, 2019 - 2026 (USD Million)
      3. 4.6.3. Asia Pacific Market size and forecast, 2016-2026 (Kilo Tons)
      4. 4.6.4. Asia Pacific Caustic Soda Market, by Country, 2019 - 2026 (Kilo Tons)
      5. 4.6.5. Asia Pacific Caustic Soda Market, by Production Process, 2016-2026
        1. 4.6.5.1. Asia Pacific Caustic Soda Market, by Production Process, 2016-2026 (USD Million)
        2. 4.6.5.2. Asia Pacific Caustic Soda Market, by Production Process, 2016-2026 (Kilo Tons)
      6. 4.6.6. Asia Pacific Caustic Soda Market, by Application, 2016-2026
        1. 4.6.6.1. Asia Pacific Caustic Soda Market, by Application, 2016-2026 (USD Million)
        2. 4.6.6.2. Asia Pacific Caustic Soda Market, by Application, 2016-2026 (Kilo Tons)
      7. 4.6.7. China
        1. 4.6.7.1. China Market size and forecast, 2016-2026 (USD Million)
        2. 4.6.7.2. China Market size and forecast, 2016-2026 (Kilo Tons)
      8. 4.6.8. Japan
        1. 4.6.8.1. Japan Market size and forecast, 2016-2026 (USD Million)
        2. 4.6.8.2. Japan Market size and forecast, 2016-2026 (Kilo Tons)
      9. 4.6.9. India
        1. 4.6.9.1. India Market size and forecast, 2016-2026 (USD Million)
        2. 4.6.9.2. India Market size and forecast, 2016-2026 (Kilo Tons)
      10. 4.6.10. South Korea
        1. 4.6.10.1. South Korea Market size and forecast, 2016-2026 (USD Million)
        2. 4.6.10.2. South Korea Market size and forecast, 2016-2026 (Kilo Tons)
      11. 4.6.11. South-East Asia
        1. 4.6.11.1. South-East Asia Market size and forecast, 2016-2026 (USD Million)
        2. 4.6.11.2. South-East Asia Market size and forecast, 2016-2026 (Kilo Tons)
      12. 4.6.12. Rest of Asia Pacific
        1. 4.6.12.1. Rest of Asia Pacific Market size and forecast, 2016-2026 (USD Million)
        2. 4.6.12.2. Rest of Asia Pacific Market size and forecast, 2016-2026 (Kilo Tons)
    7. 4.7. Latin America
      1. 4.7.1. Latin America Caustic Soda Market size and forecast, 2016-2026
      2. 4.7.2. Latin America Caustic Soda Market, by Country, 2019 - 2026 (USD Million)
      3. 4.7.3. Latin America Market size and forecast, 2016-2026 (Kilo Tons)
      4. 4.7.4. Latin America Caustic Soda Market, by Country, 2019 - 2026 (Kilo Tons)
      5. 4.7.5. Latin America Caustic Soda Market, by Production Process, 2016-2026
        1. 4.7.5.1. Latin America Caustic Soda Market, by Production Process, 2016-2026 (USD Million)
        2. 4.7.5.2. Latin America Caustic Soda Market, by Production Process, 2016-2026 (Kilo Tons)
      6. 4.7.6. Latin America Caustic Soda Market, by Application, 2016-2026
        1. 4.7.6.1. Latin America Caustic Soda Market, by Application, 2016-2026 (USD Million)
        2. 4.7.6.2. Latin America Caustic Soda Market, by Application, 2016-2026 (Kilo Tons)
      7. 4.7.7. Brazil
        1. 4.7.7.1. Brazil Market size and forecast, 2016-2026 (USD Million)
        2. 4.7.7.2. Brazil Market size and forecast, 2016-2026 (Kilo Tons)
      8. 4.7.8. Mexico
        1. 4.7.8.1. Mexico Market size and forecast, 2016-2026 (USD Million)
        2. 4.7.8.2. Mexico Market size and forecast, 2016-2026 (Kilo Tons)
      9. 4.7.9. Rest of Latin America
        1. 4.7.9.1. Rest of Latin America Market size and forecast, 2016-2026 (USD Million)
        2. 4.7.9.2. Rest of Latin America Market size and forecast, 2016-2026 (Kilo Tons)
    8. 4.8. The Middle-East and Africa
      1. 4.8.1. The Middle-East and Africa Caustic Soda Market size and forecast, 2016-2026
      2. 4.8.2. The Middle-East and Africa Caustic Soda Market, by Country, 2019 - 2026 (USD Million)
      3. 4.8.3. The Middle-East and Africa Market size and forecast, 2016-2026 (Kilo Tons)
      4. 4.8.4. The Middle-East and Africa Caustic Soda Market, by Country, 2019 - 2026 (Kilo Tons)
      5. 4.8.5. The Middle-East and Africa Caustic Soda Market, by Production Process, 2016-2026
        1. 4.8.5.1. The Middle-East and Africa Caustic Soda Market, by Production Process, 2016-2026 (USD Million)
        2. 4.8.5.2. The Middle-East and Africa Caustic Soda Market, by Production Process, 2016-2026 (Kilo Tons)
      6. 4.8.6. The Middle-East and Africa Caustic Soda Market, by Application, 2016-2026
        1. 4.8.6.1. The Middle-East and Africa Caustic Soda Market, by Application, 2016-2026 (USD Million)
        2. 4.8.6.2. The Middle-East and Africa Caustic Soda Market, by Application, 2016-2026 (Kilo Tons)
      7. 4.8.7. GCC Countries
        1. 4.8.7.1. GCC Countries Market size and forecast, 2016-2026 (USD Million)
        2. 4.8.7.2. GCC Countries Market size and forecast, 2016-2026 (Kilo Tons)
      8. 4.8.8. South Africa
        1. 4.8.8.1. South Africa Market size and forecast, 2016-2026 (USD Million)
        2. 4.8.8.2. South Africa Market size and forecast, 2016-2026 (Kilo Tons)
      9. 4.8.9. Rest of Middle-East Africa
        1. 4.8.9.1. Rest of Middle-East Africa Market size and forecast, 2016-2026 (USD Million)
        2. 4.8.9.2. Rest of Middle-East Africa Market size and forecast, 2016-2026 (Kilo Tons)
  5. CHAPTER 5. Caustic Soda Production, Consumption, Export, Import by Regions
    1. 5.1. Global Caustic Soda production and revenue, 2016-2026 (USD Million) (Kilo Tons)
    2. 5.2. Global Import and Export Analysis, by Region
  6. CHAPTER 6. Caustic Soda market – Competitive Landscape
    1. 6.1. Competitor Market Share – Revenue
    2. 6.2. Market Concentration Rate Analysis, Top 3 and Top 5 Players
    3. 6.3. Competitor Market Share – Volume
    4. 6.4. Strategic Development
      1. 6.4.1. Acquisitions and Mergers
      2. 6.4.2. New Products
      3. 6.4.3. Research & Development Activities
  7. CHAPTER 7. Company Profiles
    1. 7.1. Dow Chemical Company
      1. 7.1.1. Company Overview
      2. 7.1.2. Dow Chemical Company Sales, Revenue, Price, and Gross Margin
      3. 7.1.3. Product portfolio
      4. 7.1.4. Recent initiatives
    2. 7.2. Tata Chemicals Limited.
      1. 7.2.1. Company Overview
      2. 7.2.2. Tata Chemicals Limited. Sales, Revenue, Price, and Gross Margin
      3. 7.2.3. Product portfolio
      4. 7.2.4. Recent initiatives
    3. 7.3. Occidental Petroleum Corporation
      1. 7.3.1. Company Overview
      2. 7.3.2. Occidental Petroleum Corporation Sales, Revenue, Price, and Gross Margin
      3. 7.3.3. Product portfolio
      4. 7.3.4. Recent initiatives
    4. 7.4. BAYER AG
      1. 7.4.1. Company Overview
      2. 7.4.2. BAYER AG Sales, Revenue, Price, and Gross Margin
      3. 7.4.3. Product portfolio
      4. 7.4.4. Recent initiatives
    5. 7.5. AkzoNobel
      1. 7.5.1. Company Overview
      2. 7.5.2. AkzoNobel Sales, Revenue, Price, and Gross Margin
      3. 7.5.3. Product portfolio
      4. 7.5.4. Recent initiatives
    6. 7.6. Arkema Group
      1. 7.6.1. Company Overview
      2. 7.6.2. Arkema Group Sales, Revenue, Price, and Gross Margin
      3. 7.6.3. Product portfolio
      4. 7.6.4. Recent initiatives
    7. 7.7. Solvay SA
      1. 7.7.1. Company Overview
      2. 7.7.2. Solvay SA Sales, Revenue, Price, and Gross Margin
      3. 7.7.3. Product portfolio
      4. 7.7.4. Recent initiatives
    8. 7.8. Eastman Chemical Company
      1. 7.8.1. Company Overview
      2. 7.8.2. Eastman Chemical Company Sales, Revenue, Price, and Gross Margin
      3. 7.8.3. Product portfolio
      4. 7.8.4. Recent initiatives
    9. 7.9. BASF
      1. 7.9.1. Company Overview
      2. 7.9.2. BASF Sales, Revenue, Price, and Gross Margin
      3. 7.9.3. Product portfolio
      4. 7.9.4. Recent initiatives
    10. 7.10. FMC Corporation
      1. 7.10.1. Company Overview
      2. 7.10.2. FMC Corporation Sales, Revenue, Price, and Gross Margin
      3. 7.10.3. Product portfolio
      4. 7.10.4. Recent initiatives
  8. CHAPTER 8. Caustic Soda — Industry Analysis
    1. 8.1. Introduction and Taxonomy
    2. 8.2. Caustic Soda Market – Key Trends
      1. 8.2.1. Market Drivers
      2. 8.2.2. Market Restraints
      3. 8.2.3. Market Opportunities
    3. 8.3. Value Chain Analysis
    4. 8.4. Key Mandates and Regulations
    5. 8.5. Technology Roadmap and Timeline
    6. 8.6. Caustic Soda market – Attractiveness Analysis
      1. 8.6.1. By Production Process
      2. 8.6.2. By Application
      3. 8.6.3. By Region
  9. CHAPTER 9. Raw Material analysis
    1. 9.1. Caustic Soda Key Raw Material Analysis
      1. 9.1.1. Key Raw Materials
      2. 9.1.2. Price Trend of Key Raw Materials
    2. 9.2. Key Suppliers of Raw Materials
    3. 9.3. Proportion of Manufacturing Cost Structure
      1. 9.3.1. Raw Materials
      2. 9.3.2. Labor Cost
    4. 9.4. Manufacturing Expenses Analysis of Caustic Soda
  10. CHAPTER 10. Industrial Chain, Sourcing Strategy and Downstream Buyers
    1. 10.1. Caustic Soda Industrial Chain Analysis
    2. 10.2. Upstream Raw Materials Sourcing
      1. 10.2.1. Risk Mitigation:
      2. 10.2.2. Supplier Relationships:
      3. 10.2.3. Business Processes:
      4. 10.2.4. Securing the Product:
    3. 10.3. Raw Materials Sources of Caustic Soda Major Manufacturers in 2016
    4. 10.4. Downstream Buyers
    5. 10.5. Distributors/Traders List
  11. CHAPTER 11. Marketing Strategy Analysis, Distributors
    1. 11.1. Marketing Channel
    2. 11.2. Direct Marketing
    3. 11.3. Indirect Marketing
    4. 11.4. Marketing Channel Development Trend
    5. 11.5. Economic/Political Environmental Change
  12. CHAPTER 12. Report Conclusion
  13. CHAPTER 13. Research Approach & Methodology
    1. 13.1. Report Description
    2. 13.2. Research Scope
    3. 13.3. Research Methodology
      1. 13.3.1. Secondary Research
      2. 13.3.2. Primary Research
      3. 13.3.3. Models
        1. 13.3.3.1. Company Share Analysis Model
        2. 13.3.3.2. Revenue Based Modeling
        3. 13.3.3.3. Research Limitations

        List of Figures

        FIG. 1 Global Caustic Soda Market, 2016-2026 (USD Million)
        FIG. 2 Global Caustic Soda Market Share, by Production Process, 2019 & 2026 (USD Million)
        FIG. 3 Global Caustic Soda Market share, by Production Process, 2019 & 2026 (Kilo Tons)
        FIG. 4 Global Diaphragm Cell Caustic Soda Market, 2016-2026 (USD Million)
        FIG. 5 Global Diaphragm Cell Caustic Soda  Market, 2016-2026 (Kilo Tons)
        FIG. 6 Global  Membrane Cell Caustic Soda Market, 2016-2026 (USD Million)
        FIG. 7 Global  Membrane Cell Caustic Soda  Market, 2016-2026 (Kilo Tons)
        FIG. 8 Global Others Caustic Soda Market, 2016-2026 (USD Million)
        FIG. 9 Global Others Caustic Soda  Market, 2016-2026 (Kilo Tons)
        FIG. 10 Global Caustic Soda Market Share, by Application, 2019 & 2026 (USD Million)
        FIG. 11 Global Caustic Soda Market share, by Application, 2019 & 2026 (Kilo Tons)
        FIG. 12 Global Organic Chemical Caustic Soda Market, 2016-2026 (USD Million)
        FIG. 13 Global Organic Chemical Caustic Soda  Market, 2016-2026 (Kilo Tons)
        FIG. 14 Global Water Treatment Caustic Soda Market, 2016-2026 (USD Million)
        FIG. 15 Global Water Treatment Caustic Soda  Market, 2016-2026 (Kilo Tons)
        FIG. 16 Global Inorganic Chemical Caustic Soda Market, 2016-2026 (USD Million)
        FIG. 17 Global Inorganic Chemical Caustic Soda  Market, 2016-2026 (Kilo Tons)
        FIG. 18 Global Soap & Detergent Caustic Soda Market, 2016-2026 (USD Million)
        FIG. 19 Global Soap & Detergent Caustic Soda  Market, 2016-2026 (Kilo Tons)
        FIG. 20 Global Alumina Caustic Soda Market, 2016-2026 (USD Million)
        FIG. 21 Global Alumina Caustic Soda  Market, 2016-2026 (Kilo Tons)
        FIG. 22 Global Pulp & Paper Caustic Soda Market, 2016-2026 (USD Million)
        FIG. 23 Global Pulp & Paper Caustic Soda  Market, 2016-2026 (Kilo Tons)
        FIG. 24 Global Others Caustic Soda Market, 2016-2026 (USD Million)
        FIG. 25 Global Others Caustic Soda  Market, 2016-2026 (Kilo Tons)
        FIG. 26 Global Caustic Soda Market Share, by Region, 2019 & 2026
        FIG. 27 Global Caustic Soda Market Share, by Region, 2019 & 2026
        FIG. 28 North America Caustic Soda Market, 2016-2026
        FIG. 29 North America Caustic Soda  Market, 2016-2026 (Kilo Tons)
        FIG. 30 U.S. Caustic Soda Market, 2016-2026
        FIG. 31 U.S. Caustic Soda  Market, 2016-2026 (Kilo Tons)
        FIG. 32 Canada Caustic Soda Market, 2016-2026
        FIG. 33 Canada Caustic Soda  Market, 2016-2026 (Kilo Tons)
        FIG. 34 Europe Caustic Soda Market, 2016-2026
        FIG. 35 Europe Caustic Soda  Market, 2016-2026 (Kilo Tons)
        FIG. 36 Germany Caustic Soda Market, 2016-2026
        FIG. 37 Germany Caustic Soda  Market, 2016-2026 (Kilo Tons)
        FIG. 38 France Caustic Soda Market, 2016-2026
        FIG. 39 France Caustic Soda  Market, 2016-2026 (Kilo Tons)
        FIG. 40 U.K. Caustic Soda Market, 2016-2026
        FIG. 41 U.K. Caustic Soda  Market, 2016-2026 (Kilo Tons)
        FIG. 42 Italy Caustic Soda Market, 2016-2026
        FIG. 43 Italy Caustic Soda  Market, 2016-2026 (Kilo Tons)
        FIG. 44 Spain Caustic Soda Market, 2016-2026
        FIG. 45 Spain Caustic Soda  Market, 2016-2026 (Kilo Tons)
        FIG. 46 Rest of Europe Caustic Soda Market, 2016-2026
        FIG. 47 Rest of Europe Caustic Soda  Market, 2016-2026 (Kilo Tons)
        FIG. 48 Asia Pacific Caustic Soda Market, 2016-2026
        FIG. 49 Asia Pacific Caustic Soda  Market, 2016-2026 (Kilo Tons)
        FIG. 50 China Caustic Soda Market, 2016-2026
        FIG. 51 China Caustic Soda  Market, 2016-2026 (Kilo Tons)
        FIG. 52 Japan Caustic Soda Market, 2016-2026
        FIG. 53 Japan Caustic Soda  Market, 2016-2026 (Kilo Tons)
        FIG. 54 India Caustic Soda Market, 2016-2026
        FIG. 55 India Caustic Soda  Market, 2016-2026 (Kilo Tons)
        FIG. 56 South  Korea Caustic Soda Market, 2016-2026
        FIG. 57 South  Korea Caustic Soda  Market, 2016-2026 (Kilo Tons)
        FIG. 58 South-East Asia Caustic Soda Market, 2016-2026
        FIG. 59 South-East Asia Caustic Soda  Market, 2016-2026 (Kilo Tons)
        FIG. 60 Rest of Asia Pacific Caustic Soda Market, 2016-2026
        FIG. 61 Rest of Asia Pacific Caustic Soda  Market, 2016-2026 (Kilo Tons)
        FIG. 62 Latin America Caustic Soda Market, 2016-2026
        FIG. 63 Latin America Caustic Soda  Market, 2016-2026 (Kilo Tons)
        FIG. 64 Brazil Caustic Soda Market, 2016-2026
        FIG. 65 Brazil Caustic Soda  Market, 2016-2026 (Kilo Tons)
        FIG. 66 Mexico Caustic Soda Market, 2016-2026
        FIG. 67 Mexico Caustic Soda  Market, 2016-2026 (Kilo Tons)
        FIG. 68 Rest of Latin America Caustic Soda Market, 2016-2026
        FIG. 69 Rest of Latin America Caustic Soda  Market, 2016-2026 (Kilo Tons)
        FIG. 70 The Middle-East and Africa Caustic Soda Market, 2016-2026
        FIG. 71 The Middle-East and Africa Caustic Soda  Market, 2016-2026 (Kilo Tons)
        FIG. 72 GCC Countries Caustic Soda Market, 2016-2026
        FIG. 73 GCC Countries Caustic Soda  Market, 2016-2026 (Kilo Tons)
        FIG. 74 South Africa Caustic Soda Market, 2016-2026
        FIG. 75 South Africa Caustic Soda  Market, 2016-2026 (Kilo Tons)
        FIG. 76 Rest of Middle-East Africa Caustic Soda Market, 2016-2026
        FIG. 77 Rest of Middle-East Africa Caustic Soda  Market, 2016-2026 (Kilo Tons)
        FIG. 78 Global Caustic Soda production and revenue, 2016-2026 (USD Million) (Kilo Tons)
        FIG. 79 North America Caustic Soda production and revenue, 2016-2026 (USD Million) (Kilo Tons)
        FIG. 80 Europe Caustic Soda production and revenue, 2016-2026 (USD Million) (Kilo Tons)
        FIG. 81 Asia Pacific Caustic Soda production and revenue, 2016-2026 (USD Million) (Kilo Tons)
        FIG. 82 Latin America Caustic Soda production and revenue, 2016-2026 (USD Million) (Kilo Tons)
        FIG. 83 Middle East and Africa Caustic Soda production and revenue, 2016-2026 (USD Million) (Kilo Tons)
        FIG. 84 Competitor Market Share – Revenue
        FIG. 85 Competitor Market Share – Volume
        FIG. 86 Dow Chemical Company Revenue and Growth Rate
        FIG. 87 Dow Chemical Company Market Share
        FIG. 88 Tata Chemicals Limited. Revenue and Growth Rate
        FIG. 89 Tata Chemicals Limited. Market Share
        FIG. 90 Occidental Petroleum Corporation Revenue and Growth Rate
        FIG. 91 Occidental Petroleum Corporation Market Share
        FIG. 92 BAYER AG Revenue and Growth Rate
        FIG. 93 BAYER AG Market Share
        FIG. 94 AkzoNobel Revenue and Growth Rate
        FIG. 95 AkzoNobel Market Share
        FIG. 96 Arkema Group Revenue and Growth Rate
        FIG. 97 Arkema Group Market Share
        FIG. 98 Solvay SA Revenue and Growth Rate
        FIG. 99 Solvay SA Market Share
        FIG. 100 Eastman Chemical Company Revenue and Growth Rate
        FIG. 101 Eastman Chemical Company Market Share
        FIG. 102 BASF Revenue and Growth Rate
        FIG. 103 BASF Market Share
        FIG. 104 FMC Corporation Revenue and Growth Rate
        FIG. 105 FMC Corporation Market Share
        FIG. 106 Market Dynamics
        FIG. 107 Global Caustic Soda – Value Chain Analysis
        FIG. 108 Key Mandates and Regulations
        FIG. 109 Technology Roadmap and Timeline
        FIG. 110 Market Attractiveness Analysis – By Production Process
        FIG. 111 Market Attractiveness Analysis – By Application
        FIG. 112 Market Attractiveness Analysis – By Region
        FIG. 113 Manufacturing Cost Structure of Caustic Soda
        FIG. 114 Caustic Soda Industrial Chain Analysis
        FIG. 115 Market Channel
        FIG. 116 Marketing Channel Development Trend
        FIG. 117 Growth in World Gross Product, 2008-2019

        List of Tables

        TABLE 1 Global Caustic Soda market, 2019 & 2026 (USD Million)
        TABLE 2 Global Caustic Soda market, by Production Process, 2016-2026 (USD Million)
        TABLE 3 Global Caustic Soda market, by Production Process, 2016-2026 (Kilo Tons)
        TABLE 4 Global Caustic Soda market, by Application, 2016-2026 (USD Million)
        TABLE 5 Global Caustic Soda market, by Application, 2016-2026 (Kilo Tons)
        TABLE 6 Global Caustic Soda market, by region, 2016-2026 (USD Million)
        TABLE 7 Global Caustic Soda market, by region, 2016-2026 (Kilo Tons)
        TABLE 8 North America Caustic Soda Market, by Production Process, 2016-2026 (USD Million)
        TABLE 9 North America Caustic Soda Market, by Production Process, 2016-2026 (Kilo Tons)
        TABLE 10 North America Caustic Soda Market, by Application, 2016-2026 (USD Million)
        TABLE 11 North America Caustic Soda Market, by Application, 2016-2026 (Kilo Tons)
        TABLE 12 Europe Caustic Soda Market, by Production Process, 2016-2026 (USD Million)
        TABLE 13 Europe Caustic Soda Market, by Production Process, 2016-2026 (Kilo Tons)
        TABLE 14 Europe Caustic Soda Market, by Application, 2016-2026 (USD Million)
        TABLE 15 Europe Caustic Soda Market, by Application, 2016-2026 (Kilo Tons)
        TABLE 16 Asia Pacific Caustic Soda Market, by Production Process, 2016-2026 (USD Million)
        TABLE 17 Asia Pacific Caustic Soda Market, by Production Process, 2016-2026 (Kilo Tons)
        TABLE 18 Asia Pacific Caustic Soda Market, by Application, 2016-2026 (USD Million)
        TABLE 19 Asia Pacific Caustic Soda Market, by Application, 2016-2026 (Kilo Tons)
        TABLE 20 Latin America Caustic Soda Market, by Production Process, 2016-2026 (USD Million)
        TABLE 21 Latin America Caustic Soda Market, by Production Process, 2016-2026 (Kilo Tons)
        TABLE 22 Latin America Caustic Soda Market, by Application, 2016-2026 (USD Million)
        TABLE 23 Latin America Caustic Soda Market, by Application, 2016-2026 (Kilo Tons)
        TABLE 24 The Middle-East and Africa Caustic Soda Market, by Production Process, 2016-2026 (USD Million)
        TABLE 25 The Middle-East and Africa Caustic Soda Market, by Production Process, 2016-2026 (Kilo Tons)
        TABLE 26 The Middle-East and Africa Caustic Soda Market, by Application, 2016-2026 (USD Million)
        TABLE 27 The Middle-East and Africa Caustic Soda Market, by Application, 2016-2026 (Kilo Tons)
        TABLE 28 North America Caustic Soda Production, Consumption, Export, Import, 2016-2019
        TABLE 29 Europe Caustic Soda Production, Consumption, Export, Import, 2016-2019
        TABLE 30 Asia Pacific Caustic Soda Production, Consumption, Export, Import, 2016-2019
        TABLE 31 Latin America Caustic Soda Production, Consumption, Export, Import, 2016-2019
        TABLE 32 Middle East & Africa Caustic Soda Production, Consumption, Export, Import, 2016-2019
        TABLE 33 Global Caustic Soda Market - Company Revenue Analysis 2016-2019 (USD Million)
        TABLE 34 Global Caustic Soda Market - Company Revenue Share Analysis 2016-2019(%)
        TABLE 35 Global Caustic Soda Market - Company Volume Analysis 2016-2019 (Kilo Tons)
        TABLE 36 Global Caustic Soda Market - Company Volume Share Analysis 2016-2019(%)
        TABLE 37 Acquisitions and Mergers
        TABLE 38 New Product/Service Launch
        TABLE 39 Research & Development Activities
        TABLE 40 Market Drivers
        TABLE 41 Market Restraints
        TABLE 42 Market Opportunities
        TABLE 43 Production Base and Market Concentration Rate of Raw Material
        TABLE 44 Key Suppliers of Raw Materials
        TABLE 45 Raw Materials Sources of Caustic Soda Major Manufacturers in 2016
        TABLE 46 Major Buyers of Caustic Soda
        TABLE 47 Distributors/Traders of Caustic Soda by Region

Industry Major Market Players

  • Dow Chemical Company
  •  Tata Chemicals Limited.
  •  Occidental Petroleum Corporation
  •  BAYER AG
  •  AkzoNobel
  •  Arkema Group
  •  Solvay SA
  •  Eastman Chemical Company
  •  BASF
  •  FMC Corporation