Search Market Research Report

Discover Our Latest Reports
Discover Our Featured Reports
Discover Top Selling Reports

Carbon Nanotubes Market Size, Share Global Analysis Report, 2020–2026

report img

Carbon Nanotubes Market By Type (Single, Multi Walled) By Method (Chemical Vapor Deposition, Catalytic Chemical Vapor Deposition, High Pressure Carbon Monoxide) By Application (Electronics & Semiconductors, Advanced Materials, Chemical & Polymers, Batteries & Capacitors, Aerospace & Defense, Energy, Others): Global Carbon Nanotubes Industry Outlook, Market Size, Business Intelligence, Consumer Preferences, Statistical Surveys, Comprehensive Analysis, Historical Developments, Current Trends, and Forecast 2020–2026

Industry Insights

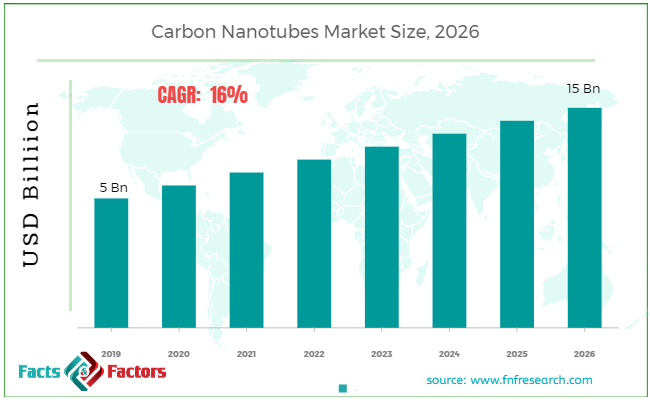
[180+ Pages Report] According to the report published by Facts Factors, the global carbon nanotubes market size was worth around USD 5 billion in 2019 and is predicted to grow to around USD 15 billion by 2026 with a compound annual growth rate (CAGR) of roughly 16% between 2020 and 2026. The report analyzes the global carbon nanotubes market drivers, restraints/challenges, and the effect they have on the demands during the projection period. In addition, the report explores emerging opportunities in the carbon nanotubes market.

Carbon Nanotubes Market Size

To know more about this report | Request Free Sample Copy

This specialized and expertise oriented industry research report scrutinizes the technical and commercial business outlook of the Carbon Nanotubes industry. The report analyzes and declares the historical and current trends analysis of the Carbon Nanotubes industry and subsequently recommends the projected trends anticipated to be observed in the Carbon Nanotubes market during the upcoming years.

The carbon nanotubes market report analyzes and notifies the industry statistics at the global as well as regional and country levels in order to acquire a thorough perspective of the entire Carbon Nanotubes market. The historical and past insights are provided for FY 2016 to FY 2019 whereas projected trends are delivered for FY 2020 to FY 2026. The quantitative and numerical data is represented in terms of both volume (Tons) and value (USD Million) from FY 2016 – 2026.


logoKey Insights from Primary Research

  • As per the data acquired from our primary respondents, the market is estimated to grow at the CAGR of 16%
  • The primary research conducted by our industry-specific analyst’s market is valued at USD 5 billion in 2019.
  • Additionally, the market is estimated to cross around USD 15 billion by 2026.
  • Fixed automatic sanitizers dispenser are projected to gain significant popularity owing to their prominent use in public places.
  • Based on the price range segmentation “Mass” category seized the prominent share at more than 50%, in 2019.

logoKey Recommendations from Analysts

  • As per our analysts, the COVID-19 pandemic is fueling the demand for the automatic sanitizer dispenser's market. The protection from the cross-contamination at the public places is estimated to surge the demand for the automatic sanitizer dispenser.
  • North America and Europe are estimated to acquire the major share of the automatic sanitizer dispenser market. Asia Pacific market may face an affordability issue. However, the rise in awareness regarding personal hygiene may propel the growth of the market.
  • The product cost and continuous changing of batteries may shift the consumers to the low-cost dispenser options such as foot pressed dispensers.
  • The fixed automatic sanitizer dispenser may acquire popularity owing to their low cost and use at the public places.

The quantitative data is further underlined and reinforced by comprehensive qualitative data which comprises various across-the-board market dynamics. The rationales which directly or indirectly impact the Carbon Nanotubes industry are exemplified through parameters such as growth drivers, restraints, challenges, and opportunities among other impacting factors.

Throughout our research report, we have encompassed all the proven models and tools of industry analysis and extensively illustrated all the key business strategies and business models adopted in the Carbon Nanotubes industry. The report provides an all-inclusive and detailed competitive landscape prevalent in the Carbon Nanotubes market.

The report utilizes established industry analysis tools and models such as Porter’s Five Forces framework to analyze and recognize critical business strategies adopted by various stakeholders involved in the entire value chain of the Carbon Nanotubes industry. The Carbon Nanotubes market report additionally employs SWOT analysis and PESTLE analysis models for further in-depth analysis.

The report study further includes an in-depth analysis of industry players' market shares and provides an overview of leading players' market position in the Carbon Nanotubes sector. Key strategic developments in the Carbon Nanotubes market competitive landscape such as acquisitions & mergers, inaugurations of different products and services, partnerships & joint ventures, MoU agreements, VC & funding activities, R&D activities, and geographic expansion among other noteworthy activities by key players of the Carbon Nanotubes market are appropriately highlighted in the report.

The Carbon Nanotubes belongs to a group of tiny allotropes of carbon that are in nanometer-scale size and exhibits excellent electric and thermal activities making them an ideal option for several industrial applications. These tubes are composed of graphene layers that are rolled into a smooth shape. The demand for carbon nanotubes is rapidly increasing owing to its use in several applications such as lithium batteries, electrical circuits, storage cells, and aerospace components. Rising industrialization along with several technological developments for lowering costs, improving efficiency, and producing more innovative technologies are some of the developments in the carbon nanotube industry.

The Carbon Nanotubes market research report delivers an acute valuation and taxonomy of the Carbon Nanotubes industry by practically splitting the market based on different types, applications, and regions. Through the analysis of the historical and projected trends, all the segments and sub-segments were evaluated through the bottom-up approach, and different market sizes have been projected for FY 2020 to FY 2026.

logoReport Scope

Report Attribute

Details

Market Size in 2019

USD 5 Billion

Projected Market Size in 2026

USD 15 Billion

CAGR Growth Rate

16% CAGR

Base Year

2019

Forecast Years

2020-2026

Key Market Players

Arkema Group, Chasm Advanced Materials Inc., Showa Denko K.K., Arry International Group LTD., Ocsial Llc, Cheap Tubes Inc., Cnano Technology Limited, Futurecarbon GmbH, Carbon Solutions Inc., Hyperion Catalysis International, Hanwha Chemical Corp., Klean Industries Inc., CNT Co., Ltd., Continental Carbon Company, LG Chem, Nano-C Inc., Nanocyl SA, Toray Industries, Inc., and Others

Key Segment

By Type, Method, Application, and Region

Major Regions Covered

North America, Europe, Asia Pacific, Latin America, and the Middle East & Africa

Purchase Options

Request customized purchase options to meet your research needs. Explore purchase options

The regional segmentation of the Carbon Nanotubes industry includes the complete classification of all the major continents including North America, Latin America, Europe, Asia Pacific, and the Middle East & Africa. Further, country-wise data for the Carbon Nanotubes industry is provided for the leading economies of the world.

The Carbon Nanotubes market is segmented based on Type, Method, and Application. As per type segmentation, the market is divided into single and multi-walled. Based on method segmentation, the market is classified into Chemical Vapor Deposition, Catalytic Chemical Vapor Deposition, High-Pressure Carbon Monoxide. In terms of application type, the market is bifurcated into Electronics & Semiconductors, Advanced Materials, Chemical & Polymers, Batteries & Capacitors, Aerospace & Defense, Energy, Others.

logoSome of the essential players operating in the Carbon Nanotubes market, but not restricted to include

  • Arkema Group
  • Chasm Advanced Materials Inc.
  • Showa Denko K.K.
  • Arry International Group LTD.
  • Ocsial Llc
  • Cheap Tubes Inc.
  • Cnano Technology Limited
  • Futurecarbon GmbH
  • Carbon Solutions Inc.
  • Hyperion Catalysis International
  • Hanwha Chemical Corp.
  • Klean Industries Inc.
  • CNT Co. Ltd.
  • Continental Carbon Company
  • LG Chem
  • Nano-C Inc.
  • Nanocyl SA
  • Toray Industries Inc.

The taxonomy of the Carbon Nanotubes industry by its scope and segmentation is as follows:

logo By Type Segmentation Analysis (Customizable)

  • Single
  • Multi Walled

logo By Method Segmentation Analysis (Customizable)

  • Chemical Vapor Deposition
  • Catalytic Chemical Vapor Deposition
  • High Pressure Carbon Monoxide

logo By Application Segmentation Analysis (Customizable)

  • Electronics & Semiconductors
  • Advanced Materials
  • Chemical & Polymers
  • Batteries & Capacitors
  • Aerospace & Defense
  • Energy
  • Others

logo Regional Segmentation Analysis (Customizable)

  • North America
    • The U.S.
    • Canada
  • Europe
    • Germany
    • The UK
    • France
    • Spain
    • Italy
    • Rest of Europe
  • Asia Pacific
    • China
    • Japan
    • India
    • South Korea
    • Southeast Asia
    • Rest of Asia Pacific
  • Latin America
    • Brazil
    • Mexico
    • Rest of Latin America
  • Middle East & Africa
    • GCC
    • South Africa
    • Rest of Middle East & Africa

Table of Content

  1. Chapter 1 Executive Summary
    1. 1.1. Introduction of Carbon Nanotubes
    2. 1.2. Global Carbon Nanotubes Market, 2019 & 2026 (USD Million)
    3. 1.3. Global Carbon Nanotubes Market, 2016 – 2026 (USD Million) (Tons)
    4. 1.4. Global Carbon Nanotubes Market Absolute Revenue Opportunity, 2016 – 2026 (USD Million)
    5. 1.5. Global Carbon Nanotubes Market Incremental Revenue Opportunity, 2020 – 2026 (USD Million)
  2. Chapter 2 Carbon Nanotubes Market – Type Analysis
    1. 2.1. Global Carbon Nanotubes Market – Type Overview
    2. 2.2. Global Carbon Nanotubes Market Share, by Type, 2019 & 2026 (USD Million)
    3. 2.3. Global Carbon Nanotubes Market share, by Type, 2019 & 2026 (Tons)
    4. 2.4. Single
      1. 2.4.1. Global Single Carbon Nanotubes Market, 2016 – 2026 (USD Million)
      2. 2.4.2. Global Single Carbon Nanotubes Market, 2016 – 2026 (Tons)
    5. 2.5. Multi Walled
      1. 2.5.1. Global Multi Walled Carbon Nanotubes Market, 2016 – 2026 (USD Million)
      2. 2.5.2. Global Multi Walled Carbon Nanotubes Market, 2016 – 2026 (Tons)
  3. Chapter 3 Carbon Nanotubes Market – Method Analysis
    1. 3.1. Global Carbon Nanotubes Market – Method Overview
    2. 3.2. Global Carbon Nanotubes Market Share, by Method, 2019 & 2026 (USD Million)
    3. 3.3. Global Carbon Nanotubes Market share, by Method, 2019 & 2026 (Tons)
    4. 3.4. Chemical Vapor Deposition
      1. 3.4.1. Global Chemical Vapor Deposition Carbon Nanotubes Market, 2016 – 2026 (USD Million)
      2. 3.4.2. Global Chemical Vapor Deposition Carbon Nanotubes Market, 2016 – 2026 (Tons)
    5. 3.5. Catalytic Chemical Vapor Deposition
      1. 3.5.1. Global Catalytic Chemical Vapor Deposition Carbon Nanotubes Market, 2016 – 2026 (USD Million)
      2. 3.5.2. Global Catalytic Chemical Vapor Deposition Carbon Nanotubes Market, 2016 – 2026 (Tons)
    6. 3.6. High Pressure Carbon Monoxide
      1. 3.6.1. Global High Pressure Carbon Monoxide Carbon Nanotubes Market, 2016 – 2026 (USD Million)
      2. 3.6.2. Global High Pressure Carbon Monoxide Carbon Nanotubes Market, 2016 – 2026 (Tons)
  4. Chapter 4 Carbon Nanotubes Market – Application Analysis
    1. 4.1. Global Carbon Nanotubes Market – Application Overview
    2. 4.2. Global Carbon Nanotubes Market Share, by Application, 2019 & 2026 (USD Million)
    3. 4.3. Global Carbon Nanotubes Market share, by Application, 2019 & 2026 (Tons)
    4. 4.4. Electronics & Semiconductors
      1. 4.4.1. Global Electronics & Semiconductors Carbon Nanotubes Market, 2016 – 2026 (USD Million)
      2. 4.4.2. Global Electronics & Semiconductors Carbon Nanotubes Market, 2016 – 2026 (Tons)
    5. 4.5. Advanced Materials
      1. 4.5.1. Global Advanced Materials Carbon Nanotubes Market, 2016 – 2026 (USD Million)
      2. 4.5.2. Global Advanced Materials Carbon Nanotubes Market, 2016 – 2026 (Tons)
    6. 4.6. Chemical & Polymers
      1. 4.6.1. Global Chemical & Polymers Carbon Nanotubes Market, 2016 – 2026 (USD Million)
      2. 4.6.2. Global Chemical & Polymers Carbon Nanotubes Market, 2016 – 2026 (Tons)
    7. 4.7. Batteries & Capacitors
      1. 4.7.1. Global Batteries & Capacitors Carbon Nanotubes Market, 2016 – 2026 (USD Million)
      2. 4.7.2. Global Batteries & Capacitors Carbon Nanotubes Market, 2016 – 2026 (Tons)
    8. 4.8. Aerospace & Defense
      1. 4.8.1. Global Aerospace & Defense Carbon Nanotubes Market, 2016 – 2026 (USD Million)
      2. 4.8.2. Global Aerospace & Defense Carbon Nanotubes Market, 2016 – 2026 (Tons)
    9. 4.9. Energy
      1. 4.9.1. Global Energy Carbon Nanotubes Market, 2016 – 2026 (USD Million)
      2. 4.9.2. Global Energy Carbon Nanotubes Market, 2016 – 2026 (Tons)
    10. 4.10. Others
      1. 4.10.1. Global Others Carbon Nanotubes Market, 2016 – 2026 (USD Million)
      2. 4.10.2. Global Others Carbon Nanotubes Market, 2016 – 2026 (Tons)
  5. Chapter 5 Carbon Nanotubes Market – Regional Analysis
    1. 5.1. Global Carbon Nanotubes Market Regional Overview
    2. 5.2. Global Carbon Nanotubes Market Share, by Region, 2019 & 2026 (USD Million)
    3. 5.3. Global Carbon Nanotubes Market Share, by Region, 2019 & 2026 (Tons)
    4. 5.4. North America
      1. 5.4.1. North America Carbon Nanotubes Market, 2016 – 2026 (USD Million)
        1. 5.4.1.1. North America Carbon Nanotubes Market, by Country, 2016 – 2026 (USD Million)
      2. 5.4.2. North America Market, 2016 – 2026 (Tons)
        1. 5.4.2.1. North America Carbon Nanotubes Market, by Country, 2016 – 2026 (Tons)
      3. 5.4.3. North America Carbon Nanotubes Market, by Type, 2016 – 2026
        1. 5.4.3.1. North America Carbon Nanotubes Market, by Type, 2016 – 2026 (USD Million)
        2. 5.4.3.2. North America Carbon Nanotubes Market, by Type, 2016 – 2026 (Tons)
      4. 5.4.4. North America Carbon Nanotubes Market, by Method, 2016 – 2026
        1. 5.4.4.1. North America Carbon Nanotubes Market, by Method, 2016 – 2026 (USD Million)
        2. 5.4.4.2. North America Carbon Nanotubes Market, by Method, 2016 – 2026 (Tons)
      5. 5.4.5. North America Carbon Nanotubes Market, by Application, 2016 – 2026
        1. 5.4.5.1. North America Carbon Nanotubes Market, by Application, 2016 – 2026 (USD Million)
        2. 5.4.5.2. North America Carbon Nanotubes Market, by Application, 2016 – 2026 (Tons)
      6. 5.4.6. U.S.
        1. 5.4.6.1. U.S. Carbon Nanotubes Market, 2016 – 2026 (USD Million)
        2. 5.4.6.2. U.S. Carbon Nanotubes Market, 2016 – 2026 (Tons)
      7. 5.4.7. Canada
        1. 5.4.7.1. Canada Carbon Nanotubes Market, 2016 – 2026 (USD Million)
        2. 5.4.7.2. Canada Carbon Nanotubes Market, 2016 – 2026 (Tons)
    5. 5.5. Europe
      1. 5.5.1. Europe Carbon Nanotubes Market, 2016 – 2026 (USD Million)
        1. 5.5.1.1. Europe Carbon Nanotubes Market, by Country, 2016 – 2026 (USD Million)
      2. 5.5.2. Europe Market, 2016 – 2026 (Tons)
        1. 5.5.2.1. Europe Carbon Nanotubes Market, by Country, 2016 – 2026 (Tons)
      3. 5.5.3. Europe Carbon Nanotubes Market, by Type, 2016 – 2026
        1. 5.5.3.1. Europe Carbon Nanotubes Market, by Type, 2016 – 2026 (USD Million)
        2. 5.5.3.2. Europe Carbon Nanotubes Market, by Type, 2016 – 2026 (Tons)
      4. 5.5.4. Europe Carbon Nanotubes Market, by Method, 2016 – 2026
        1. 5.5.4.1. Europe Carbon Nanotubes Market, by Method, 2016 – 2026 (USD Million)
        2. 5.5.4.2. Europe Carbon Nanotubes Market, by Method, 2016 – 2026 (Tons)
      5. 5.5.5. Europe Carbon Nanotubes Market, by Application, 2016 – 2026
        1. 5.5.5.1. Europe Carbon Nanotubes Market, by Application, 2016 – 2026 (USD Million)
        2. 5.5.5.2. Europe Carbon Nanotubes Market, by Application, 2016 – 2026 (Tons)
      6. 5.5.6. Germany
        1. 5.5.6.1. Germany Carbon Nanotubes Market, 2016 – 2026 (USD Million)
        2. 5.5.6.2. Germany Carbon Nanotubes Market, 2016 – 2026 (Tons)
      7. 5.5.7. France
        1. 5.5.7.1. France Carbon Nanotubes Market, 2016 – 2026 (USD Million)
        2. 5.5.7.2. France Carbon Nanotubes Market, 2016 – 2026 (Tons)
      8. 5.5.8. U.K.
        1. 5.5.8.1. U.K. Carbon Nanotubes Market, 2016 – 2026 (USD Million)
        2. 5.5.8.2. U.K. Carbon Nanotubes Market, 2016 – 2026 (Tons)
      9. 5.5.9. Italy
        1. 5.5.9.1. Italy Carbon Nanotubes Market, 2016 – 2026 (USD Million)
        2. 5.5.9.2. Italy Carbon Nanotubes Market, 2016 – 2026 (Tons)
      10. 5.5.10. Spain
        1. 5.5.10.1. Spain Carbon Nanotubes Market, 2016 – 2026 (USD Million)
        2. 5.5.10.2. Spain Carbon Nanotubes Market, 2016 – 2026 (Tons)
      11. 5.5.11. Rest of Europe
        1. 5.5.11.1. Rest of Europe Carbon Nanotubes Market, 2016 – 2026 (USD Million)
        2. 5.5.11.2. Rest of Europe Carbon Nanotubes Market, 2016 – 2026 (Tons)
    6. 5.6. Asia Pacific
      1. 5.6.1. Asia Pacific Carbon Nanotubes Market, 2016 – 2026 (USD Million)
        1. 5.6.1.1. Asia Pacific Carbon Nanotubes Market, by Country, 2016 – 2026 (USD Million)
      2. 5.6.2. Asia Pacific Market, 2016 – 2026 (Tons)
        1. 5.6.2.1. Asia Pacific Carbon Nanotubes Market, by Country, 2016 – 2026 (Tons)
      3. 5.6.3. Asia Pacific Carbon Nanotubes Market, by Type, 2016 – 2026
        1. 5.6.3.1. Asia Pacific Carbon Nanotubes Market, by Type, 2016 – 2026 (USD Million)
        2. 5.6.3.2. Asia Pacific Carbon Nanotubes Market, by Type, 2016 – 2026 (Tons)
      4. 5.6.4. Asia Pacific Carbon Nanotubes Market, by Method, 2016 – 2026
        1. 5.6.4.1. Asia Pacific Carbon Nanotubes Market, by Method, 2016 – 2026 (USD Million)
        2. 5.6.4.2. Asia Pacific Carbon Nanotubes Market, by Method, 2016 – 2026 (Tons)
      5. 5.6.5. Asia Pacific Carbon Nanotubes Market, by Application, 2016 – 2026
        1. 5.6.5.1. Asia Pacific Carbon Nanotubes Market, by Application, 2016 – 2026 (USD Million)
        2. 5.6.5.2. Asia Pacific Carbon Nanotubes Market, by Application, 2016 – 2026 (Tons)
      6. 5.6.6. China
        1. 5.6.6.1. China Carbon Nanotubes Market, 2016 – 2026 (USD Million)
        2. 5.6.6.2. China Carbon Nanotubes Market, 2016 – 2026 (Tons)
      7. 5.6.7. Japan
        1. 5.6.7.1. Japan Carbon Nanotubes Market, 2016 – 2026 (USD Million)
        2. 5.6.7.2. Japan Carbon Nanotubes Market, 2016 – 2026 (Tons)
      8. 5.6.8. India
        1. 5.6.8.1. India Carbon Nanotubes Market, 2016 – 2026 (USD Million)
        2. 5.6.8.2. India Carbon Nanotubes Market, 2016 – 2026 (Tons)
      9. 5.6.9. South Korea
        1. 5.6.9.1. South Korea Carbon Nanotubes Market, 2016 – 2026 (USD Million)
        2. 5.6.9.2. South Korea Carbon Nanotubes Market, 2016 – 2026 (Tons)
      10. 5.6.10. South-East Asia
        1. 5.6.10.1. South-East Asia Carbon Nanotubes Market, 2016 – 2026 (USD Million)
        2. 5.6.10.2. South-East Asia Carbon Nanotubes Market, 2016 – 2026 (Tons)
      11. 5.6.11. Rest of Asia Pacific
        1. 5.6.11.1. Rest of Asia Pacific Carbon Nanotubes Market, 2016 – 2026 (USD Million)
        2. 5.6.11.2. Rest of Asia Pacific Carbon Nanotubes Market, 2016 – 2026 (Tons)
    7. 5.7. Latin America
      1. 5.7.1. Latin America Carbon Nanotubes Market, 2016 – 2026 (USD Million)
        1. 5.7.1.1. Latin America Carbon Nanotubes Market, by Country, 2016 – 2026 (USD Million)
      2. 5.7.2. Latin America Market, 2016 – 2026 (Tons)
        1. 5.7.2.1. Latin America Carbon Nanotubes Market, by Country, 2016 – 2026 (Tons)
      3. 5.7.3. Latin America Carbon Nanotubes Market, by Type, 2016 – 2026
        1. 5.7.3.1. Latin America Carbon Nanotubes Market, by Type, 2016 – 2026 (USD Million)
        2. 5.7.3.2. Latin America Carbon Nanotubes Market, by Type, 2016 – 2026 (Tons)
      4. 5.7.4. Latin America Carbon Nanotubes Market, by Method, 2016 – 2026
        1. 5.7.4.1. Latin America Carbon Nanotubes Market, by Method, 2016 – 2026 (USD Million)
        2. 5.7.4.2. Latin America Carbon Nanotubes Market, by Method, 2016 – 2026 (Tons)
      5. 5.7.5. Latin America Carbon Nanotubes Market, by Application, 2016 – 2026
        1. 5.7.5.1. Latin America Carbon Nanotubes Market, by Application, 2016 – 2026 (USD Million)
        2. 5.7.5.2. Latin America Carbon Nanotubes Market, by Application, 2016 – 2026 (Tons)
      6. 5.7.6. Brazil
        1. 5.7.6.1. Brazil Carbon Nanotubes Market, 2016 – 2026 (USD Million)
        2. 5.7.6.2. Brazil Carbon Nanotubes Market, 2016 – 2026 (Tons)
      7. 5.7.7. Mexico
        1. 5.7.7.1. Mexico Carbon Nanotubes Market, 2016 – 2026 (USD Million)
        2. 5.7.7.2. Mexico Carbon Nanotubes Market, 2016 – 2026 (Tons)
      8. 5.7.8. Rest of Latin America
        1. 5.7.8.1. Rest of Latin America Carbon Nanotubes Market, 2016 – 2026 (USD Million)
        2. 5.7.8.2. Rest of Latin America Carbon Nanotubes Market, 2016 – 2026 (Tons)
    8. 5.8. The Middle-East and Africa
      1. 5.8.1. The Middle-East and Africa Carbon Nanotubes Market, 2016 – 2026 (USD Million)
        1. 5.8.1.1. The Middle-East and Africa Carbon Nanotubes Market, by Country, 2016 – 2026 (USD Million)
      2. 5.8.2. The Middle-East and Africa Market, 2016 – 2026 (Tons)
        1. 5.8.2.1. The Middle-East and Africa Carbon Nanotubes Market, by Country, 2016 – 2026 (Tons)
      3. 5.8.3. The Middle-East and Africa Carbon Nanotubes Market, by Type, 2016 – 2026
        1. 5.8.3.1. The Middle-East and Africa Carbon Nanotubes Market, by Type, 2016 – 2026 (USD Million)
        2. 5.8.3.2. The Middle-East and Africa Carbon Nanotubes Market, by Type, 2016 – 2026 (Tons)
      4. 5.8.4. The Middle-East and Africa Carbon Nanotubes Market, by Method, 2016 – 2026
        1. 5.8.4.1. The Middle-East and Africa Carbon Nanotubes Market, by Method, 2016 – 2026 (USD Million)
        2. 5.8.4.2. The Middle-East and Africa Carbon Nanotubes Market, by Method, 2016 – 2026 (Tons)
      5. 5.8.5. The Middle-East and Africa Carbon Nanotubes Market, by Application, 2016 – 2026
        1. 5.8.5.1. The Middle-East and Africa Carbon Nanotubes Market, by Application, 2016 – 2026 (USD Million)
        2. 5.8.5.2. The Middle-East and Africa Carbon Nanotubes Market, by Application, 2016 – 2026 (Tons)
      6. 5.8.6. GCC Countries
        1. 5.8.6.1. GCC Countries Carbon Nanotubes Market, 2016 – 2026 (USD Million)
        2. 5.8.6.2. GCC Countries Carbon Nanotubes Market, 2016 – 2026 (Tons)
      7. 5.8.7. South Africa
        1. 5.8.7.1. South Africa Carbon Nanotubes Market, 2016 – 2026 (USD Million)
        2. 5.8.7.2. South Africa Carbon Nanotubes Market, 2016 – 2026 (Tons)
      8. 5.8.8. Rest of Middle-East Africa
        1. 5.8.8.1. Rest of Middle-East Africa Carbon Nanotubes Market, 2016 – 2026 (USD Million)
        2. 5.8.8.2. Rest of Middle-East Africa Carbon Nanotubes Market, 2016 – 2026 (Tons)
  6. Chapter 6 Carbon Nanotubes Production, Consumption, Export, Import by Regions
    1. 6.1. Global Carbon Nanotubes Production and Consumption, 2016 – 2026 (Tons)
    2. 6.2. Global Import and Export Analysis, by Region
  7. Chapter 7 Carbon Nanotubes Market – Competitive Landscape
    1. 7.1. Competitor Market Share – Revenue
    2. 7.2. Market Concentration Rate Analysis, Top 3 and Top 5 Players
    3. 7.3. Competitor Market Share – Volume
    4. 7.4. Strategic Developments
      1. 7.4.1. Acquisitions and Mergers
      2. 7.4.2. New Products
      3. 7.4.3. Research & Development Activities
  8. Chapter 8 Company Profiles
    1. 8.1. Arkema Group
      1. 8.1.1. Company Overview
      2. 8.1.2. Product/Service Portfolio
      3. 8.1.3. Arkema Group Sales, Revenue, Price, and Gross Margin
      4. 8.1.4. Arkema Group Revenue and Growth Rate
      5. 8.1.5. Arkema Group Market Share
      6. 8.1.6. Recent Initiatives, Funding/VC Activities, and Technological Innovations
    2. 8.2. Chasm Advanced Materials Inc.
      1. 8.2.1. Company Overview
      2. 8.2.2. Product/Service Portfolio
      3. 8.2.3. Chasm Advanced Materials Inc. Sales, Revenue, Price, and Gross Margin
      4. 8.2.4. Chasm Advanced Materials Inc. Revenue and Growth Rate
      5. 8.2.5. Chasm Advanced Materials Inc. Market Share
      6. 8.2.6. Recent Initiatives, Funding/VC Activities, and Technological Innovations
    3. 8.3. Showa Denko K.K.
      1. 8.3.1. Company Overview
      2. 8.3.2. Product/Service Portfolio
      3. 8.3.3. Showa Denko K.K. Sales, Revenue, Price, and Gross Margin
      4. 8.3.4. Showa Denko K.K. Revenue and Growth Rate
      5. 8.3.5. Showa Denko K.K. Market Share
      6. 8.3.6. Recent Initiatives, Funding/VC Activities, and Technological Innovations
    4. 8.4. Arry International Group LTD.
      1. 8.4.1. Company Overview
      2. 8.4.2. Product/Service Portfolio
      3. 8.4.3. Arry International Group LTD. Sales, Revenue, Price, and Gross Margin
      4. 8.4.4. Arry International Group LTD. Revenue and Growth Rate
      5. 8.4.5. Arry International Group LTD. Market Share
      6. 8.4.6. Recent Initiatives, Funding/VC Activities, and Technological Innovations
    5. 8.5. Ocsial Llc
      1. 8.5.1. Company Overview
      2. 8.5.2. Product/Service Portfolio
      3. 8.5.3. Ocsial Llc Sales, Revenue, Price, and Gross Margin
      4. 8.5.4. Ocsial Llc Revenue and Growth Rate
      5. 8.5.5. Ocsial Llc Market Share
      6. 8.5.6. Recent Initiatives, Funding/VC Activities, and Technological Innovations
    6. 8.6. Cheap Tubes Inc.
      1. 8.6.1. Company Overview
      2. 8.6.2. Product/Service Portfolio
      3. 8.6.3. Cheap Tubes Inc. Sales, Revenue, Price, and Gross Margin
      4. 8.6.4. Cheap Tubes Inc. Revenue and Growth Rate
      5. 8.6.5. Cheap Tubes Inc. Market Share
      6. 8.6.6. Recent Initiatives, Funding/VC Activities, and Technological Innovations
    7. 8.7. Cnano Technology Limited
      1. 8.7.1. Company Overview
      2. 8.7.2. Product/Service Portfolio
      3. 8.7.3. Cnano Technology Limited Sales, Revenue, Price, and Gross Margin
      4. 8.7.4. Cnano Technology Limited Revenue and Growth Rate
      5. 8.7.5. Cnano Technology Limited Market Share
      6. 8.7.6. Recent Initiatives, Funding/VC Activities, and Technological Innovations
    8. 8.8. Futurecarbon GmbH
      1. 8.8.1. Company Overview
      2. 8.8.2. Product/Service Portfolio
      3. 8.8.3. Futurecarbon GmbH Sales, Revenue, Price, and Gross Margin
      4. 8.8.4. Futurecarbon GmbH Revenue and Growth Rate
      5. 8.8.5. Futurecarbon GmbH Market Share
      6. 8.8.6. Recent Initiatives, Funding/VC Activities, and Technological Innovations
    9. 8.9. Carbon Solutions Inc.
      1. 8.9.1. Company Overview
      2. 8.9.2. Product/Service Portfolio
      3. 8.9.3. Carbon Solutions Inc. Sales, Revenue, Price, and Gross Margin
      4. 8.9.4. Carbon Solutions Inc. Revenue and Growth Rate
      5. 8.9.5. Carbon Solutions Inc. Market Share
      6. 8.9.6. Recent Initiatives, Funding/VC Activities, and Technological Innovations
    10. 8.10. Hyperion Catalysis International
      1. 8.10.1. Company Overview
      2. 8.10.2. Product/Service Portfolio
      3. 8.10.3. Hyperion Catalysis International Sales, Revenue, Price, and Gross Margin
      4. 8.10.4. Hyperion Catalysis International Revenue and Growth Rate
      5. 8.10.5. Hyperion Catalysis International Market Share
      6. 8.10.6. Recent Initiatives, Funding/VC Activities, and Technological Innovations
    11. 8.11. Hanwha Chemical Corp.
      1. 8.11.1. Company Overview
      2. 8.11.2. Product/Service Portfolio
      3. 8.11.3. Hanwha Chemical Corp. Sales, Revenue, Price, and Gross Margin
      4. 8.11.4. Hanwha Chemical Corp. Revenue and Growth Rate
      5. 8.11.5. Hanwha Chemical Corp. Market Share
      6. 8.11.6. Recent Initiatives, Funding/VC Activities, and Technological Innovations
    12. 8.12. Klean Industries Inc.
      1. 8.12.1. Company Overview
      2. 8.12.2. Product/Service Portfolio
      3. 8.12.3. Klean Industries Inc. Sales, Revenue, Price, and Gross Margin
      4. 8.12.4. Klean Industries Inc. Revenue and Growth Rate
      5. 8.12.5. Klean Industries Inc. Market Share
      6. 8.12.6. Recent Initiatives, Funding/VC Activities, and Technological Innovations
    13. 8.13. CNT Co., Ltd.
      1. 8.13.1. Company Overview
      2. 8.13.2. Product/Service Portfolio
      3. 8.13.3. CNT Co., Ltd. Sales, Revenue, Price, and Gross Margin
      4. 8.13.4. CNT Co., Ltd. Revenue and Growth Rate
      5. 8.13.5. CNT Co., Ltd. Market Share
      6. 8.13.6. Recent Initiatives, Funding/VC Activities, and Technological Innovations
    14. 8.14. Continental Carbon Company
      1. 8.14.1. Company Overview
      2. 8.14.2. Product/Service Portfolio
      3. 8.14.3. Continental Carbon Company Sales, Revenue, Price, and Gross Margin
      4. 8.14.4. Continental Carbon Company Revenue and Growth Rate
      5. 8.14.5. Continental Carbon Company Market Share
      6. 8.14.6. Recent Initiatives, Funding/VC Activities, and Technological Innovations
    15. 8.15. LG Chem
      1. 8.15.1. Company Overview
      2. 8.15.2. Product/Service Portfolio
      3. 8.15.3. LG Chem Sales, Revenue, Price, and Gross Margin
      4. 8.15.4. LG Chem Revenue and Growth Rate
      5. 8.15.5. LG Chem Market Share
      6. 8.15.6. Recent Initiatives, Funding/VC Activities, and Technological Innovations
    16. 8.16. Nano-C Inc.
      1. 8.16.1. Company Overview
      2. 8.16.2. Product/Service Portfolio
      3. 8.16.3. Nano-C Inc. Sales, Revenue, Price, and Gross Margin
      4. 8.16.4. Nano-C Inc. Revenue and Growth Rate
      5. 8.16.5. Nano-C Inc. Market Share
      6. 8.16.6. Recent Initiatives, Funding/VC Activities, and Technological Innovations
    17. 8.17. Nanocyl SA
      1. 8.17.1. Company Overview
      2. 8.17.2. Product/Service Portfolio
      3. 8.17.3. Nanocyl SA Sales, Revenue, Price, and Gross Margin
      4. 8.17.4. Nanocyl SA Revenue and Growth Rate
      5. 8.17.5. Nanocyl SA Market Share
      6. 8.17.6. Recent Initiatives, Funding/VC Activities, and Technological Innovations
    18. 8.18. Toray Industries, Inc.
      1. 8.18.1. Company Overview
      2. 8.18.2. Product/Service Portfolio
      3. 8.18.3. Toray Industries, Inc. Sales, Revenue, Price, and Gross Margin
      4. 8.18.4. Toray Industries, Inc. Revenue and Growth Rate
      5. 8.18.5. Toray Industries, Inc. Market Share
      6. 8.18.6. Recent Initiatives, Funding/VC Activities, and Technological Innovations
  9. Chapter 9 Carbon Nanotubes — Industry Analysis
    1. 9.1. Introduction and Taxonomy
    2. 9.2. Carbon Nanotubes Market – Key Trends
      1. 9.2.1. Market Drivers
      2. 9.2.2. Market Restraints
      3. 9.2.3. Market Opportunities
    3. 9.3. Value Chain Analysis
    4. 9.4. Key Mandates and Regulations
    5. 9.5. Technology Roadmap and Timeline
    6. 9.6. Carbon Nanotubes Market – Attractiveness Analysis
      1. 9.6.1. By Type
      2. 9.6.2. By Method
      3. 9.6.3. By Application
      4. 9.6.4. By Region
  10. Chapter 10 Raw Material Analysis
    1. 10.1. Carbon Nanotubes Key Raw Material Analysis
      1. 10.1.1. Key Raw Materials
      2. 10.1.2. Price Trend of Key Raw Materials
    2. 10.2. Key Suppliers of Raw Materials
    3. 10.3. Proportion of Manufacturing Cost Structure
      1. 10.3.1. Raw Materials Cost
      2. 10.3.2. Labor Cost
      3. 10.3.3. Manufacturing Expenses
      4. 10.3.4. Miscellaneous Expenses
    4. 10.4. Manufacturing Cost Analysis of Carbon Nanotubes
  11. Chapter 11 Industrial Chain, Sourcing Strategy, and Downstream Buyers
    1. 11.1. Carbon Nanotubes Industrial Chain Analysis
    2. 11.2. Upstream Raw Materials Sourcing
      1. 11.2.1. Risk Mitigation:
      2. 11.2.2. Supplier Relationships:
      3. 11.2.3. Business Processes:
      4. 11.2.4. Securing the Product:
    3. 11.3. Raw Materials Sources of Carbon Nanotubes Major Manufacturers
    4. 11.4. Downstream Buyers
    5. 11.5. Distributors/Traders List
  12. Chapter 12 Marketing Strategy Analysis, Distributors
    1. 12.1. Marketing Channel
    2. 12.2. Direct Marketing
    3. 12.3. Indirect Marketing
    4. 12.4. Marketing Channel Development Trends
    5. 12.5. Economic/Political Environmental Change
  13. Chapter 13 Report Conclusion & Key Insights
    1. 13.1. Key Insights from Primary Interviews & Surveys Respondents
    2. 13.2. Key Takeaways from Analysts, Consultants, and Industry Leaders
  14. Chapter 14 Research Approach & Methodology
    1. 14.1. Report Description
    2. 14.2. Research Scope
    3. 14.3. Research Methodology
      1. 14.3.1. Secondary Research
      2. 14.3.2. Primary Research
      3. 14.3.3. Statistical Models
        1. 14.3.3.1. Company Share Analysis Model
        2. 14.3.3.2. Revenue Based Modeling
      4. 14.3.4. Research Limitations

      List of Figures

      Fig.1 Product Picture of Carbon Nanotubes
      Fig.2 Global Carbon Nanotubes Market, 2016 – 2026 (USD Million)
      Fig.3 Global Carbon Nanotubes Market, 2016 – 2026 (Tons)
      Fig.4 Global Carbon Nanotubes Market Absolute Revenue Opportunity, 2016 – 2026 (USD Million)
      Fig.5 Global Carbon Nanotubes Market Incremental Revenue Opportunity, 2020 – 2026 (USD Million)
      Fig.6 Global Carbon Nanotubes Market Share, by Type, 2019 & 2026 (USD Million)
      Fig.7 Global Carbon Nanotubes Market Share, by Type, 2019 & 2026 (Tons)
      Fig.8 Global Single Carbon Nanotubes Market, 2016 – 2026 (USD Million)
      Fig.9 Global Single Carbon Nanotubes Market, 2016 – 2026 (Tons)
      Fig.10 Global Multi Walled Carbon Nanotubes Market, 2016 – 2026 (USD Million)
      Fig.11 Global Multi Walled Carbon Nanotubes Market, 2016 – 2026 (Tons)
      Fig.12 Global Carbon Nanotubes Market Share, by Method, 2019 & 2026 (USD Million)
      Fig.13 Global Carbon Nanotubes Market Share, by Method, 2019 & 2026 (Tons)
      Fig.14 Global Chemical Vapor Deposition Carbon Nanotubes Market, 2016 – 2026 (USD Million)
      Fig.15 Global Chemical Vapor Deposition Carbon Nanotubes Market, 2016 – 2026 (Tons)
      Fig.16 Global Catalytic Chemical Vapor Deposition Carbon Nanotubes Market, 2016 – 2026 (USD Million)
      Fig.17 Global Catalytic Chemical Vapor Deposition Carbon Nanotubes Market, 2016 – 2026 (Tons)
      Fig.18 Global High Pressure Carbon Monoxide Carbon Nanotubes Market, 2016 – 2026 (USD Million)
      Fig.19 Global High Pressure Carbon Monoxide Carbon Nanotubes Market, 2016 – 2026 (Tons)
      Fig.20 Global Carbon Nanotubes Market Share, by Application, 2019 & 2026 (USD Million)
      Fig.21 Global Carbon Nanotubes Market Share, by Application, 2019 & 2026 (Tons)
      Fig.22 Global Electronics & Semiconductors Carbon Nanotubes Market, 2016 – 2026 (USD Million)
      Fig.23 Global Electronics & Semiconductors Carbon Nanotubes Market, 2016 – 2026 (Tons)
      Fig.24 Global Advanced Materials Carbon Nanotubes Market, 2016 – 2026 (USD Million)
      Fig.25 Global Advanced Materials Carbon Nanotubes Market, 2016 – 2026 (Tons)
      Fig.26 Global Chemical & Polymers Carbon Nanotubes Market, 2016 – 2026 (USD Million)
      Fig.27 Global Chemical & Polymers Carbon Nanotubes Market, 2016 – 2026 (Tons)
      Fig.28 Global Batteries & Capacitors Carbon Nanotubes Market, 2016 – 2026 (USD Million)
      Fig.29 Global Batteries & Capacitors Carbon Nanotubes Market, 2016 – 2026 (Tons)
      Fig.30 Global Aerospace & Defense Carbon Nanotubes Market, 2016 – 2026 (USD Million)
      Fig.31 Global Aerospace & Defense Carbon Nanotubes Market, 2016 – 2026 (Tons)
      Fig.32 Global Energy Carbon Nanotubes Market, 2016 – 2026 (USD Million)
      Fig.33 Global Energy Carbon Nanotubes Market, 2016 – 2026 (Tons)
      Fig.34 Global Others Carbon Nanotubes Market, 2016 – 2026 (USD Million)
      Fig.35 Global Others Carbon Nanotubes Market, 2016 – 2026 (Tons)
      Fig.36 Global Carbon Nanotubes Market Share, by Region, 2019 & 2026 (USD Million)
      Fig.37 Global Carbon Nanotubes Market Share, by Region, 2019 & 2026 (Tons)
      Fig.38 North America Carbon Nanotubes Market, 2016 – 2026 (USD Million)
      Fig.39 North America Carbon Nanotubes Market, 2016 – 2026 (Tons)
      Fig.40 U.S. Carbon Nanotubes Market, 2016 – 2026 (USD Million)
      Fig.41 U.S. Carbon Nanotubes  Market, 2016 – 2026 (Tons)
      Fig.42 Canada Carbon Nanotubes Market, 2016 – 2026 (USD Million)
      Fig.43 Canada Carbon Nanotubes  Market, 2016 – 2026 (Tons)
      Fig.44 Europe Carbon Nanotubes Market, 2016 – 2026 (USD Million)
      Fig.45 Europe Carbon Nanotubes Market, 2016 – 2026 (Tons)
      Fig.46 Germany Carbon Nanotubes Market, 2016 – 2026 (USD Million)
      Fig.47 Germany Carbon Nanotubes  Market, 2016 – 2026 (Tons)
      Fig.48 France Carbon Nanotubes Market, 2016 – 2026 (USD Million)
      Fig.49 France Carbon Nanotubes  Market, 2016 – 2026 (Tons)
      Fig.50 U.K. Carbon Nanotubes Market, 2016 – 2026 (USD Million)
      Fig.51 U.K. Carbon Nanotubes  Market, 2016 – 2026 (Tons)
      Fig.52 Italy Carbon Nanotubes Market, 2016 – 2026 (USD Million)
      Fig.53 Italy Carbon Nanotubes  Market, 2016 – 2026 (Tons)
      Fig.54 Spain Carbon Nanotubes Market, 2016 – 2026 (USD Million)
      Fig.55 Spain Carbon Nanotubes  Market, 2016 – 2026 (Tons)
      Fig.56 Rest of Europe Carbon Nanotubes Market, 2016 – 2026 (USD Million)
      Fig.57 Rest of Europe Carbon Nanotubes  Market, 2016 – 2026 (Tons)
      Fig.58 Asia Pacific Carbon Nanotubes Market, 2016 – 2026 (USD Million)
      Fig.59 Asia Pacific Carbon Nanotubes Market, 2016 – 2026 (Tons)
      Fig.60 China Carbon Nanotubes Market, 2016 – 2026 (USD Million)
      Fig.61 China Carbon Nanotubes  Market, 2016 – 2026 (Tons)
      Fig.62 Japan Carbon Nanotubes Market, 2016 – 2026 (USD Million)
      Fig.63 Japan Carbon Nanotubes  Market, 2016 – 2026 (Tons)
      Fig.64 India Carbon Nanotubes Market, 2016 – 2026 (USD Million)
      Fig.65 India Carbon Nanotubes  Market, 2016 – 2026 (Tons)
      Fig.66 South  Korea Carbon Nanotubes Market, 2016 – 2026 (USD Million)
      Fig.67 South  Korea Carbon Nanotubes  Market, 2016 – 2026 (Tons)
      Fig.68 South-East Asia Carbon Nanotubes Market, 2016 – 2026 (USD Million)
      Fig.69 South-East Asia Carbon Nanotubes  Market, 2016 – 2026 (Tons)
      Fig.70 Rest of Asia Pacific Carbon Nanotubes Market, 2016 – 2026 (USD Million)
      Fig.71 Rest of Asia Pacific Carbon Nanotubes  Market, 2016 – 2026 (Tons)
      Fig.72 Latin America Carbon Nanotubes Market, 2016 – 2026 (USD Million)
      Fig.73 Latin America Carbon Nanotubes Market, 2016 – 2026 (Tons)
      Fig.74 Brazil Carbon Nanotubes Market, 2016 – 2026 (USD Million)
      Fig.75 Brazil Carbon Nanotubes  Market, 2016 – 2026 (Tons)
      Fig.76 Mexico Carbon Nanotubes Market, 2016 – 2026 (USD Million)
      Fig.77 Mexico Carbon Nanotubes  Market, 2016 – 2026 (Tons)
      Fig.78 Rest of Latin America Carbon Nanotubes Market, 2016 – 2026 (USD Million)
      Fig.79 Rest of Latin America Carbon Nanotubes  Market, 2016 – 2026 (Tons)
      Fig.80 The Middle-East and Africa Carbon Nanotubes Market, 2016 – 2026 (USD Million)
      Fig.81 The Middle-East and Africa Carbon Nanotubes Market, 2016 – 2026 (Tons)
      Fig.82 GCC Countries Carbon Nanotubes Market, 2016 – 2026 (USD Million)
      Fig.83 GCC Countries Carbon Nanotubes  Market, 2016 – 2026 (Tons)
      Fig.84 South Africa Carbon Nanotubes Market, 2016 – 2026 (USD Million)
      Fig.85 South Africa Carbon Nanotubes  Market, 2016 – 2026 (Tons)
      Fig.86 Rest of Middle-East Africa Carbon Nanotubes Market, 2016 – 2026 (USD Million)
      Fig.87 Rest of Middle-East Africa Carbon Nanotubes  Market, 2016 – 2026 (Tons)
      Fig.88 Global Carbon Nanotubes Production and Consumption, 2016 – 2026 (Tons)
      Fig.89 North America Carbon Nanotubes Production and Consumption, 2016 – 2026 (USD Million) (Tons)
      Fig.90 Europe Carbon Nanotubes Production and Consumption, 2016 – 2026 (USD Million) (Tons)
      Fig.91 Asia Pacific Carbon Nanotubes Production and Consumption, 2016 – 2026 (USD Million) (Tons)
      Fig.92 Latin America Carbon Nanotubes Production and Consumption, 2016 – 2026 (USD Million) (Tons)
      Fig.93 The Middle-East and Africa Carbon Nanotubes Production and Consumption, 2016 – 2026 (USD Million) (Tons)
      Fig.94 Competitor Market Share – Revenue
      Fig.95 Competitor Market Share – Volume
      Fig.96 Arkema Group Revenue and Growth Rate
      Fig.97 Arkema Group Market Share
      Fig.98 Chasm Advanced Materials Inc. Revenue and Growth Rate
      Fig.99 Chasm Advanced Materials Inc. Market Share
      Fig.100 Showa Denko K.K. Revenue and Growth Rate
      Fig.101 Showa Denko K.K. Market Share
      Fig.102 Arry International Group LTD. Revenue and Growth Rate
      Fig.103 Arry International Group LTD. Market Share
      Fig.104 Ocsial Llc Revenue and Growth Rate
      Fig.105 Ocsial Llc Market Share
      Fig.106 Cheap Tubes Inc. Revenue and Growth Rate
      Fig.107 Cheap Tubes Inc. Market Share
      Fig.108 Cnano Technology Limited Revenue and Growth Rate
      Fig.109 Cnano Technology Limited Market Share
      Fig.110 Futurecarbon GmbH Revenue and Growth Rate
      Fig.111 Futurecarbon GmbH Market Share
      Fig.112 Carbon Solutions Inc. Revenue and Growth Rate
      Fig.113 Carbon Solutions Inc. Market Share
      Fig.114 Hyperion Catalysis International Revenue and Growth Rate
      Fig.115 Hyperion Catalysis International Market Share
      Fig.116 Hanwha Chemical Corp. Revenue and Growth Rate
      Fig.117 Hanwha Chemical Corp. Market Share
      Fig.118 Klean Industries Inc. Revenue and Growth Rate
      Fig.119 Klean Industries Inc. Market Share
      Fig.120 CNT Co., Ltd. Revenue and Growth Rate
      Fig.121 CNT Co., Ltd. Market Share
      Fig.122 Continental Carbon Company Revenue and Growth Rate
      Fig.123 Continental Carbon Company Market Share
      Fig.124 LG Chem Revenue and Growth Rate
      Fig.125 LG Chem Market Share
      Fig.126 Nano-C Inc. Revenue and Growth Rate
      Fig.127 Nano-C Inc. Market Share
      Fig.128 Nanocyl SA Revenue and Growth Rate
      Fig.129 Nanocyl SA Market Share
      Fig.130 Toray Industries, Inc. Revenue and Growth Rate
      Fig.131 Toray Industries, Inc. Market Share
      Fig.132 Market Dynamics
      Fig.133 Global Carbon Nanotubes – Value Chain Analysis
      Fig.134 Key Mandates and Regulations
      Fig.135 Technology Roadmap and Timeline
      Fig.136 Market Attractiveness Analysis – By Type
      Fig.137 Market Attractiveness Analysis – By Method
      Fig.138 Market Attractiveness Analysis – By Application
      Fig.139 Market Attractiveness Analysis – By Region
      Fig.140 Manufacturing Cost Structure of Carbon Nanotubes
      Fig.141 Carbon Nanotubes Industrial Chain Analysis
      Fig.142 Market Channels
      Fig.143 Marketing Channel Development Trend
      Fig.144 Growth in World Gross Product, 2008-2018

      List of Tables

      Table 1 Global Carbon Nanotubes Market, 2019 & 2026 (USD Million)
      Table 2 Global Carbon Nanotubes Market, by Type, 2016 – 2026 (USD Million)
      Table 3 Global Carbon Nanotubes Market, by Type, 2016 – 2026 (Tons)
      Table 4 Global Carbon Nanotubes Market, by Method, 2016 – 2026 (USD Million)
      Table 5 Global Carbon Nanotubes Market, by Method, 2016 – 2026 (Tons)
      Table 6 Global Carbon Nanotubes Market, by Application, 2016 – 2026 (USD Million)
      Table 7 Global Carbon Nanotubes Market, by Application, 2016 – 2026 (Tons)
      Table 8 Global Carbon Nanotubes Market, by Region, 2016 – 2026 (USD Million)
      Table 9 Global Carbon Nanotubes Market, by Region, 2016 – 2026 (Tons)
      Table 10 North America Carbon Nanotubes Market, by Country, 2016 – 2026 (USD Million)
      Table 11 North America Carbon Nanotubes Market, by Country, 2016 – 2026 (Tons)
      Table 12 North America Carbon Nanotubes Market, by Type, 2016 – 2026 (USD Million)
      Table 13 North America Carbon Nanotubes Market, by Type, 2016 – 2026 (Tons)
      Table 14 North America Carbon Nanotubes Market, by Method, 2016 – 2026 (USD Million)
      Table 15 North America Carbon Nanotubes Market, by Method, 2016 – 2026 (Tons)
      Table 16 North America Carbon Nanotubes Market, by Application, 2016 – 2026 (USD Million)
      Table 17 North America Carbon Nanotubes Market, by Application, 2016 – 2026 (Tons)
      Table 18 Europe Carbon Nanotubes Market, by Country, 2016 – 2026 (USD Million)
      Table 19 Europe Carbon Nanotubes Market, by Country, 2016 – 2026 (Tons)
      Table 20 Europe Carbon Nanotubes Market, by Type, 2016 – 2026 (USD Million)
      Table 21 Europe Carbon Nanotubes Market, by Type, 2016 – 2026 (Tons)
      Table 22 Europe Carbon Nanotubes Market, by Method, 2016 – 2026 (USD Million)
      Table 23 Europe Carbon Nanotubes Market, by Method, 2016 – 2026 (Tons)
      Table 24 Europe Carbon Nanotubes Market, by Application, 2016 – 2026 (USD Million)
      Table 25 Europe Carbon Nanotubes Market, by Application, 2016 – 2026 (Tons)
      Table 26 Asia Pacific Carbon Nanotubes Market, by Country, 2016 – 2026 (USD Million)
      Table 27 Asia Pacific Carbon Nanotubes Market, by Country, 2016 – 2026 (Tons)
      Table 28 Asia Pacific Carbon Nanotubes Market, by Type, 2016 – 2026 (USD Million)
      Table 29 Asia Pacific Carbon Nanotubes Market, by Type, 2016 – 2026 (Tons)
      Table 30 Asia Pacific Carbon Nanotubes Market, by Method, 2016 – 2026 (USD Million)
      Table 31 Asia Pacific Carbon Nanotubes Market, by Method, 2016 – 2026 (Tons)
      Table 32 Asia Pacific Carbon Nanotubes Market, by Application, 2016 – 2026 (USD Million)
      Table 33 Asia Pacific Carbon Nanotubes Market, by Application, 2016 – 2026 (Tons)
      Table 34 Latin America Carbon Nanotubes Market, by Country, 2016 – 2026 (USD Million)
      Table 35 Latin America Carbon Nanotubes Market, by Country, 2016 – 2026 (Tons)
      Table 36 Latin America Carbon Nanotubes Market, by Type, 2016 – 2026 (USD Million)
      Table 37 Latin America Carbon Nanotubes Market, by Type, 2016 – 2026 (Tons)
      Table 38 Latin America Carbon Nanotubes Market, by Method, 2016 – 2026 (USD Million)
      Table 39 Latin America Carbon Nanotubes Market, by Method, 2016 – 2026 (Tons)
      Table 40 Latin America Carbon Nanotubes Market, by Application, 2016 – 2026 (USD Million)
      Table 41 Latin America Carbon Nanotubes Market, by Application, 2016 – 2026 (Tons)
      Table 42 The Middle-East and Africa Carbon Nanotubes Market, by Country, 2016 – 2026 (USD Million)
      Table 43 The Middle-East and Africa Carbon Nanotubes Market, by Country, 2016 – 2026 (Tons)
      Table 44 The Middle-East and Africa Carbon Nanotubes Market, by Type, 2016 – 2026 (USD Million)
      Table 45 The Middle-East and Africa Carbon Nanotubes Market, by Type, 2016 – 2026 (Tons)
      Table 46 The Middle-East and Africa Carbon Nanotubes Market, by Method, 2016 – 2026 (USD Million)
      Table 47 The Middle-East and Africa Carbon Nanotubes Market, by Method, 2016 – 2026 (Tons)
      Table 48 The Middle-East and Africa Carbon Nanotubes Market, by Application, 2016 – 2026 (USD Million)
      Table 49 The Middle-East and Africa Carbon Nanotubes Market, by Application, 2016 – 2026 (Tons)
      Table 50 North America Carbon Nanotubes Production, Consumption, Export, Import, 2016 – 2019
      Table 51 Europe Carbon Nanotubes Production, Consumption, Export, Import, 2016 – 2019
      Table 52 Asia Pacific Carbon Nanotubes Production, Consumption, Export, Import, 2016 – 2019
      Table 53 Latin America Carbon Nanotubes Production, Consumption, Export, Import, 2016 – 2019
      Table 54 The Middle-East and Africa Carbon Nanotubes Production, Consumption, Export, Import, 2016 – 2019
      Table 55 Global Carbon Nanotubes Market - Company Revenue Analysis, 2016 – 2019 (USD Million)
      Table 56 Global Carbon Nanotubes Market - Company Revenue Share Analysis, 2016 – 2019 (%)
      Table 57 Global Carbon Nanotubes Market - Company Volume Analysis, 2016 – 2019 (Tons)
      Table 58 Global Carbon Nanotubes Market - Company Volume Share Analysis, 2016 – 2019 (%)
      Table 59 Acquisitions and Mergers
      Table 60 Market Drivers – Impact Analysis
      Table 61 Market Restraints
      Table 62 Market Opportunities
      Table 63 Production Base and Market Concentration Rate of Raw Material
      Table 64 Key Suppliers of Raw Materials
      Table 65 Raw Materials Sources of Carbon Nanotubes Major Manufacturers
      Table 66 Major Buyers of Carbon Nanotubes
      Table 67 Distributors/Traders of Carbon Nanotubes by Region

Industry Major Market Players

  • Arkema Group
  • Chasm Advanced Materials Inc.
  • Showa Denko K.K.
  • Arry International Group LTD.
  • Ocsial Llc
  • Cheap Tubes Inc.
  • Cnano Technology Limited
  • Futurecarbon GmbH
  • Carbon Solutions Inc.
  • Hyperion Catalysis International
  • Hanwha Chemical Corp.
  • Klean Industries Inc.
  • CNT Co., Ltd.
  • Continental Carbon Company
  • LG Chem
  • Nano-C Inc.
  • Nanocyl SA
  • Toray Industries, Inc.