Search Market Research Report

Discover Our Latest Reports
Discover Our Featured Reports
Discover Top Selling Reports

Carbon Nanomaterials Market Size, Share Global Analysis Report, 2020–2026

report img

Carbon Nanomaterials Market By Type (Carbon Nanotubes, Carbon Nanofibres, Graphene, Fullerenes & Carbon Diamonds) and By Application (Automotive, Aerospace & Defence, Medical, Electronics & Energy, and Others): Global Industry Outlook, Market Size, Business Intelligence, Consumer Preferences, Statistical Surveys, Comprehensive Analysis, Historical Developments, Current Trends, and Forecast 2020–2026

Industry Insights

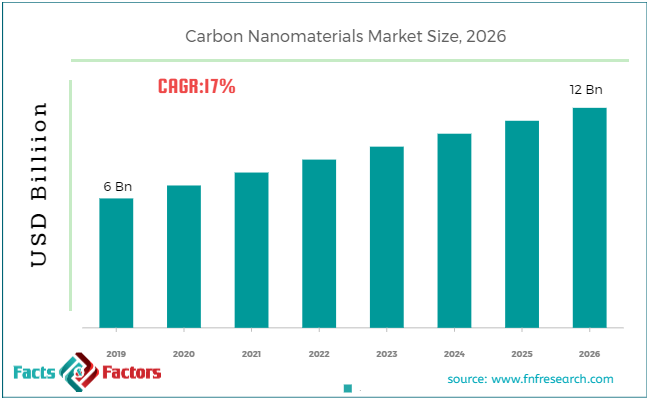
According to the report published by Facts & Factors, the global Carbon Nanomaterials market size was worth around USD 6 billion in 2019 and is predicted to grow around USD 12 billion by 2026 with a compound annual growth rate (CAGR) of roughly 17% between 2020 and 2026. The report analyzes the global Carbon Nanomaterials market drivers, restraints/challenges, and the effect they have on the demands during the projection period. In addition, the report explores emerging opportunities in the Carbon Nanomaterials market.

The Carbon Nanomaterials market report analyzes and notifies the industry statistics at the global as well as regional and country levels in order to acquire a thorough perspective of the entire Carbon Nanomaterials market. The historical and past insights are provided for FY 2016 to FY 2019 whereas projected trends are delivered for FY 2020 to FY 2026. The quantitative and numerical data is represented in terms of both volume (Kilo Tons) and value (USD Million) from FY 2016 – 2026.

This specialized and expertise-oriented industry research report scrutinizes the technical and commercial business outlook of the Carbon Nanomaterials industry. The report analyzes and declares the historical and current trends analysis of the Carbon Nanomaterials industry and subsequently recommends the projected trends anticipated to be observed in the Carbon Nanomaterials market during the upcoming years.

Carbon Nanomaterials Market Size

To know more about this report | Request Free Sample Copy

logoKey Insights from Primary Research

  • As per the data provided by our primary respondents, the Carbon Nanomaterials market is anticipated to grow with a CAGR of around 17%.
  • Through the primary research data, it was analyzed that the Carbon Nanomaterials market was valued at around USD 6 Billion in 2019.
  • The “Carbon nanotube” category, on the basis of type segmentation, was among the top leading revenue generator in 2019.
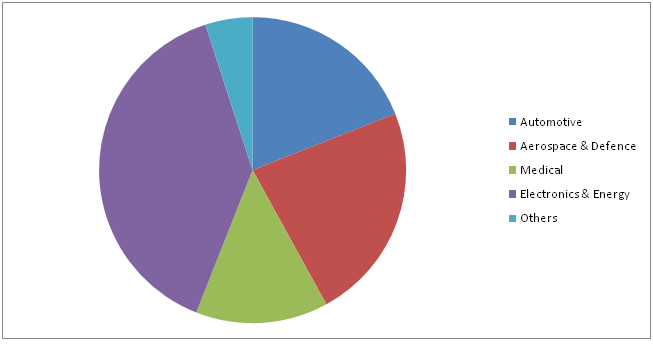
  • The “Electronics & Energy” category, on the basis of application segmentation, was considered the top applications in 2019
  • As per the regional analysis, “North America” is expected to dominate the market owing to its significant use of carbon nanomaterials in various industries with the usage of its advanced technology.

logoKey Recommendations from Analysts

  • As per our analysts, the carbon nanomaterials market is in huge demand due to its use in multiple end-user applications and sectors like electronics, automobile, medical, defense, energy, and others.
  • The increasing demand for light-weighted materials in major industries like automotive and aerospace has helped in the growth of the market.
  • As the Carbon Nanomaterials market is growing at a CAGR of around 17%, there are various opportunities for the investors for gaining good returns through in the forecasted period.
  • Good investment opportunities are available in the Asia Pacific region as the countries of this region are among the top emerging economies and the governments are inviting many foreign investors for investments in their infrastructural plans.
  • Our analysts have also identified “Carbon Nanofibres” and “Medical” categories as the top investment options for the Carbon Nanomaterials market in terms of type and application segmentation respectively.

logoMarket Attractiveness – By End-User

Carbon Nanomaterials Market

To know more about this report | Request Free Sample Copy

The quantitative data is further underlined and reinforced by comprehensive qualitative data which comprises various across-the-board market dynamics. The rationales which directly or indirectly impact the Carbon Nanomaterials industry are exemplified through parameters such as growth drivers, restraints, challenges, and opportunities among other impacting factors.

Throughout our research report, we have encompassed all the proven models and tools of industry analysis and extensively illustrated all the key business strategies and business models adopted in the Carbon Nanomaterials industry. The report provides an all-inclusive and detailed competitive landscape prevalent in the Carbon Nanomaterials market.

The report utilizes established industry analysis tools and models such as Porter’s Five Forces framework to analyze and recognize critical business strategies adopted by various stakeholders involved in the entire value chain of the Carbon Nanomaterials industry. The Carbon Nanomaterials market report additionally employs SWOT analysis and PESTLE analysis models for further in-depth analysis.

The report study further includes an in-depth analysis of industry players' market shares and provides an overview of leading players' market position in the Carbon Nanomaterials sector. Key strategic developments in the Carbon Nanomaterials market competitive landscape such as acquisitions & mergers, inaugurations of different products and services, partnerships & joint ventures, MoU agreements, VC & funding activities, R&D activities, and geographic expansion among other noteworthy activities by key players of the Carbon Nanomaterials market are appropriately highlighted in the report.

Globally North America led the demand for carbon nanomaterials with its advanced production techniques and higher penetration and use of carbon nanomaterials in various end-use industries. The automotive & defense segment dominated the end-user markets in North America due to increasing defense research and increasing demand for carbon nanotubes in the region. The Asia Pacific is expected to be the second-fastest-growing market for carbon nanomaterials. The majority of developments in the field of electronics and telecommunications are expected to support the growth of the carbon nanomaterials market in this region.

The Carbon Nanomaterials market research report delivers an acute valuation and taxonomy of the Carbon Nanomaterials industry by practically splitting the market on the basis of different types, applications, and regions. Through the analysis of the historical and projected trends, all the segments and sub-segments were evaluated through the bottom-up approach, and different market sizes have been projected for FY 2020 to FY 2026. The regional segmentation of the Carbon Nanomaterials industry includes the complete classification of all the major continents including North America, Latin America, Europe, Asia Pacific, and the Middle East & Africa. Further, country-wise data for the Carbon Nanomaterials industry is provided for the leading economies of the world.

The Carbon Nanomaterials market is segmented based on Type and Application. On the basis of type segmentation, the market is classified into Carbon Nanotubes, Carbon Nanofibres, Graphene, Fullerenes, & Carbon Diamonds. In terms of Application segmentation, the market is bifurcated into Automotive, Aerospace & Defence, Medical, Electronics & Energy, and Others.

logoReport Scope

Report Attribute

Details

Market Size in 2019

USD 6 Billion

Projected Market Size in 2026

USD 12 Billion

CAGR Growth Rate

17% CAGR

Base Year

2019

Forecast Years

2020-2026

Key Market Players

E. I. du Pont de Nemours and Company, Ahlstrom, Hyperion Catalysis International Inc, Hollingsworth &Vose, Bayer AG, Arkema, CNano Technology Ltd, Kuraray Co. Ltd, Showa Denko, Continental Carbon Company, Finetex, Elmarco, Nanocyl SA, Others

Key Segment

By Type, Application, and Region

Major Regions Covered

North America, Europe, Asia Pacific, Latin America, and the Middle East &, Africa

Purchase Options

Request customized purchase options to meet your research needs. Explore purchase options

logoSome of the essential players operating in the Carbon Nanomaterials market, but not restricted include

  • E. I. du Pont de Nemours and Company
  • Ahlstrom
  • Hyperion Catalysis International Inc
  • Hollingsworth &Vose
  • Bayer AG
  • Arkema
  • CNano Technology Ltd
  • Kuraray Co. Ltd
  • Showa Denko
  • Continental Carbon Company
  • Finetex
  • Elmarco
  • Nanocyl SA

The taxonomy of the Carbon Nanomaterials industry by its scope and segmentation is as follows:

logo By Type Segmentation Analysis (Customizable)

  • Carbon Nanotubes
  • Carbon Nanofibres
  • Graphene
  • Fullerenes
  • Carbon Diamonds

logo By Application Segmentation Analysis (Customizable)

  • Automotive
  • Aerospace & Defence
  • Medical
  • Electronics & Energy
  • Others

logo Regional Segmentation Analysis (Customizable)

  • North America
    • The U.S.
    • Canada
  • Europe
    • Germany
    • The UK
    • France
    • Spain
    • Italy
    • Rest of Europe
  • Asia Pacific
    • China
    • Japan
    • India
    • South Korea
    • Southeast Asia
    • Rest of Asia Pacific
  • Latin America
    • Brazil
    • Mexico
    • Rest of Latin America
  • Middle East & Africa
    • GCC
    • South Africa
    • Rest of the Middle East & Africa

Table of Content

  1. CHAPTER 1. Executive Summary
  2. CHAPTER 2. Carbon Nanomaterials market – Type Analysis
    1. 2.1. Global Carbon Nanomaterials Market – Type Overview
    2. 2.2. Global Carbon Nanomaterials Market Share, by Type, 2018 & 2025 (USD Million)
    3. 2.3. Global Carbon Nanomaterials Market share, by Type, 2018 & 2025 (Kilo Tons)
    4. 2.4. Carbon Nanotubes
      1. 2.4.1. Global Carbon Nanotubes Carbon Nanomaterials Market, 2016-2026 (USD Million)
      2. 2.4.2. Global Carbon Nanotubes Carbon Nanomaterials Market, 2016-2026 (Kilo Tons)
    5. 2.5. Carbon Nanofibres
      1. 2.5.1. Global Carbon Nanofibres Carbon Nanomaterials Market, 2016-2026 (USD Million)
      2. 2.5.2. Global Carbon Nanofibres Carbon Nanomaterials Market, 2016-2026 (Kilo Tons)
    6. 2.6. Graphene
      1. 2.6.1. Global Graphene Carbon Nanomaterials Market, 2016-2026 (USD Million)
      2. 2.6.2. Global Graphene Carbon Nanomaterials Market, 2016-2026 (Kilo Tons)
    7. 2.7. Fullerenes
      1. 2.7.1. Global Fullerenes Carbon Nanomaterials Market, 2016-2026 (USD Million)
      2. 2.7.2. Global Fullerenes Carbon Nanomaterials Market, 2016-2026 (Kilo Tons)
    8. 2.8. Carbon Diamonds
      1. 2.8.1. Global Carbon Diamonds Carbon Nanomaterials Market, 2016-2026 (USD Million)
      2. 2.8.2. Global Carbon Diamonds Carbon Nanomaterials Market, 2016-2026 (Kilo Tons)
  3. CHAPTER 3. Carbon Nanomaterials market – Application Analysis
    1. 3.1. Global Carbon Nanomaterials Market – Application Overview
    2. 3.2. Global Carbon Nanomaterials Market Share, by Application, 2018 & 2025 (USD Million)
    3. 3.3. Global Carbon Nanomaterials Market share, by Application, 2018 & 2025 (Kilo Tons)
    4. 3.4. Automotive
      1. 3.4.1. Global Automotive Carbon Nanomaterials Market, 2016-2026 (USD Million)
      2. 3.4.2. Global Automotive Carbon Nanomaterials Market, 2016-2026 (Kilo Tons)
    5. 3.5. Aerospace & Defence
      1. 3.5.1. Global Aerospace & Defence Carbon Nanomaterials Market, 2016-2026 (USD Million)
      2. 3.5.2. Global Aerospace & Defence Carbon Nanomaterials Market, 2016-2026 (Kilo Tons)
    6. 3.6. Medical
      1. 3.6.1. Global Medical Carbon Nanomaterials Market, 2016-2026 (USD Million)
      2. 3.6.2. Global Medical Carbon Nanomaterials Market, 2016-2026 (Kilo Tons)
    7. 3.7. Electronics & Energy
      1. 3.7.1. Global Electronics & Energy Carbon Nanomaterials Market, 2016-2026 (USD Million)
      2. 3.7.2. Global Electronics & Energy Carbon Nanomaterials Market, 2016-2026 (Kilo Tons)
    8. 3.8. Others
      1. 3.8.1. Global Others Carbon Nanomaterials Market, 2016-2026 (USD Million)
      2. 3.8.2. Global Others Carbon Nanomaterials Market, 2016-2026 (Kilo Tons)
  4. CHAPTER 4. Carbon Nanomaterials market – Regional Analysis
    1. 4.1. Global Carbon Nanomaterials Market Regional Overview
    2. 4.2. Global Carbon Nanomaterials Market Share, by Region, 2018 & 2025 (Value)
    3. 4.3. Global Carbon Nanomaterials Market Share, by Region, 2018 & 2025 (Volume)
    4. 4.4. North America
      1. 4.4.1. North America Carbon Nanomaterials Market size and forecast, 2016-2026
      2. 4.4.2. North America Carbon Nanomaterials Market, by Country, 2018 - 2025 (USD Million)
      3. 4.4.3. North America Market size and forecast, 2016-2026 (Kilo Tons)
      4. 4.4.4. North America Carbon Nanomaterials Market, by Country, 2018 - 2025 (Kilo Tons)
      5. 4.4.5. North America Carbon Nanomaterials Market, by Type, 2016-2026
        1. 4.4.5.1. North America Carbon Nanomaterials Market, by Type, 2016-2026 (USD Million)
        2. 4.4.5.2. North America Carbon Nanomaterials Market, by Type, 2016-2026 (Kilo Tons)
      6. 4.4.6. North America Carbon Nanomaterials Market, by Application, 2016-2026
        1. 4.4.6.1. North America Carbon Nanomaterials Market, by Application, 2016-2026 (USD Million)
        2. 4.4.6.2. North America Carbon Nanomaterials Market, by Application, 2016-2026 (Kilo Tons)
      7. 4.4.7. U.S.
        1. 4.4.7.1. U.S. Market size and forecast, 2016-2026 (USD Million)
        2. 4.4.7.2. U.S. Market size and forecast, 2016-2026 (Kilo Tons)
      8. 4.4.8. Canada
        1. 4.4.8.1. Canada Market size and forecast, 2016-2026 (USD Million)
        2. 4.4.8.2. Canada Market size and forecast, 2016-2026 (Kilo Tons)
    5. 4.5. Europe
      1. 4.5.1. Europe Carbon Nanomaterials Market size and forecast, 2016-2026
      2. 4.5.2. Europe Carbon Nanomaterials Market, by Country, 2018 - 2025 (USD Million)
      3. 4.5.3. Europe Market size and forecast, 2016-2026 (Kilo Tons)
      4. 4.5.4. Europe Carbon Nanomaterials Market, by Country, 2018 - 2025 (Kilo Tons)
      5. 4.5.5. Europe Carbon Nanomaterials Market, by Type, 2016-2026
        1. 4.5.5.1. Europe Carbon Nanomaterials Market, by Type, 2016-2026 (USD Million)
        2. 4.5.5.2. Europe Carbon Nanomaterials Market, by Type, 2016-2026 (Kilo Tons)
      6. 4.5.6. Europe Carbon Nanomaterials Market, by Application, 2016-2026
        1. 4.5.6.1. Europe Carbon Nanomaterials Market, by Application, 2016-2026 (USD Million)
        2. 4.5.6.2. Europe Carbon Nanomaterials Market, by Application, 2016-2026 (Kilo Tons)
      7. 4.5.7. Germany
        1. 4.5.7.1. Germany Market size and forecast, 2016-2026 (USD Million)
        2. 4.5.7.2. Germany Market size and forecast, 2016-2026 (Kilo Tons)
      8. 4.5.8. France
        1. 4.5.8.1. France Market size and forecast, 2016-2026 (USD Million)
        2. 4.5.8.2. France Market size and forecast, 2016-2026 (Kilo Tons)
      9. 4.5.9. U.K.
        1. 4.5.9.1. U.K. Market size and forecast, 2016-2026 (USD Million)
        2. 4.5.9.2. U.K. Market size and forecast, 2016-2026 (Kilo Tons)
      10. 4.5.10. Italy
        1. 4.5.10.1. Italy Market size and forecast, 2016-2026 (USD Million)
        2. 4.5.10.2. Italy Market size and forecast, 2016-2026 (Kilo Tons)
      11. 4.5.11. Spain
        1. 4.5.11.1. Spain Market size and forecast, 2016-2026 (USD Million)
        2. 4.5.11.2. Spain Market size and forecast, 2016-2026 (Kilo Tons)
      12. 4.5.12. Rest of Europe
        1. 4.5.12.1. Rest of Europe Market size and forecast, 2016-2026 (USD Million)
        2. 4.5.12.2. Rest of Europe Market size and forecast, 2016-2026 (Kilo Tons)
    6. 4.6. Asia Pacific
      1. 4.6.1. Asia Pacific Carbon Nanomaterials Market size and forecast, 2016-2026
      2. 4.6.2. Asia Pacific Carbon Nanomaterials Market, by Country, 2018 - 2025 (USD Million)
      3. 4.6.3. Asia Pacific Market size and forecast, 2016-2026 (Kilo Tons)
      4. 4.6.4. Asia Pacific Carbon Nanomaterials Market, by Country, 2018 - 2025 (Kilo Tons)
      5. 4.6.5. Asia Pacific Carbon Nanomaterials Market, by Type, 2016-2026
        1. 4.6.5.1. Asia Pacific Carbon Nanomaterials Market, by Type, 2016-2026 (USD Million)
        2. 4.6.5.2. Asia Pacific Carbon Nanomaterials Market, by Type, 2016-2026 (Kilo Tons)
      6. 4.6.6. Asia Pacific Carbon Nanomaterials Market, by Application, 2016-2026
        1. 4.6.6.1. Asia Pacific Carbon Nanomaterials Market, by Application, 2016-2026 (USD Million)
        2. 4.6.6.2. Asia Pacific Carbon Nanomaterials Market, by Application, 2016-2026 (Kilo Tons)
      7. 4.6.7. China
        1. 4.6.7.1. China Market size and forecast, 2016-2026 (USD Million)
        2. 4.6.7.2. China Market size and forecast, 2016-2026 (Kilo Tons)
      8. 4.6.8. Japan
        1. 4.6.8.1. Japan Market size and forecast, 2016-2026 (USD Million)
        2. 4.6.8.2. Japan Market size and forecast, 2016-2026 (Kilo Tons)
      9. 4.6.9. India
        1. 4.6.9.1. India Market size and forecast, 2016-2026 (USD Million)
        2. 4.6.9.2. India Market size and forecast, 2016-2026 (Kilo Tons)
      10. 4.6.10. South Korea
        1. 4.6.10.1. South Korea Market size and forecast, 2016-2026 (USD Million)
        2. 4.6.10.2. South Korea Market size and forecast, 2016-2026 (Kilo Tons)
      11. 4.6.11. South-East Asia
        1. 4.6.11.1. South-East Asia Market size and forecast, 2016-2026 (USD Million)
        2. 4.6.11.2. South-East Asia Market size and forecast, 2016-2026 (Kilo Tons)
      12. 4.6.12. Rest of Asia Pacific
        1. 4.6.12.1. Rest of Asia Pacific Market size and forecast, 2016-2026 (USD Million)
        2. 4.6.12.2. Rest of Asia Pacific Market size and forecast, 2016-2026 (Kilo Tons)
    7. 4.7. Latin America
      1. 4.7.1. Latin America Carbon Nanomaterials Market size and forecast, 2016-2026
      2. 4.7.2. Latin America Carbon Nanomaterials Market, by Country, 2018 - 2025 (USD Million)
      3. 4.7.3. Latin America Market size and forecast, 2016-2026 (Kilo Tons)
      4. 4.7.4. Latin America Carbon Nanomaterials Market, by Country, 2018 - 2025 (Kilo Tons)
      5. 4.7.5. Latin America Carbon Nanomaterials Market, by Type, 2016-2026
        1. 4.7.5.1. Latin America Carbon Nanomaterials Market, by Type, 2016-2026 (USD Million)
        2. 4.7.5.2. Latin America Carbon Nanomaterials Market, by Type, 2016-2026 (Kilo Tons)
      6. 4.7.6. Latin America Carbon Nanomaterials Market, by Application, 2016-2026
        1. 4.7.6.1. Latin America Carbon Nanomaterials Market, by Application, 2016-2026 (USD Million)
        2. 4.7.6.2. Latin America Carbon Nanomaterials Market, by Application, 2016-2026 (Kilo Tons)
      7. 4.7.7. Brazil
        1. 4.7.7.1. Brazil Market size and forecast, 2016-2026 (USD Million)
        2. 4.7.7.2. Brazil Market size and forecast, 2016-2026 (Kilo Tons)
      8. 4.7.8. Mexico
        1. 4.7.8.1. Mexico Market size and forecast, 2016-2026 (USD Million)
        2. 4.7.8.2. Mexico Market size and forecast, 2016-2026 (Kilo Tons)
      9. 4.7.9. Rest of Latin America
        1. 4.7.9.1. Rest of Latin America Market size and forecast, 2016-2026 (USD Million)
        2. 4.7.9.2. Rest of Latin America Market size and forecast, 2016-2026 (Kilo Tons)
    8. 4.8. The Middle-East and Africa
      1. 4.8.1. The Middle-East and Africa Carbon Nanomaterials Market size and forecast, 2016-2026
      2. 4.8.2. The Middle-East and Africa Carbon Nanomaterials Market, by Country, 2018 - 2025 (USD Million)
      3. 4.8.3. The Middle-East and Africa Market size and forecast, 2016-2026 (Kilo Tons)
      4. 4.8.4. The Middle-East and Africa Carbon Nanomaterials Market, by Country, 2018 - 2025 (Kilo Tons)
      5. 4.8.5. The Middle-East and Africa Carbon Nanomaterials Market, by Type, 2016-2026
        1. 4.8.5.1. The Middle-East and Africa Carbon Nanomaterials Market, by Type, 2016-2026 (USD Million)
        2. 4.8.5.2. The Middle-East and Africa Carbon Nanomaterials Market, by Type, 2016-2026 (Kilo Tons)
      6. 4.8.6. The Middle-East and Africa Carbon Nanomaterials Market, by Application, 2016-2026
        1. 4.8.6.1. The Middle-East and Africa Carbon Nanomaterials Market, by Application, 2016-2026 (USD Million)
        2. 4.8.6.2. The Middle-East and Africa Carbon Nanomaterials Market, by Application, 2016-2026 (Kilo Tons)
      7. 4.8.7. GCC Countries
        1. 4.8.7.1. GCC Countries Market size and forecast, 2016-2026 (USD Million)
        2. 4.8.7.2. GCC Countries Market size and forecast, 2016-2026 (Kilo Tons)
      8. 4.8.8. South Africa
        1. 4.8.8.1. South Africa Market size and forecast, 2016-2026 (USD Million)
        2. 4.8.8.2. South Africa Market size and forecast, 2016-2026 (Kilo Tons)
      9. 4.8.9. Rest of Middle-East Africa
        1. 4.8.9.1. Rest of Middle-East Africa Market size and forecast, 2016-2026 (USD Million)
        2. 4.8.9.2. Rest of Middle-East Africa Market size and forecast, 2016-2026 (Kilo Tons)
  5. CHAPTER 5. Carbon Nanomaterials Production, Consumption, Export, Import by Regions
    1. 5.1. Global Carbon Nanomaterials production and revenue, 2015-2025 (USD Million) (Kilo Tons)
    2. 5.2. Global Import and Export Analysis, by Region
  6. CHAPTER 6. Carbon Nanomaterials market – Competitive Landscape
    1. 6.1. Competitor Market Share – Revenue
    2. 6.2. Market Concentration Rate Analysis, Top 3 and Top 5 Players
    3. 6.3. Competitor Market Share – Volume
    4. 6.4. Strategic Development
      1. 6.4.1. Acquisitions and Mergers
      2. 6.4.2. New Products
      3. 6.4.3. Research & Development Activities
  7. CHAPTER 7. Company Profiles
    1. 7.1. E. I. du Pont de Nemours and Company
      1. 7.1.1. Company Overview
      2. 7.1.2. E. I. du Pont de Nemours and Company Sales, Revenue, Price, and Gross Margin
      3. 7.1.3. Product portfolio
      4. 7.1.4. Recent initiatives
    2. 7.2. Ahlstrom
      1. 7.2.1. Company Overview
      2. 7.2.2. Ahlstrom Sales, Revenue, Price, and Gross Margin
      3. 7.2.3. Product portfolio
      4. 7.2.4. Recent initiatives
    3. 7.3. Hyperion Catalysis International Inc
      1. 7.3.1. Company Overview
      2. 7.3.2. Hyperion Catalysis International Inc Sales, Revenue, Price, and Gross Margin
      3. 7.3.3. Product portfolio
      4. 7.3.4. Recent initiatives
    4. 7.4. Hollingsworth & Vose
      1. 7.4.1. Company Overview
      2. 7.4.2. Hollingsworth & Vose Sales, Revenue, Price, and Gross Margin
      3. 7.4.3. Product portfolio
      4. 7.4.4. Recent initiatives
    5. 7.5. Bayer AG
      1. 7.5.1. Company Overview
      2. 7.5.2. Bayer AG Sales, Revenue, Price, and Gross Margin
      3. 7.5.3. Product portfolio
      4. 7.5.4. Recent initiatives
    6. 7.6. Arkema
      1. 7.6.1. Company Overview
      2. 7.6.2. Arkema Sales, Revenue, Price, and Gross Margin
      3. 7.6.3. Product portfolio
      4. 7.6.4. Recent initiatives
    7. 7.7. CNano Technology Ltd
      1. 7.7.1. Company Overview
      2. 7.7.2. CNano Technology Ltd Sales, Revenue, Price, and Gross Margin
      3. 7.7.3. Product portfolio
      4. 7.7.4. Recent initiatives
    8. 7.8. Kuraray Co. Ltd
      1. 7.8.1. Company Overview
      2. 7.8.2. Kuraray Co. Ltd Sales, Revenue, Price, and Gross Margin
      3. 7.8.3. Product portfolio
      4. 7.8.4. Recent initiatives
    9. 7.9. Showa Denko
      1. 7.9.1. Company Overview
      2. 7.9.2. Showa Denko Sales, Revenue, Price, and Gross Margin
      3. 7.9.3. Product portfolio
      4. 7.9.4. Recent initiatives
    10. 7.10. Continental Carbon Company
      1. 7.10.1. Company Overview
      2. 7.10.2. Continental Carbon Company Sales, Revenue, Price, and Gross Margin
      3. 7.10.3. Product portfolio
      4. 7.10.4. Recent initiatives
    11. 7.11. Finetex
      1. 7.11.1. Company Overview
      2. 7.11.2. Finetex Sales, Revenue, Price, and Gross Margin
      3. 7.11.3. Product portfolio
      4. 7.11.4. Recent initiatives
    12. 7.12. Elmarco
      1. 7.12.1. Company Overview
      2. 7.12.2. Elmarco Sales, Revenue, Price, and Gross Margin
      3. 7.12.3. Product portfolio
      4. 7.12.4. Recent initiatives
    13. 7.13. Nanocyl SA
      1. 7.13.1. Company Overview
      2. 7.13.2. Nanocyl SA Sales, Revenue, Price, and Gross Margin
      3. 7.13.3. Product portfolio
      4. 7.13.4. Recent initiatives
    14. 7.14. Others
      1. 7.14.1. Company Overview
      2. 7.14.2. Others Sales, Revenue, Price, and Gross Margin
      3. 7.14.3. Product portfolio
      4. 7.14.4. Recent initiatives
  8. CHAPTER 8. Carbon Nanomaterials — Industry Analysis
    1. 8.1. Introduction and Taxonomy
    2. 8.2. Carbon Nanomaterials Market – Key Trends
      1. 8.2.1. Market Drivers
      2. 8.2.2. Market Restraints
      3. 8.2.3. Market Opportunities
    3. 8.3. Value Chain Analysis
    4. 8.4. Key Mandates and Regulations
    5. 8.5. Technology Roadmap and Timeline
    6. 8.6. Carbon Nanomaterials market – Attractiveness Analysis
      1. 8.6.1. By Type
      2. 8.6.2. By Application
      3. 8.6.3. By Region
  9. CHAPTER 9. Raw Material analysis
    1. 9.1. Carbon Nanomaterials Key Raw Material Analysis
      1. 9.1.1. Key Raw Materials
      2. 9.1.2. Price Trend of Key Raw Materials
    2. 9.2. Key Suppliers of Raw Materials
    3. 9.3. Proportion of Manufacturing Cost Structure
      1. 9.3.1. Raw Materials
      2. 9.3.2. Labor Cost
    4. 9.4. Manufacturing Expenses Analysis of Carbon Nanomaterials
  10. CHAPTER 10. Industrial Chain, Sourcing Strategy and Downstream Buyers
    1. 10.1. Carbon Nanomaterials Industrial Chain Analysis
    2. 10.2. Upstream Raw Materials Sourcing
      1. 10.2.1. Risk Mitigation:
      2. 10.2.2. Supplier Relationships:
      3. 10.2.3. Business Processes:
      4. 10.2.4. Securing the Product:
    3. 10.3. Raw Materials Sources of Carbon Nanomaterials Major Manufacturers in 2016
    4. 10.4. Downstream Buyers
    5. 10.5. Distributors/Traders List
  11. CHAPTER 11. Marketing Strategy Analysis, Distributors
    1. 11.1. Marketing Channel
    2. 11.2. Direct Marketing
    3. 11.3. Indirect Marketing
    4. 11.4. Marketing Channel Development Trend
    5. 11.5. Economic/Political Environmental Change
  12. CHAPTER 12. Report Conclusion
  13. CHAPTER 13. Research Approach & Methodology
    1. 13.1. Report Description
    2. 13.2. Research Scope
    3. 13.3. Research Methodology
      1. 13.3.1. Secondary Research
      2. 13.3.2. Primary Research
      3. 13.3.3. Models
        1. 13.3.3.1. Company Share Analysis Model
        2. 13.3.3.2. Revenue Based Modeling
        3. 13.3.3.3. Research Limitations

        List of Figures

        FIG. 1 Global Carbon Nanomaterials Market, 2016-2026 (USD Million)
        FIG. 2 Global Carbon Nanomaterials Market Share, by Type, 2018 & 2025 (USD Million)
        FIG. 3 Global Carbon Nanomaterials Market share, by Type, 2018 & 2025 (Kilo Tons)
        FIG. 4 Global Carbon Nanotubes Carbon Nanomaterials Market, 2016-2026 (USD Million)
        FIG. 5 Global Carbon Nanotubes Carbon Nanomaterials  Market, 2016-2026 (Kilo Tons)
        FIG. 6 Global Carbon Nanofibres Carbon Nanomaterials Market, 2016-2026 (USD Million)
        FIG. 7 Global Carbon Nanofibres Carbon Nanomaterials  Market, 2016-2026 (Kilo Tons)
        FIG. 8 Global Graphene Carbon Nanomaterials Market, 2016-2026 (USD Million)
        FIG. 9 Global Graphene Carbon Nanomaterials  Market, 2016-2026 (Kilo Tons)
        FIG. 10 Global Fullerenes Carbon Nanomaterials Market, 2016-2026 (USD Million)
        FIG. 11 Global Fullerenes Carbon Nanomaterials  Market, 2016-2026 (Kilo Tons)
        FIG. 12 Global Carbon Diamonds Carbon Nanomaterials Market, 2016-2026 (USD Million)
        FIG. 13 Global Carbon Diamonds Carbon Nanomaterials  Market, 2016-2026 (Kilo Tons)
        FIG. 14 Global Carbon Nanomaterials Market Share, by Application, 2018 & 2025 (USD Million)
        FIG. 15 Global Carbon Nanomaterials Market share, by Application, 2018 & 2025 (Kilo Tons)
        FIG. 16 Global Automotive Carbon Nanomaterials Market, 2016-2026 (USD Million)
        FIG. 17 Global Automotive Carbon Nanomaterials  Market, 2016-2026 (Kilo Tons)
        FIG. 18 Global Aerospace & Defence Carbon Nanomaterials Market, 2016-2026 (USD Million)
        FIG. 19 Global Aerospace & Defence Carbon Nanomaterials  Market, 2016-2026 (Kilo Tons)
        FIG. 20 Global Medical Carbon Nanomaterials Market, 2016-2026 (USD Million)
        FIG. 21 Global Medical Carbon Nanomaterials  Market, 2016-2026 (Kilo Tons)
        FIG. 22 Global Electronics & Energy Carbon Nanomaterials Market, 2016-2026 (USD Million)
        FIG. 23 Global Electronics & Energy Carbon Nanomaterials  Market, 2016-2026 (Kilo Tons)
        FIG. 24 Global Others Carbon Nanomaterials Market, 2016-2026 (USD Million)
        FIG. 25 Global Others Carbon Nanomaterials  Market, 2016-2026 (Kilo Tons)
        FIG. 26 Global Carbon Nanomaterials Market Share, by Region, 2018 & 2025
        FIG. 27 Global Carbon Nanomaterials Market Share, by Region, 2018 & 2025
        FIG. 28 North America Carbon Nanomaterials Market, 2016-2026
        FIG. 29 North America Carbon Nanomaterials  Market, 2016-2026 (Kilo Tons)
        FIG. 30 U.S. Carbon Nanomaterials Market, 2016-2026
        FIG. 31 U.S. Carbon Nanomaterials  Market, 2016-2026 (Kilo Tons)
        FIG. 32 Canada Carbon Nanomaterials Market, 2016-2026
        FIG. 33 Canada Carbon Nanomaterials  Market, 2016-2026 (Kilo Tons)
        FIG. 34 Europe Carbon Nanomaterials Market, 2016-2026
        FIG. 35 Europe Carbon Nanomaterials  Market, 2016-2026 (Kilo Tons)
        FIG. 36 Germany Carbon Nanomaterials Market, 2016-2026
        FIG. 37 Germany Carbon Nanomaterials  Market, 2016-2026 (Kilo Tons)
        FIG. 38 France Carbon Nanomaterials Market, 2016-2026
        FIG. 39 France Carbon Nanomaterials  Market, 2016-2026 (Kilo Tons)
        FIG. 40 U.K. Carbon Nanomaterials Market, 2016-2026
        FIG. 41 U.K. Carbon Nanomaterials  Market, 2016-2026 (Kilo Tons)
        FIG. 42 Italy Carbon Nanomaterials Market, 2016-2026
        FIG. 43 Italy Carbon Nanomaterials  Market, 2016-2026 (Kilo Tons)
        FIG. 44 Spain Carbon Nanomaterials Market, 2016-2026
        FIG. 45 Spain Carbon Nanomaterials  Market, 2016-2026 (Kilo Tons)
        FIG. 46 Rest of Europe Carbon Nanomaterials Market, 2016-2026
        FIG. 47 Rest of Europe Carbon Nanomaterials  Market, 2016-2026 (Kilo Tons)
        FIG. 48 Asia Pacific Carbon Nanomaterials Market, 2016-2026
        FIG. 49 Asia Pacific Carbon Nanomaterials  Market, 2016-2026 (Kilo Tons)
        FIG. 50 China Carbon Nanomaterials Market, 2016-2026
        FIG. 51 China Carbon Nanomaterials  Market, 2016-2026 (Kilo Tons)
        FIG. 52 Japan Carbon Nanomaterials Market, 2016-2026
        FIG. 53 Japan Carbon Nanomaterials  Market, 2016-2026 (Kilo Tons)
        FIG. 54 India Carbon Nanomaterials Market, 2016-2026
        FIG. 55 India Carbon Nanomaterials  Market, 2016-2026 (Kilo Tons)
        FIG. 56 South  Korea Carbon Nanomaterials Market, 2016-2026
        FIG. 57 South  Korea Carbon Nanomaterials  Market, 2016-2026 (Kilo Tons)
        FIG. 58 South-East Asia Carbon Nanomaterials Market, 2016-2026
        FIG. 59 South-East Asia Carbon Nanomaterials  Market, 2016-2026 (Kilo Tons)
        FIG. 60 Rest of Asia Pacific Carbon Nanomaterials Market, 2016-2026
        FIG. 61 Rest of Asia Pacific Carbon Nanomaterials  Market, 2016-2026 (Kilo Tons)
        FIG. 62 Latin America Carbon Nanomaterials Market, 2016-2026
        FIG. 63 Latin America Carbon Nanomaterials  Market, 2016-2026 (Kilo Tons)
        FIG. 64 Brazil Carbon Nanomaterials Market, 2016-2026
        FIG. 65 Brazil Carbon Nanomaterials  Market, 2016-2026 (Kilo Tons)
        FIG. 66 Mexico Carbon Nanomaterials Market, 2016-2026
        FIG. 67 Mexico Carbon Nanomaterials  Market, 2016-2026 (Kilo Tons)
        FIG. 68 Rest of Latin America Carbon Nanomaterials Market, 2016-2026
        FIG. 69 Rest of Latin America Carbon Nanomaterials  Market, 2016-2026 (Kilo Tons)
        FIG. 70 The Middle-East and Africa Carbon Nanomaterials Market, 2016-2026
        FIG. 71 The Middle-East and Africa Carbon Nanomaterials  Market, 2016-2026 (Kilo Tons)
        FIG. 72 GCC Countries Carbon Nanomaterials Market, 2016-2026
        FIG. 73 GCC Countries Carbon Nanomaterials  Market, 2016-2026 (Kilo Tons)
        FIG. 74 South Africa Carbon Nanomaterials Market, 2016-2026
        FIG. 75 South Africa Carbon Nanomaterials  Market, 2016-2026 (Kilo Tons)
        FIG. 76 Rest of Middle-East Africa Carbon Nanomaterials Market, 2016-2026
        FIG. 77 Rest of Middle-East Africa Carbon Nanomaterials  Market, 2016-2026 (Kilo Tons)
        FIG. 78 Global Carbon Nanomaterials production and revenue, 2015-2025 (USD Million) (Kilo Tons)
        FIG. 79 North America Carbon Nanomaterials production and revenue, 2015-2025 (USD Million) (Kilo Tons)
        FIG. 80 Europe Carbon Nanomaterials production and revenue, 2015-2025 (USD Million) (Kilo Tons)
        FIG. 81 Asia Pacific Carbon Nanomaterials production and revenue, 2015-2025 (USD Million) (Kilo Tons)
        FIG. 82 Latin America Carbon Nanomaterials production and revenue, 2015-2025 (USD Million) (Kilo Tons)
        FIG. 83 Middle East and Africa Carbon Nanomaterials production and revenue, 2015-2025 (USD Million) (Kilo Tons)
        FIG. 84 Competitor Market Share – Revenue
        FIG. 85 Competitor Market Share – Volume
        FIG. 86 E. I. du Pont de Nemours and Company Revenue and Growth Rate
        FIG. 87 E. I. du Pont de Nemours and Company Market Share
        FIG. 88 Ahlstrom Revenue and Growth Rate
        FIG. 89 Ahlstrom Market Share
        FIG. 90 Hyperion Catalysis International Inc Revenue and Growth Rate
        FIG. 91 Hyperion Catalysis International Inc Market Share
        FIG. 92 Hollingsworth & Vose Revenue and Growth Rate
        FIG. 93 Hollingsworth & Vose Market Share
        FIG. 94 Bayer AG Revenue and Growth Rate
        FIG. 95 Bayer AG Market Share
        FIG. 96 Arkema Revenue and Growth Rate
        FIG. 97 Arkema Market Share
        FIG. 98 CNano Technology Ltd Revenue and Growth Rate
        FIG. 99 CNano Technology Ltd Market Share
        FIG. 100 Kuraray Co. Ltd Revenue and Growth Rate
        FIG. 101 Kuraray Co. Ltd Market Share
        FIG. 102 Showa Denko Revenue and Growth Rate
        FIG. 103 Showa Denko Market Share
        FIG. 104 Continental Carbon Company Revenue and Growth Rate
        FIG. 105 Continental Carbon Company Market Share
        FIG. 106 Finetex Revenue and Growth Rate
        FIG. 107 Finetex Market Share
        FIG. 108 Elmarco Revenue and Growth Rate
        FIG. 109 Elmarco Market Share
        FIG. 110 Nanocyl SA Revenue and Growth Rate
        FIG. 111 Nanocyl SA Market Share
        FIG. 112 Others Revenue and Growth Rate
        FIG. 113 Others Market Share
        FIG. 114 Market Dynamics
        FIG. 115 Global Carbon Nanomaterials – Value Chain Analysis
        FIG. 116 Key Mandates and Regulations
        FIG. 117 Technology Roadmap and Timeline
        FIG. 118 Market Attractiveness Analysis – By Type
        FIG. 119 Market Attractiveness Analysis – By Application
        FIG. 120 Market Attractiveness Analysis – By Region
        FIG. 121 Manufacturing Cost Structure of Carbon Nanomaterials
        FIG. 122 Carbon Nanomaterials Industrial Chain Analysis
        FIG. 123 Market Channel
        FIG. 124 Marketing Channel Development Trend
        FIG. 125 Growth in World Gross Product, 2008-2018

        List of Tables

        TABLE 1 Global Carbon Nanomaterials market, 2018 & 2025 (USD Million)
        TABLE 2 Global Carbon Nanomaterials market, by Type, 2016-2026 (USD Million)
        TABLE 3 Global Carbon Nanomaterials market, by Type, 2016-2026 (Kilo Tons)
        TABLE 4 Global Carbon Nanomaterials market, by Application, 2016-2026 (USD Million)
        TABLE 5 Global Carbon Nanomaterials market, by Application, 2016-2026 (Kilo Tons)
        TABLE 6 Global Carbon Nanomaterials market, by region, 2016-2026 (USD Million)
        TABLE 7 Global Carbon Nanomaterials market, by region, 2016-2026 (Kilo Tons)
        TABLE 8 North America Carbon Nanomaterials Market, by Type, 2016-2026 (USD Million)
        TABLE 9 North America Carbon Nanomaterials Market, by Type, 2016-2026 (Kilo Tons)
        TABLE 10 North America Carbon Nanomaterials Market, by Application, 2016-2026 (USD Million)
        TABLE 11 North America Carbon Nanomaterials Market, by Application, 2016-2026 (Kilo Tons)
        TABLE 12 Europe Carbon Nanomaterials Market, by Type, 2016-2026 (USD Million)
        TABLE 13 Europe Carbon Nanomaterials Market, by Type, 2016-2026 (Kilo Tons)
        TABLE 14 Europe Carbon Nanomaterials Market, by Application, 2016-2026 (USD Million)
        TABLE 15 Europe Carbon Nanomaterials Market, by Application, 2016-2026 (Kilo Tons)
        TABLE 16 Asia Pacific Carbon Nanomaterials Market, by Type, 2016-2026 (USD Million)
        TABLE 17 Asia Pacific Carbon Nanomaterials Market, by Type, 2016-2026 (Kilo Tons)
        TABLE 18 Asia Pacific Carbon Nanomaterials Market, by Application, 2016-2026 (USD Million)
        TABLE 19 Asia Pacific Carbon Nanomaterials Market, by Application, 2016-2026 (Kilo Tons)
        TABLE 20 Latin America Carbon Nanomaterials Market, by Type, 2016-2026 (USD Million)
        TABLE 21 Latin America Carbon Nanomaterials Market, by Type, 2016-2026 (Kilo Tons)
        TABLE 22 Latin America Carbon Nanomaterials Market, by Application, 2016-2026 (USD Million)
        TABLE 23 Latin America Carbon Nanomaterials Market, by Application, 2016-2026 (Kilo Tons)
        TABLE 24 The Middle-East and Africa Carbon Nanomaterials Market, by Type, 2016-2026 (USD Million)
        TABLE 25 The Middle-East and Africa Carbon Nanomaterials Market, by Type, 2016-2026 (Kilo Tons)
        TABLE 26 The Middle-East and Africa Carbon Nanomaterials Market, by Application, 2016-2026 (USD Million)
        TABLE 27 The Middle-East and Africa Carbon Nanomaterials Market, by Application, 2016-2026 (Kilo Tons)
        TABLE 28 North America Carbon Nanomaterials Production, Consumption, Export, Import, 2016-2019
        TABLE 29 Europe Carbon Nanomaterials Production, Consumption, Export, Import, 2016-2019
        TABLE 30 Asia Pacific Carbon Nanomaterials Production, Consumption, Export, Import, 2016-2019
        TABLE 31 Latin America Carbon Nanomaterials Production, Consumption, Export, Import, 2016-2019
        TABLE 32 Middle East & Africa Carbon Nanomaterials Production, Consumption, Export, Import, 2016-2019
        TABLE 33 Global Carbon Nanomaterials Market - Company Revenue Analysis 2016-2019 (USD Million)
        TABLE 34 Global Carbon Nanomaterials Market - Company Revenue Share Analysis 2016-2019(%)
        TABLE 35 Global Carbon Nanomaterials Market - Company Volume Analysis 2016-2019 (Kilo Tons)
        TABLE 36 Global Carbon Nanomaterials Market - Company Volume Share Analysis 2016-2019(%)
        TABLE 37 Acquisitions and Mergers
        TABLE 38 New Product/Service Launch
        TABLE 39 Research & Development Activities
        TABLE 40 Market Drivers
        TABLE 41 Market Restraints
        TABLE 42 Market Opportunities
        TABLE 43 Production Base and Market Concentration Rate of Raw Material
        TABLE 44 Key Suppliers of Raw Materials
        TABLE 45 Raw Materials Sources of Carbon Nanomaterials Major Manufacturers in 2016
        TABLE 46 Major Buyers of Carbon Nanomaterials
        TABLE 47 Distributors/Traders of Carbon Nanomaterials by Region
        

Industry Major Market Players

  • E. I. du Pont de Nemours and Company
  • Ahlstrom
  • Hyperion Catalysis International Inc
  • Hollingsworth &Vose
  • Bayer AG
  • Arkema
  • CNano Technology Ltd
  • Kuraray Co. Ltd
  • Showa Denko
  • Continental Carbon Company
  • Finetex
  • Elmarco
  • Nanocyl SA