Search Market Research Report

Discover Our Latest Reports
Discover Our Featured Reports
Discover Top Selling Reports

Carbon Dioxide Market Size, Share Global Analysis Report, 2020–2026

report img

Carbon Dioxide Market By Source (Hydrogen, Ethyl Alcohol, Ethylene Oxide, Substitute Natural Gas, and Others), and By Application (Food & Beverages, Oil & Gas, Medical, Rubber, Fire Fighting, and Others): Global Industry Outlook, Market Size, Business Intelligence, Consumer Preferences, Statistical Surveys, Comprehensive Analysis, Historical Developments, Current Trends, and Forecast 2020–2026

Industry Insights

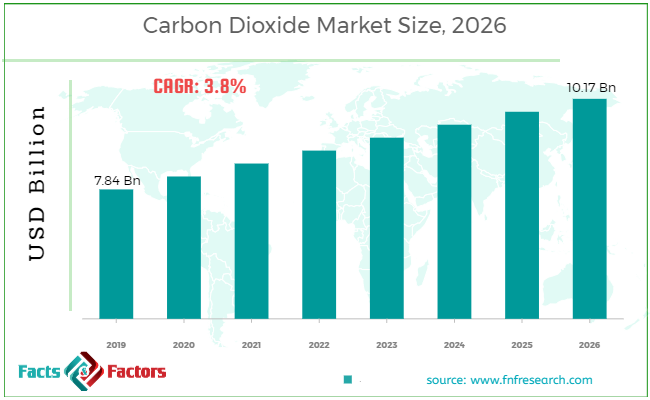
[174+ Pages Report] According to the report published by Facts Factors, the global carbon dioxide market size was worth around USD 7.84 billion in 2019 and is predicted to grow to around USD 10.17 billion by 2026 with a compound annual growth rate (CAGR) of roughly 3.8% between 2020 and 2026. The report analyzes the global carbon dioxide market drivers, restraints/challenges, and the effect they have on the demands during the projection period. In addition, the report explores emerging opportunities in the carbon dioxide market.

This specialized and expertise oriented industry research report scrutinizes the technical and commercial business outlook of the carbon dioxide industry. The report analyzes and declares the historical and current trends analysis of the carbon dioxide industry and subsequently recommends the projected trends anticipated to be observed in the carbon dioxide market during the upcoming years.

Carbon Dioxide Market Size

To know more about this report | Request Free Sample Copy

The carbon dioxide market report analyzes and notifies the industry statistics at the global as well as regional and country levels in order to acquire a thorough perspective of the entire carbon dioxide market. The historical and past insights are provided for FY 2016 to FY 2019 whereas projected trends are delivered for FY 2020 to FY 2026. The quantitative and numerical data is represented in terms of both volume (Kilo Tons) and value (USD Million) from FY 2016 – 2026.


logoKey Insights from Primary Research

  • As per our primary respondents, the carbon dioxide market is set to grow annually at a rate of around 3.8%
  • It was established through primary research that the carbon dioxide market was valued at around USD 7.84 billion in 2019
  • North America held the largest market share of carbon dioxide in terms of revenue in 2019
  • The “Hydrogen” category, on the basis of source segmentation, was the leading revenue-generating category in 2019
  • The “Food & Beverages” category, on the basis of application segmentation, was the leading revenue-generating category in 2019

logoKey Recommendations from Analysts

  • As per our analysts, utilization of carbon dioxide as a ‘cryogenic food grade gas’ in food processing applications is expected to drive the market
  • Carbon dioxide usage is highly likely to offer potential benefits for Enhanced Oil Recovery (EOH) in the oil and gas industry, underpinning the growth of CO2 market
  • Carbon dioxide is used during manufacturing of Precipitated Calcium Carbonate (PCC), in a bid to establish a uniformity in the particle size distribution
  • Substitute Natural Gas (SNG) is anticipated to be the fastest growing source over the forecast period
  • The medical segment is also among the fastest-growing application segments

The quantitative data is further underlined and reinforced by comprehensive qualitative data which comprises various across-the-board market dynamics. The rationales which directly or indirectly impact the carbon dioxide industry are exemplified through parameters such as growth drivers, restraints, challenges, and opportunities among other impacting factors.

Throughout our research report, we have encompassed all the proven models and tools of industry analysis and extensively illustrated all the key business strategies and business models adopted in the carbon dioxide industry. The report provides an all-inclusive and detailed competitive landscape prevalent in the carbon dioxide market.

The report utilizes established industry analysis tools and models such as Porter’s Five Forces framework to analyze and recognize critical business strategies adopted by various stakeholders involved in the entire value chain of the carbon dioxide industry. The carbon dioxide market report additionally employs SWOT analysis and PESTLE analysis models for further in-depth analysis.

The report study further includes an in-depth analysis of industry players' market shares and provides an overview of leading players' market position in the carbon dioxide sector. Key strategic developments in the carbon dioxide market competitive landscape such as acquisitions & mergers, inaugurations of different products and services, partnerships & joint ventures, MoU agreements, VC & funding activities, R&D activities, and geographic expansion among other noteworthy activities by key players of the carbon dioxide market are appropriately highlighted in the report.

Carbon dioxide is used in numerous applications, such as inert gas in fire-fighting, EOR, carbonation of beverages, and freezing and cooling food products. Increased investments in R&D for advanced technologies in EOR and Carbon Capture and Storage (CCS), have led to an increase in the demand for CO2, which in turn is anticipated to fuel the market growth in the forthcoming years.

logoReport Scope

Report Attribute

Details

Market Size in 2019

USD 7.84 Billion

Projected Market Size in 2026

USD 10.17 Billion

CAGR Growth Rate

3.8% CAGR

Base Year

2019

Forecast Years

2020-2026

Key Market Players

The Linde Group, INOX Air Products Ltd., Continental Carbonic Products, Inc., Praxair, Inc., Matheson Tri-Gas, Inc., Sicgil India Limited, Air Products and Chemicals, Inc., Universal Industrial Gases, Inc., Airgas, Inc., Air Liquide International S.A., Gulf Cryo, Bristol Gases – Concorde Corodex Group, Dubai Industrial Gases, National Industrial Gas Plants-Mohammed Hamad Al Mana Group, and Others

Key Segment

By Source, Application, and Region

Major Regions Covered

North America, Europe, Asia Pacific, Latin America, and the Middle East & Africa

Purchase Options

Request customized purchase options to meet your research needs. Explore purchase options

The carbon dioxide market research report delivers an acute valuation and taxonomy of the carbon dioxide industry by practically splitting the market on the basis of different sources, applications, and regions. Through the analysis of the historical and projected trends, all the segments and sub-segments were evaluated through the bottom-up approach, and different market sizes have been projected for FY 2020 to FY 2026. The regional segmentation of the carbon dioxide industry includes the complete classification of all the major continents including North America, Latin America, Europe, Asia Pacific, and Middle East & Africa. Further, country-wise data for the carbon dioxide industry is provided for the leading economies of the world.

The carbon dioxide market is segmented based on source and application. On the basis of source segmentation, the market is classified into hydrogen, ethyl alcohol, ethylene oxide, substitute natural gas, and others. In terms of application segmentation, the market is bifurcated into food & beverages, oil & gas, medical, rubber, fire fighting, and others.

logoSome of the essential players operating in the carbon dioxide market, but not restricted to include

  • The Linde Group
  •  INOX Air Products Ltd.
  •  Continental Carbonic Products  Inc.
  •  Praxair  Inc.
  •  Matheson Tri-Gas  Inc.
  •  Sicgil India Limited
  •  Air Products and Chemicals  Inc.
  •  Universal Industrial Gases  Inc.
  •  Airgas Inc.
  •  Air Liquide International S.A.
  •  Gulf Cryo
  •  Bristol Gases – Concorde Corodex Group
  •  Dubai Industrial Gases
  •  National Industrial Gas Plants-Mohammed Hamad Al Mana Group

The taxonomy of the carbon dioxide industry by its scope and segmentation is as follows:

logo By Source Segmentation Analysis (Customizable)

  • Hydrogen
  • Ethyl Alcohol
  • Ethylene Oxide
  • Substitute Natural Gas
  • Others

logo By Application Segmentation Analysis (Customizable)

  • Food & Beverages
  • Oil & Gas
  • Medical
  • Rubber
  • Fire Fighting
  • Others

logo Regional Segmentation Analysis (Customizable)

  • North America
    • The U.S.
    • Canada
  • Europe
    • Germany
    • The UK
    • France
    • Spain
    • Italy
    • Rest of Europe
  • Asia Pacific
    • China
    • Japan
    • India
    • South Korea
    • Southeast Asia
    • Rest of Asia Pacific
  • Latin America
    • Brazil
    • Mexico
    • Rest of Latin America
  • Middle East & Africa
    • GCC
    • South Africa
    • Rest of Middle East & Africa

Table of Content

  1. CHAPTER 1. Executive Summary
  2. CHAPTER 2. Carbon Dioxide market – Source Analysis
    1. 2.1. Global Carbon Dioxide Market – Source Overview
    2. 2.2. Global Carbon Dioxide Market Share, by Source, 2019 & 2026 (USD Million)
    3. 2.3. Global Carbon Dioxide Market share, by Source, 2019 & 2026 (Kilo Tons)
    4. 2.4. Hydrogen
      1. 2.4.1. Global Hydrogen Carbon Dioxide Market, 2016-2026 (USD Million)
      2. 2.4.2. Global Hydrogen Carbon Dioxide Market, 2016-2026 (Kilo Tons)
    5. 2.5. Ethyl Alcohol
      1. 2.5.1. Global Ethyl Alcohol Carbon Dioxide Market, 2016-2026 (USD Million)
      2. 2.5.2. Global Ethyl Alcohol Carbon Dioxide Market, 2016-2026 (Kilo Tons)
    6. 2.6. Ethylene Oxide
      1. 2.6.1. Global Ethylene Oxide Carbon Dioxide Market, 2016-2026 (USD Million)
      2. 2.6.2. Global Ethylene Oxide Carbon Dioxide Market, 2016-2026 (Kilo Tons)
    7. 2.7. Substitute Natural Gas
      1. 2.7.1. Global Substitute Natural Gas Carbon Dioxide Market, 2016-2026 (USD Million)
      2. 2.7.2. Global Substitute Natural Gas Carbon Dioxide Market, 2016-2026 (Kilo Tons)
    8. 2.8. Others
      1. 2.8.1. Global Others Carbon Dioxide Market, 2016-2026 (USD Million)
      2. 2.8.2. Global Others Carbon Dioxide Market, 2016-2026 (Kilo Tons)
  3. CHAPTER 3. Carbon Dioxide market – Application Analysis
    1. 3.1. Global Carbon Dioxide Market – Application Overview
    2. 3.2. Global Carbon Dioxide Market Share, by Application, 2019 & 2026 (USD Million)
    3. 3.3. Global Carbon Dioxide Market share, by Application, 2019 & 2026 (Kilo Tons)
    4. 3.4. Food & Beverages
      1. 3.4.1. Global Food & Beverages Carbon Dioxide Market, 2016-2026 (USD Million)
      2. 3.4.2. Global Food & Beverages Carbon Dioxide Market, 2016-2026 (Kilo Tons)
    5. 3.5. Oil & Gas
      1. 3.5.1. Global Oil & Gas Carbon Dioxide Market, 2016-2026 (USD Million)
      2. 3.5.2. Global Oil & Gas Carbon Dioxide Market, 2016-2026 (Kilo Tons)
    6. 3.6. Medical
      1. 3.6.1. Global Medical Carbon Dioxide Market, 2016-2026 (USD Million)
      2. 3.6.2. Global Medical Carbon Dioxide Market, 2016-2026 (Kilo Tons)
    7. 3.7. Rubber
      1. 3.7.1. Global Rubber Carbon Dioxide Market, 2016-2026 (USD Million)
      2. 3.7.2. Global Rubber Carbon Dioxide Market, 2016-2026 (Kilo Tons)
    8. 3.8. Fire Fighting
      1. 3.8.1. Global Fire Fighting Carbon Dioxide Market, 2016-2026 (USD Million)
      2. 3.8.2. Global Fire Fighting Carbon Dioxide Market, 2016-2026 (Kilo Tons)
    9. 3.9. Others
      1. 3.9.1. Global Others Carbon Dioxide Market, 2016-2026 (USD Million)
      2. 3.9.2. Global Others Carbon Dioxide Market, 2016-2026 (Kilo Tons)
  4. CHAPTER 4. Carbon Dioxide market – Regional Analysis
    1. 4.1. Global Carbon Dioxide Market Regional Overview
    2. 4.2. Global Carbon Dioxide Market Share, by Region, 2019 & 2026 (Value)
    3. 4.3. Global Carbon Dioxide Market Share, by Region, 2019 & 2026 (Volume)
    4. 4.4. North America
      1. 4.4.1. North America Carbon Dioxide Market size and forecast, 2016-2026
      2. 4.4.2. North America Carbon Dioxide Market, by Country, 2019 - 2026 (USD Million)
      3. 4.4.3. North America Market size and forecast, 2016-2026 (Kilo Tons)
      4. 4.4.4. North America Carbon Dioxide Market, by Country, 2019 - 2026 (Kilo Tons)
      5. 4.4.5. North America Carbon Dioxide Market, by Source, 2016-2026
        1. 4.4.5.1. North America Carbon Dioxide Market, by Source, 2016-2026 (USD Million)
        2. 4.4.5.2. North America Carbon Dioxide Market, by Source, 2016-2026 (Kilo Tons)
      6. 4.4.6. North America Carbon Dioxide Market, by Application, 2016-2026
        1. 4.4.6.1. North America Carbon Dioxide Market, by Application, 2016-2026 (USD Million)
        2. 4.4.6.2. North America Carbon Dioxide Market, by Application, 2016-2026 (Kilo Tons)
      7. 4.4.7. U.S.
        1. 4.4.7.1. U.S. Market size and forecast, 2016-2026 (USD Million)
        2. 4.4.7.2. U.S. Market size and forecast, 2016-2026 (Kilo Tons)
      8. 4.4.8. Canada
        1. 4.4.8.1. Canada Market size and forecast, 2016-2026 (USD Million)
        2. 4.4.8.2. Canada Market size and forecast, 2016-2026 (Kilo Tons)
    5. 4.5. Europe
      1. 4.5.1. Europe Carbon Dioxide Market size and forecast, 2016-2026
      2. 4.5.2. Europe Carbon Dioxide Market, by Country, 2019 - 2026 (USD Million)
      3. 4.5.3. Europe Market size and forecast, 2016-2026 (Kilo Tons)
      4. 4.5.4. Europe Carbon Dioxide Market, by Country, 2019 - 2026 (Kilo Tons)
      5. 4.5.5. Europe Carbon Dioxide Market, by Source, 2016-2026
        1. 4.5.5.1. Europe Carbon Dioxide Market, by Source, 2016-2026 (USD Million)
        2. 4.5.5.2. Europe Carbon Dioxide Market, by Source, 2016-2026 (Kilo Tons)
      6. 4.5.6. Europe Carbon Dioxide Market, by Application, 2016-2026
        1. 4.5.6.1. Europe Carbon Dioxide Market, by Application, 2016-2026 (USD Million)
        2. 4.5.6.2. Europe Carbon Dioxide Market, by Application, 2016-2026 (Kilo Tons)
      7. 4.5.7. Germany
        1. 4.5.7.1. Germany Market size and forecast, 2016-2026 (USD Million)
        2. 4.5.7.2. Germany Market size and forecast, 2016-2026 (Kilo Tons)
      8. 4.5.8. France
        1. 4.5.8.1. France Market size and forecast, 2016-2026 (USD Million)
        2. 4.5.8.2. France Market size and forecast, 2016-2026 (Kilo Tons)
      9. 4.5.9. U.K.
        1. 4.5.9.1. U.K. Market size and forecast, 2016-2026 (USD Million)
        2. 4.5.9.2. U.K. Market size and forecast, 2016-2026 (Kilo Tons)
      10. 4.5.10. Italy
        1. 4.5.10.1. Italy Market size and forecast, 2016-2026 (USD Million)
        2. 4.5.10.2. Italy Market size and forecast, 2016-2026 (Kilo Tons)
      11. 4.5.11. Spain
        1. 4.5.11.1. Spain Market size and forecast, 2016-2026 (USD Million)
        2. 4.5.11.2. Spain Market size and forecast, 2016-2026 (Kilo Tons)
      12. 4.5.12. Rest of Europe
        1. 4.5.12.1. Rest of Europe Market size and forecast, 2016-2026 (USD Million)
        2. 4.5.12.2. Rest of Europe Market size and forecast, 2016-2026 (Kilo Tons)
    6. 4.6. Asia Pacific
      1. 4.6.1. Asia Pacific Carbon Dioxide Market size and forecast, 2016-2026
      2. 4.6.2. Asia Pacific Carbon Dioxide Market, by Country, 2019 - 2026 (USD Million)
      3. 4.6.3. Asia Pacific Market size and forecast, 2016-2026 (Kilo Tons)
      4. 4.6.4. Asia Pacific Carbon Dioxide Market, by Country, 2019 - 2026 (Kilo Tons)
      5. 4.6.5. Asia Pacific Carbon Dioxide Market, by Source, 2016-2026
        1. 4.6.5.1. Asia Pacific Carbon Dioxide Market, by Source, 2016-2026 (USD Million)
        2. 4.6.5.2. Asia Pacific Carbon Dioxide Market, by Source, 2016-2026 (Kilo Tons)
      6. 4.6.6. Asia Pacific Carbon Dioxide Market, by Application, 2016-2026
        1. 4.6.6.1. Asia Pacific Carbon Dioxide Market, by Application, 2016-2026 (USD Million)
        2. 4.6.6.2. Asia Pacific Carbon Dioxide Market, by Application, 2016-2026 (Kilo Tons)
      7. 4.6.7. China
        1. 4.6.7.1. China Market size and forecast, 2016-2026 (USD Million)
        2. 4.6.7.2. China Market size and forecast, 2016-2026 (Kilo Tons)
      8. 4.6.8. Japan
        1. 4.6.8.1. Japan Market size and forecast, 2016-2026 (USD Million)
        2. 4.6.8.2. Japan Market size and forecast, 2016-2026 (Kilo Tons)
      9. 4.6.9. India
        1. 4.6.9.1. India Market size and forecast, 2016-2026 (USD Million)
        2. 4.6.9.2. India Market size and forecast, 2016-2026 (Kilo Tons)
      10. 4.6.10. South Korea
        1. 4.6.10.1. South Korea Market size and forecast, 2016-2026 (USD Million)
        2. 4.6.10.2. South Korea Market size and forecast, 2016-2026 (Kilo Tons)
      11. 4.6.11. South-East Asia
        1. 4.6.11.1. South-East Asia Market size and forecast, 2016-2026 (USD Million)
        2. 4.6.11.2. South-East Asia Market size and forecast, 2016-2026 (Kilo Tons)
      12. 4.6.12. Rest of Asia Pacific
        1. 4.6.12.1. Rest of Asia Pacific Market size and forecast, 2016-2026 (USD Million)
        2. 4.6.12.2. Rest of Asia Pacific Market size and forecast, 2016-2026 (Kilo Tons)
    7. 4.7. Latin America
      1. 4.7.1. Latin America Carbon Dioxide Market size and forecast, 2016-2026
      2. 4.7.2. Latin America Carbon Dioxide Market, by Country, 2019 - 2026 (USD Million)
      3. 4.7.3. Latin America Market size and forecast, 2016-2026 (Kilo Tons)
      4. 4.7.4. Latin America Carbon Dioxide Market, by Country, 2019 - 2026 (Kilo Tons)
      5. 4.7.5. Latin America Carbon Dioxide Market, by Source, 2016-2026
        1. 4.7.5.1. Latin America Carbon Dioxide Market, by Source, 2016-2026 (USD Million)
        2. 4.7.5.2. Latin America Carbon Dioxide Market, by Source, 2016-2026 (Kilo Tons)
      6. 4.7.6. Latin America Carbon Dioxide Market, by Application, 2016-2026
        1. 4.7.6.1. Latin America Carbon Dioxide Market, by Application, 2016-2026 (USD Million)
        2. 4.7.6.2. Latin America Carbon Dioxide Market, by Application, 2016-2026 (Kilo Tons)
      7. 4.7.7. Brazil
        1. 4.7.7.1. Brazil Market size and forecast, 2016-2026 (USD Million)
        2. 4.7.7.2. Brazil Market size and forecast, 2016-2026 (Kilo Tons)
      8. 4.7.8. Mexico
        1. 4.7.8.1. Mexico Market size and forecast, 2016-2026 (USD Million)
        2. 4.7.8.2. Mexico Market size and forecast, 2016-2026 (Kilo Tons)
      9. 4.7.9. Rest of Latin America
        1. 4.7.9.1. Rest of Latin America Market size and forecast, 2016-2026 (USD Million)
        2. 4.7.9.2. Rest of Latin America Market size and forecast, 2016-2026 (Kilo Tons)
    8. 4.8. The Middle-East and Africa
      1. 4.8.1. The Middle-East and Africa Carbon Dioxide Market size and forecast, 2016-2026
      2. 4.8.2. The Middle-East and Africa Carbon Dioxide Market, by Country, 2019 - 2026 (USD Million)
      3. 4.8.3. The Middle-East and Africa Market size and forecast, 2016-2026 (Kilo Tons)
      4. 4.8.4. The Middle-East and Africa Carbon Dioxide Market, by Country, 2019 - 2026 (Kilo Tons)
      5. 4.8.5. The Middle-East and Africa Carbon Dioxide Market, by Source, 2016-2026
        1. 4.8.5.1. The Middle-East and Africa Carbon Dioxide Market, by Source, 2016-2026 (USD Million)
        2. 4.8.5.2. The Middle-East and Africa Carbon Dioxide Market, by Source, 2016-2026 (Kilo Tons)
      6. 4.8.6. The Middle-East and Africa Carbon Dioxide Market, by Application, 2016-2026
        1. 4.8.6.1. The Middle-East and Africa Carbon Dioxide Market, by Application, 2016-2026 (USD Million)
        2. 4.8.6.2. The Middle-East and Africa Carbon Dioxide Market, by Application, 2016-2026 (Kilo Tons)
      7. 4.8.7. GCC Countries
        1. 4.8.7.1. GCC Countries Market size and forecast, 2016-2026 (USD Million)
        2. 4.8.7.2. GCC Countries Market size and forecast, 2016-2026 (Kilo Tons)
      8. 4.8.8. South Africa
        1. 4.8.8.1. South Africa Market size and forecast, 2016-2026 (USD Million)
        2. 4.8.8.2. South Africa Market size and forecast, 2016-2026 (Kilo Tons)
      9. 4.8.9. Rest of Middle-East Africa
        1. 4.8.9.1. Rest of Middle-East Africa Market size and forecast, 2016-2026 (USD Million)
        2. 4.8.9.2. Rest of Middle-East Africa Market size and forecast, 2016-2026 (Kilo Tons)
  5. CHAPTER 5. Carbon Dioxide Production, Consumption, Export, Import by Regions
    1. 5.1. Global Carbon Dioxide production and revenue, 2016-2026 (USD Million) (Kilo Tons)
    2. 5.2. Global Import and Export Analysis, by Region
  6. CHAPTER 6. Carbon Dioxide market – Competitive Landscape
    1. 6.1. Competitor Market Share – Revenue
    2. 6.2. Market Concentration Rate Analysis, Top 3 and Top 5 Players
    3. 6.3. Competitor Market Share – Volume
    4. 6.4. Strategic Development
      1. 6.4.1. Acquisitions and Mergers
      2. 6.4.2. New Products
      3. 6.4.3. Research & Development Activities
  7. CHAPTER 7. Company Profiles
    1. 7.1. The Linde Group
      1. 7.1.1. Company Overview
      2. 7.1.2. The Linde Group Sales, Revenue, Price, and Gross Margin
      3. 7.1.3. Product portfolio
      4. 7.1.4. Recent initiatives
    2. 7.2. INOX Air Products Ltd.
      1. 7.2.1. Company Overview
      2. 7.2.2. INOX Air Products Ltd. Sales, Revenue, Price, and Gross Margin
      3. 7.2.3. Product portfolio
      4. 7.2.4. Recent initiatives
    3. 7.3. Continental Carbonic Products, Inc.
      1. 7.3.1. Company Overview
      2. 7.3.2. Continental Carbonic Products, Inc. Sales, Revenue, Price, and Gross Margin
      3. 7.3.3. Product portfolio
      4. 7.3.4. Recent initiatives
    4. 7.4. Matheson Tri-Gas, Inc.
      1. 7.4.1. Company Overview
      2. 7.4.2. Matheson Tri-Gas, Inc. Sales, Revenue, Price, and Gross Margin
      3. 7.4.3. Product portfolio
      4. 7.4.4. Recent initiatives
    5. 7.5. Sicgil India Limited
      1. 7.5.1. Company Overview
      2. 7.5.2. Sicgil India Limited Sales, Revenue, Price, and Gross Margin
      3. 7.5.3. Product portfolio
      4. 7.5.4. Recent initiatives
    6. 7.6. Universal Industrial Gases, Inc.
      1. 7.6.1. Company Overview
      2. 7.6.2. Universal Industrial Gases, Inc. Sales, Revenue, Price, and Gross Margin
      3. 7.6.3. Product portfolio
      4. 7.6.4. Recent initiatives
    7. 7.7. Air Products and Chemicals, Inc.
      1. 7.7.1. Company Overview
      2. 7.7.2. Air Products and Chemicals, Inc. Sales, Revenue, Price, and Gross Margin
      3. 7.7.3. Product portfolio
      4. 7.7.4. Recent initiatives
    8. 7.8. Airgas, Inc.
      1. 7.8.1. Company Overview
      2. 7.8.2. Airgas, Inc. Sales, Revenue, Price, and Gross Margin
      3. 7.8.3. Product portfolio
      4. 7.8.4. Recent initiatives
    9. 7.9. Praxair, Inc.
      1. 7.9.1. Company Overview
      2. 7.9.2. Praxair, Inc. Sales, Revenue, Price, and Gross Margin
      3. 7.9.3. Product portfolio
      4. 7.9.4. Recent initiatives
    10. 7.10. Air Liquide International S.A.
      1. 7.10.1. Company Overview
      2. 7.10.2. Air Liquide International S.A. Sales, Revenue, Price, and Gross Margin
      3. 7.10.3. Product portfolio
      4. 7.10.4. Recent initiatives
    11. 7.11. Gulf Cryo
      1. 7.11.1. Company Overview
      2. 7.11.2. Gulf Cryo Sales, Revenue, Price, and Gross Margin
      3. 7.11.3. Product portfolio
      4. 7.11.4. Recent initiatives
    12. 7.12. Bristol Gases – Concorde Corodex Group
      1. 7.12.1. Company Overview
      2. 7.12.2. Bristol Gases – Concorde Corodex Group Sales, Revenue, Price, and Gross Margin
      3. 7.12.3. Product portfolio
      4. 7.12.4. Recent initiatives
    13. 7.13. Dubai Industrial Gases
      1. 7.13.1. Company Overview
      2. 7.13.2. Dubai Industrial Gases Sales, Revenue, Price, and Gross Margin
      3. 7.13.3. Product portfolio
      4. 7.13.4. Recent initiatives
    14. 7.14. National Industrial Gas Plants-Mohammed Hamad Al Mana Group
      1. 7.14.1. Company Overview
      2. 7.14.2. National Industrial Gas Plants-Mohammed Hamad Al Mana Group Sales, Revenue, Price, and Gross Margin
      3. 7.14.3. Product portfolio
      4. 7.14.4. Recent initiatives
  8. CHAPTER 8. Carbon Dioxide — Industry Analysis
    1. 8.1. Introduction and Taxonomy
    2. 8.2. Carbon Dioxide Market – Key Trends
      1. 8.2.1. Market Drivers
      2. 8.2.2. Market Restraints
      3. 8.2.3. Market Opportunities
    3. 8.3. Value Chain Analysis
    4. 8.4. Key Mandates and Regulations
    5. 8.5. Technology Roadmap and Timeline
    6. 8.6. Carbon Dioxide market – Attractiveness Analysis
      1. 8.6.1. By Source
      2. 8.6.2. By Application
      3. 8.6.3. By Region
  9. CHAPTER 9. Raw Material analysis
    1. 9.1. Carbon Dioxide Key Raw Material Analysis
      1. 9.1.1. Key Raw Materials
      2. 9.1.2. Price Trend of Key Raw Materials
    2. 9.2. Key Suppliers of Raw Materials
    3. 9.3. Proportion of Manufacturing Cost Structure
      1. 9.3.1. Raw Materials
      2. 9.3.2. Labor Cost
    4. 9.4. Manufacturing Expenses Analysis of Carbon Dioxide
  10. CHAPTER 10. Industrial Chain, Sourcing Strategy and Downstream Buyers
    1. 10.1. Carbon Dioxide Industrial Chain Analysis
    2. 10.2. Upstream Raw Materials Sourcing
      1. 10.2.1. Risk Mitigation:
      2. 10.2.2. Supplier Relationships:
      3. 10.2.3. Business Processes:
      4. 10.2.4. Securing the Product:
    3. 10.3. Raw Materials Sources of Carbon Dioxide Major Manufacturers in 2016
    4. 10.4. Downstream Buyers
    5. 10.5. Distributors/Traders List
  11. CHAPTER 11. Marketing Strategy Analysis, Distributors
    1. 11.1. Marketing Channel
    2. 11.2. Direct Marketing
    3. 11.3. Indirect Marketing
    4. 11.4. Marketing Channel Development Trend
    5. 11.5. Economic/Political Environmental Change
  12. CHAPTER 12. Report Conclusion
  13. CHAPTER 13. Research Approach & Methodology
    1. 13.1. Report Description
    2. 13.2. Research Scope
    3. 13.3. Research Methodology
      1. 13.3.1. Secondary Research
      2. 13.3.2. Primary Research
      3. 13.3.3. Models
        1. 13.3.3.1. Company Share Analysis Model
        2. 13.3.3.2. Revenue Based Modeling
        3. 13.3.3.3. Research Limitations

  • List of Figures

    FIG. 1 Global Carbon Dioxide Market, 2016-2026 (USD Million)
    FIG. 2 Global Carbon Dioxide Market Share, by Source, 2019 & 2026 (USD Million)
    FIG. 3 Global Carbon Dioxide Market share, by Source, 2019 & 2026 (Kilo Tons)
    FIG. 4 Global Hydrogen Carbon Dioxide Market, 2016-2026 (USD Million)
    FIG. 5 Global Hydrogen Carbon Dioxide  Market, 2016-2026 (Kilo Tons)
    FIG. 6 Global Ethyl Alcohol Carbon Dioxide Market, 2016-2026 (USD Million)
    FIG. 7 Global Ethyl Alcohol Carbon Dioxide  Market, 2016-2026 (Kilo Tons)
    FIG. 8 Global Ethylene Oxide Carbon Dioxide Market, 2016-2026 (USD Million)
    FIG. 9 Global Ethylene Oxide Carbon Dioxide  Market, 2016-2026 (Kilo Tons)
    FIG. 10 Global Substitute Natural Gas Carbon Dioxide Market, 2016-2026 (USD Million)
    FIG. 11 Global Substitute Natural Gas Carbon Dioxide  Market, 2016-2026 (Kilo Tons)
    FIG. 12 Global Others Carbon Dioxide Market, 2016-2026 (USD Million)
    FIG. 13 Global Others Carbon Dioxide  Market, 2016-2026 (Kilo Tons)
    FIG. 14 Global Carbon Dioxide Market Share, by Application, 2019 & 2026 (USD Million)
    FIG. 15 Global Carbon Dioxide Market share, by Application, 2019 & 2026 (Kilo Tons)
    FIG. 16 Global Food & Beverages Carbon Dioxide Market, 2016-2026 (USD Million)
    FIG. 17 Global Food & Beverages Carbon Dioxide  Market, 2016-2026 (Kilo Tons)
    FIG. 18 Global Oil & Gas Carbon Dioxide Market, 2016-2026 (USD Million)
    FIG. 19 Global Oil & Gas Carbon Dioxide  Market, 2016-2026 (Kilo Tons)
    FIG. 20 Global Medical Carbon Dioxide Market, 2016-2026 (USD Million)
    FIG. 21 Global Medical Carbon Dioxide  Market, 2016-2026 (Kilo Tons)
    FIG. 22 Global Rubber Carbon Dioxide Market, 2016-2026 (USD Million)
    FIG. 23 Global Rubber Carbon Dioxide  Market, 2016-2026 (Kilo Tons)
    FIG. 24 Global Fire Fighting Carbon Dioxide Market, 2016-2026 (USD Million)
    FIG. 25 Global Fire Fighting Carbon Dioxide  Market, 2016-2026 (Kilo Tons)
    FIG. 26 Global Others Carbon Dioxide Market, 2016-2026 (USD Million)
    FIG. 27 Global Others Carbon Dioxide  Market, 2016-2026 (Kilo Tons)
    FIG. 28 Global Carbon Dioxide Market Share, by Region, 2019 & 2026
    FIG. 29 Global Carbon Dioxide Market Share, by Region, 2019 & 2026
    FIG. 30 North America Carbon Dioxide Market, 2016-2026
    FIG. 31 North America Carbon Dioxide  Market, 2016-2026 (Kilo Tons)
    FIG. 32 U.S. Carbon Dioxide Market, 2016-2026
    FIG. 33 U.S. Carbon Dioxide  Market, 2016-2026 (Kilo Tons)
    FIG. 34 Canada Carbon Dioxide Market, 2016-2026
    FIG. 35 Canada Carbon Dioxide  Market, 2016-2026 (Kilo Tons)
    FIG. 36 Europe Carbon Dioxide Market, 2016-2026
    FIG. 37 Europe Carbon Dioxide  Market, 2016-2026 (Kilo Tons)
    FIG. 38 Germany Carbon Dioxide Market, 2016-2026
    FIG. 39 Germany Carbon Dioxide  Market, 2016-2026 (Kilo Tons)
    FIG. 40 France Carbon Dioxide Market, 2016-2026
    FIG. 41 France Carbon Dioxide  Market, 2016-2026 (Kilo Tons)
    FIG. 42 U.K. Carbon Dioxide Market, 2016-2026
    FIG. 43 U.K. Carbon Dioxide  Market, 2016-2026 (Kilo Tons)
    FIG. 44 Italy Carbon Dioxide Market, 2016-2026
    FIG. 45 Italy Carbon Dioxide  Market, 2016-2026 (Kilo Tons)
    FIG. 46 Spain Carbon Dioxide Market, 2016-2026
    FIG. 47 Spain Carbon Dioxide  Market, 2016-2026 (Kilo Tons)
    FIG. 48 Rest of Europe Carbon Dioxide Market, 2016-2026
    FIG. 49 Rest of Europe Carbon Dioxide  Market, 2016-2026 (Kilo Tons)
    FIG. 50 Asia Pacific Carbon Dioxide Market, 2016-2026
    FIG. 51 Asia Pacific Carbon Dioxide  Market, 2016-2026 (Kilo Tons)
    FIG. 52 China Carbon Dioxide Market, 2016-2026
    FIG. 53 China Carbon Dioxide  Market, 2016-2026 (Kilo Tons)
    FIG. 54 Japan Carbon Dioxide Market, 2016-2026
    FIG. 55 Japan Carbon Dioxide  Market, 2016-2026 (Kilo Tons)
    FIG. 56 India Carbon Dioxide Market, 2016-2026
    FIG. 57 India Carbon Dioxide  Market, 2016-2026 (Kilo Tons)
    FIG. 58 South  Korea Carbon Dioxide Market, 2016-2026
    FIG. 59 South  Korea Carbon Dioxide  Market, 2016-2026 (Kilo Tons)
    FIG. 60 South-East Asia Carbon Dioxide Market, 2016-2026
    FIG. 61 South-East Asia Carbon Dioxide  Market, 2016-2026 (Kilo Tons)
    FIG. 62 Rest of Asia Pacific Carbon Dioxide Market, 2016-2026
    FIG. 63 Rest of Asia Pacific Carbon Dioxide  Market, 2016-2026 (Kilo Tons)
    FIG. 64 Latin America Carbon Dioxide Market, 2016-2026
    FIG. 65 Latin America Carbon Dioxide  Market, 2016-2026 (Kilo Tons)
    FIG. 66 Brazil Carbon Dioxide Market, 2016-2026
    FIG. 67 Brazil Carbon Dioxide  Market, 2016-2026 (Kilo Tons)
    FIG. 68 Mexico Carbon Dioxide Market, 2016-2026
    FIG. 69 Mexico Carbon Dioxide  Market, 2016-2026 (Kilo Tons)
    FIG. 70 Rest of Latin America Carbon Dioxide Market, 2016-2026
    FIG. 71 Rest of Latin America Carbon Dioxide  Market, 2016-2026 (Kilo Tons)
    FIG. 72 The Middle-East and Africa Carbon Dioxide Market, 2016-2026
    FIG. 73 The Middle-East and Africa Carbon Dioxide  Market, 2016-2026 (Kilo Tons)
    FIG. 74 GCC Countries Carbon Dioxide Market, 2016-2026
    FIG. 75 GCC Countries Carbon Dioxide  Market, 2016-2026 (Kilo Tons)
    FIG. 76 South Africa Carbon Dioxide Market, 2016-2026
    FIG. 77 South Africa Carbon Dioxide  Market, 2016-2026 (Kilo Tons)
    FIG. 78 Rest of Middle-East Africa Carbon Dioxide Market, 2016-2026
    FIG. 79 Rest of Middle-East Africa Carbon Dioxide  Market, 2016-2026 (Kilo Tons)
    FIG. 80 Global Carbon Dioxide production and revenue, 2016-2026 (USD Million) (Kilo Tons)
    FIG. 81 North America Carbon Dioxide production and revenue, 2016-2026 (USD Million) (Kilo Tons)
    FIG. 82 Europe Carbon Dioxide production and revenue, 2016-2026 (USD Million) (Kilo Tons)
    FIG. 83 Asia Pacific Carbon Dioxide production and revenue, 2016-2026 (USD Million) (Kilo Tons)
    FIG. 84 Latin America Carbon Dioxide production and revenue, 2016-2026 (USD Million) (Kilo Tons)
    FIG. 85 Middle East and Africa Carbon Dioxide production and revenue, 2016-2026 (USD Million) (Kilo Tons)
    FIG. 86 Competitor Market Share – Revenue
    FIG. 87 Competitor Market Share – Volume
    FIG. 88 The Linde Group Revenue and Growth Rate
    FIG. 89 The Linde Group Market Share
    FIG. 90 INOX Air Products Ltd. Revenue and Growth Rate
    FIG. 91 INOX Air Products Ltd. Market Share
    FIG. 92 Continental Carbonic Products, Inc. Revenue and Growth Rate
    FIG. 93 Continental Carbonic Products, Inc. Market Share
    FIG. 94 Matheson Tri-Gas, Inc. Revenue and Growth Rate
    FIG. 95 Matheson Tri-Gas, Inc. Market Share
    FIG. 96 Sicgil India Limited Revenue and Growth Rate
    FIG. 97 Sicgil India Limited Market Share
    FIG. 98 Universal Industrial Gases, Inc. Revenue and Growth Rate
    FIG. 99 Universal Industrial Gases, Inc. Market Share
    FIG. 100 Air Products and Chemicals, Inc. Revenue and Growth Rate
    FIG. 101 Air Products and Chemicals, Inc. Market Share
    FIG. 102 Airgas, Inc. Revenue and Growth Rate
    FIG. 103 Airgas, Inc. Market Share
    FIG. 104 Praxair, Inc. Revenue and Growth Rate
    FIG. 105 Praxair, Inc. Market Share
    FIG. 106 Air Liquide International S.A. Revenue and Growth Rate
    FIG. 107 Air Liquide International S.A. Market Share
    FIG. 108 Gulf Cryo Revenue and Growth Rate
    FIG. 109 Gulf Cryo Market Share
    FIG. 110 Bristol Gases – Concorde Corodex Group Revenue and Growth Rate
    FIG. 111 Bristol Gases – Concorde Corodex Group Market Share
    FIG. 112 Dubai Industrial Gases Revenue and Growth Rate
    FIG. 113 Dubai Industrial Gases Market Share
    FIG. 114 National Industrial Gas Plants-Mohammed Hamad Al Mana Group Revenue and Growth Rate
    FIG. 115 National Industrial Gas Plants-Mohammed Hamad Al Mana Group Market Share
    FIG. 116 Market Dynamics
    FIG. 117 Global Carbon Dioxide – Value Chain Analysis
    FIG. 118 Key Mandates and Regulations
    FIG. 119 Technology Roadmap and Timeline
    FIG. 120 Market Attractiveness Analysis – By Source
    FIG. 121 Market Attractiveness Analysis – By Application
    FIG. 122 Market Attractiveness Analysis – By Region
    FIG. 123 Manufacturing Cost Structure of Carbon Dioxide
    FIG. 124 Carbon Dioxide Industrial Chain Analysis
    FIG. 125 Market Channel
    FIG. 126 Marketing Channel Development Trend
    FIG. 127 Growth in World Gross Product, 2008-2019

    List of Tables

    TABLE 1 Global Carbon Dioxide market, 2019 & 2026 (USD Million)
    TABLE 2 Global Carbon Dioxide market, by Source, 2016-2026 (USD Million)
    TABLE 3 Global Carbon Dioxide market, by Source, 2016-2026 (Kilo Tons)
    TABLE 4 Global Carbon Dioxide market, by Application, 2016-2026 (USD Million)
    TABLE 5 Global Carbon Dioxide market, by Application, 2016-2026 (Kilo Tons)
    TABLE 6 Global Carbon Dioxide market, by region, 2016-2026 (USD Million)
    TABLE 7 Global Carbon Dioxide market, by region, 2016-2026 (Kilo Tons)
    TABLE 8 North America Carbon Dioxide Market, by Source, 2016-2026 (USD Million)
    TABLE 9 North America Carbon Dioxide Market, by Source, 2016-2026 (Kilo Tons)
    TABLE 10 North America Carbon Dioxide Market, by Application, 2016-2026 (USD Million)
    TABLE 11 North America Carbon Dioxide Market, by Application, 2016-2026 (Kilo Tons)
    TABLE 12 Europe Carbon Dioxide Market, by Source, 2016-2026 (USD Million)
    TABLE 13 Europe Carbon Dioxide Market, by Source, 2016-2026 (Kilo Tons)
    TABLE 14 Europe Carbon Dioxide Market, by Application, 2016-2026 (USD Million)
    TABLE 15 Europe Carbon Dioxide Market, by Application, 2016-2026 (Kilo Tons)
    TABLE 16 Asia Pacific Carbon Dioxide Market, by Source, 2016-2026 (USD Million)
    TABLE 17 Asia Pacific Carbon Dioxide Market, by Source, 2016-2026 (Kilo Tons)
    TABLE 18 Asia Pacific Carbon Dioxide Market, by Application, 2016-2026 (USD Million)
    TABLE 19 Asia Pacific Carbon Dioxide Market, by Application, 2016-2026 (Kilo Tons)
    TABLE 20 Latin America Carbon Dioxide Market, by Source, 2016-2026 (USD Million)
    TABLE 21 Latin America Carbon Dioxide Market, by Source, 2016-2026 (Kilo Tons)
    TABLE 22 Latin America Carbon Dioxide Market, by Application, 2016-2026 (USD Million)
    TABLE 23 Latin America Carbon Dioxide Market, by Application, 2016-2026 (Kilo Tons)
    TABLE 24 The Middle-East and Africa Carbon Dioxide Market, by Source, 2016-2026 (USD Million)
    TABLE 25 The Middle-East and Africa Carbon Dioxide Market, by Source, 2016-2026 (Kilo Tons)
    TABLE 26 The Middle-East and Africa Carbon Dioxide Market, by Application, 2016-2026 (USD Million)
    TABLE 27 The Middle-East and Africa Carbon Dioxide Market, by Application, 2016-2026 (Kilo Tons)
    TABLE 28 North America Carbon Dioxide Production, Consumption, Export, Import, 2016-2019
    TABLE 29 Europe Carbon Dioxide Production, Consumption, Export, Import, 2016-2019
    TABLE 30 Asia Pacific Carbon Dioxide Production, Consumption, Export, Import, 2016-2019
    TABLE 31 Latin America Carbon Dioxide Production, Consumption, Export, Import, 2016-2019
    TABLE 32 Middle East & Africa Carbon Dioxide Production, Consumption, Export, Import, 2016-2019
    TABLE 33 Global Carbon Dioxide Market - Company Revenue Analysis 2016-2019 (USD Million)
    TABLE 34 Global Carbon Dioxide Market - Company Revenue Share Analysis 2016-2019(%)
    TABLE 35 Global Carbon Dioxide Market - Company Volume Analysis 2016-2019 (Kilo Tons)
    TABLE 36 Global Carbon Dioxide Market - Company Volume Share Analysis 2016-2019(%)
    TABLE 37 Acquisitions and Mergers
    TABLE 38 New Product/Service Launch
    TABLE 39 Research & Development Activities
    TABLE 40 Market Drivers
    TABLE 41 Market Restraints
    TABLE 42 Market Opportunities
    TABLE 43 Production Base and Market Concentration Rate of Raw Material
    TABLE 44 Key Suppliers of Raw Materials
    TABLE 45 Raw Materials Sources of Carbon Dioxide Major Manufacturers in 2016
    TABLE 46 Major Buyers of Carbon Dioxide
    TABLE 47 Distributors/Traders of Carbon Dioxide by Region
  •  

    Industry Major Market Players

    • The Linde Group
    •  INOX Air Products Ltd.
    •  Continental Carbonic Products  Inc.
    •  Praxair  Inc.
    •  Matheson Tri-Gas  Inc.
    •  Sicgil India Limited
    •  Air Products and Chemicals  Inc.
    •  Universal Industrial Gases  Inc.
    •  Airgas Inc.
    •  Air Liquide International S.A.
    •  Gulf Cryo
    •  Bristol Gases – Concorde Corodex Group
    •  Dubai Industrial Gases
    •  National Industrial Gas Plants-Mohammed Hamad Al Mana Group