16.3. Research Methodology
- 16.3.1. Secondary Research
- 16.3.2. Primary Research
- 16.3.3. Statistical Models
- 16.3.3.1. Company Share Analysis Model
- 16.3.3.2. Revenue Based Modeling
- 16.3.4. Research Limitations
List of Figures
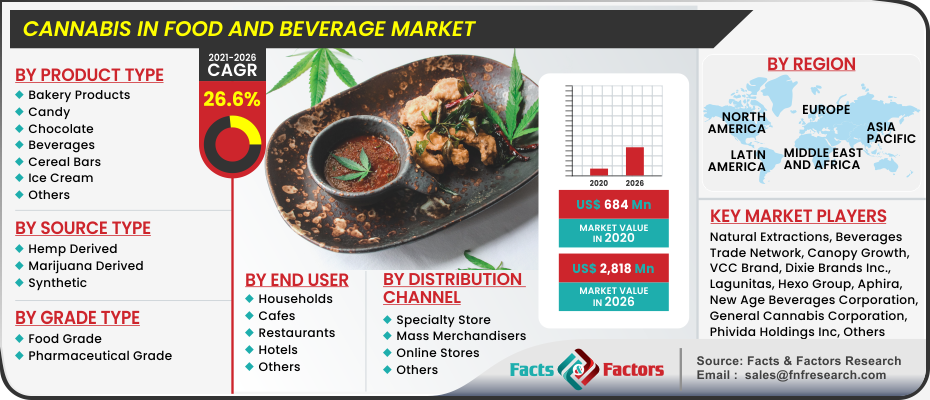
Fig.1	Product Picture of Cannabis in Food and Beverage
Fig.2	Global Cannabis in Food and Beverage Market, 2016 – 2026 (USD Million)
Fig.3	Global Cannabis in Food and Beverage Market, 2016 – 2026 (Kilo Tons)
Fig.4	Global Cannabis in Food and Beverage Market Absolute Revenue Opportunity, 2016 – 2026 (USD Million)
Fig.5	Global Cannabis in Food and Beverage Market Incremental Revenue Opportunity, 2020 – 2026 (USD Million)
Fig.6	Global Cannabis in Food and Beverage Market Share, by Product Type, 2020 & 2026 (USD Million)
Fig.7	Global Cannabis in Food and Beverage Market Share, by Product Type, 2020 & 2026 (Kilo Tons)
Fig.8	Global Bakery Products Cannabis in Food and Beverage Market, 2016 – 2026 (USD Million)
Fig.9	Global Bakery Products Cannabis in Food and Beverage Market, 2016 – 2026 (Kilo Tons)
Fig.10	Global Candy Cannabis in Food and Beverage Market, 2016 – 2026 (USD Million)
Fig.11	Global Candy Cannabis in Food and Beverage Market, 2016 – 2026 (Kilo Tons)
Fig.12	Global Chocolate Cannabis in Food and Beverage Market, 2016 – 2026 (USD Million)
Fig.13	Global Chocolate Cannabis in Food and Beverage Market, 2016 – 2026 (Kilo Tons)
Fig.14	Global Beverages Cannabis in Food and Beverage Market, 2016 – 2026 (USD Million)
Fig.15	Global Beverages Cannabis in Food and Beverage Market, 2016 – 2026 (Kilo Tons)
Fig.16	Global Cereal Bars Cannabis in Food and Beverage Market, 2016 – 2026 (USD Million)
Fig.17	Global Cereal Bars Cannabis in Food and Beverage Market, 2016 – 2026 (Kilo Tons)
Fig.18	Global Ice Cream Cannabis in Food and Beverage Market, 2016 – 2026 (USD Million)
Fig.19	Global Ice Cream Cannabis in Food and Beverage Market, 2016 – 2026 (Kilo Tons)
Fig.20	Global Others Cannabis in Food and Beverage Market, 2016 – 2026 (USD Million)
Fig.21	Global Others Cannabis in Food and Beverage Market, 2016 – 2026 (Kilo Tons)
Fig.22	Global Cannabis in Food and Beverage Market Share, by Source Type, 2020 & 2026 (USD Million)
Fig.23	Global Cannabis in Food and Beverage Market Share, by Source Type, 2020 & 2026 (Kilo Tons)
Fig.24	Global Hemp Derived Cannabis in Food and Beverage Market, 2016 – 2026 (USD Million)
Fig.25	Global Hemp Derived Cannabis in Food and Beverage Market, 2016 – 2026 (Kilo Tons)
Fig.26	Global Marijuana Derived Cannabis in Food and Beverage Market, 2016 – 2026 (USD Million)
Fig.27	Global Marijuana Derived Cannabis in Food and Beverage Market, 2016 – 2026 (Kilo Tons)
Fig.28	Global Synthetic Cannabis in Food and Beverage Market, 2016 – 2026 (USD Million)
Fig.29	Global Synthetic Cannabis in Food and Beverage Market, 2016 – 2026 (Kilo Tons)
Fig.30	Global Cannabis in Food and Beverage Market Share, by Grade Type, 2020 & 2026 (USD Million)
Fig.31	Global Cannabis in Food and Beverage Market Share, by Grade Type, 2020 & 2026 (Kilo Tons)
Fig.32	Global Food Grade Cannabis in Food and Beverage Market, 2016 – 2026 (USD Million)
Fig.33	Global Food Grade Cannabis in Food and Beverage Market, 2016 – 2026 (Kilo Tons)
Fig.34	Global Pharmaceutical Grade Cannabis in Food and Beverage Market, 2016 – 2026 (USD Million)
Fig.35	Global Pharmaceutical Grade Cannabis in Food and Beverage Market, 2016 – 2026 (Kilo Tons)
Fig.36	Global Cannabis in Food and Beverage Market Share, by  End User, 2020 & 2026 (USD Million)
Fig.37	Global Cannabis in Food and Beverage Market Share, by  End User, 2020 & 2026 (Kilo Tons)
Fig.38	Global Households Cannabis in Food and Beverage Market, 2016 – 2026 (USD Million)
Fig.39	Global Households Cannabis in Food and Beverage Market, 2016 – 2026 (Kilo Tons)
Fig.40	Global Cafes Cannabis in Food and Beverage Market, 2016 – 2026 (USD Million)
Fig.41	Global Cafes Cannabis in Food and Beverage Market, 2016 – 2026 (Kilo Tons)
Fig.42	Global Restaurants Cannabis in Food and Beverage Market, 2016 – 2026 (USD Million)
Fig.43	Global Restaurants Cannabis in Food and Beverage Market, 2016 – 2026 (Kilo Tons)
Fig.44	Global Hotels Cannabis in Food and Beverage Market, 2016 – 2026 (USD Million)
Fig.45	Global Hotels Cannabis in Food and Beverage Market, 2016 – 2026 (Kilo Tons)
Fig.46	Global Others Cannabis in Food and Beverage Market, 2016 – 2026 (USD Million)
Fig.47	Global Others Cannabis in Food and Beverage Market, 2016 – 2026 (Kilo Tons)
Fig.48	Global Cannabis in Food and Beverage Market Share, by Distribution Channel, 2020 & 2026 (USD Million)
Fig.49	Global Cannabis in Food and Beverage Market Share, by Distribution Channel, 2020 & 2026 (Kilo Tons)
Fig.50	Global Specialty Store Cannabis in Food and Beverage Market, 2016 – 2026 (USD Million)
Fig.51	Global Specialty Store Cannabis in Food and Beverage Market, 2016 – 2026 (Kilo Tons)
Fig.52	Global Mass Merchandisers Cannabis in Food and Beverage Market, 2016 – 2026 (USD Million)
Fig.53	Global Mass Merchandisers Cannabis in Food and Beverage Market, 2016 – 2026 (Kilo Tons)
Fig.54	Global Online Stores Cannabis in Food and Beverage Market, 2016 – 2026 (USD Million)
Fig.55	Global Online Stores Cannabis in Food and Beverage Market, 2016 – 2026 (Kilo Tons)
Fig.56	Global Others Cannabis in Food and Beverage Market, 2016 – 2026 (USD Million)
Fig.57	Global Others Cannabis in Food and Beverage Market, 2016 – 2026 (Kilo Tons)
Fig.58	Global Cannabis in Food and Beverage Market Share, by Region, 2020 & 2026 (USD Million)
Fig.59	Global Cannabis in Food and Beverage Market Share, by Region, 2020 & 2026 (Kilo Tons)
Fig.60	North America Cannabis in Food and Beverage Market, 2016 – 2026 (USD Million)
Fig.61	North America Cannabis in Food and Beverage Market, 2016 – 2026 (Kilo Tons)
Fig.62	U.S. Cannabis in Food and Beverage Market, 2016 – 2026 (USD Million)
Fig.63	U.S. Cannabis in Food and Beverage  Market, 2016 – 2026 (Kilo Tons)
Fig.64	Canada Cannabis in Food and Beverage Market, 2016 – 2026 (USD Million)
Fig.65	Canada Cannabis in Food and Beverage  Market, 2016 – 2026 (Kilo Tons)
Fig.66	Europe Cannabis in Food and Beverage Market, 2016 – 2026 (USD Million)
Fig.67	Europe Cannabis in Food and Beverage Market, 2016 – 2026 (Kilo Tons)
Fig.68	Germany Cannabis in Food and Beverage Market, 2016 – 2026 (USD Million)
Fig.69	Germany Cannabis in Food and Beverage  Market, 2016 – 2026 (Kilo Tons)
Fig.70	France Cannabis in Food and Beverage Market, 2016 – 2026 (USD Million)
Fig.71	France Cannabis in Food and Beverage  Market, 2016 – 2026 (Kilo Tons)
Fig.72	U.K. Cannabis in Food and Beverage Market, 2016 – 2026 (USD Million)
Fig.73	U.K. Cannabis in Food and Beverage  Market, 2016 – 2026 (Kilo Tons)
Fig.74	Italy Cannabis in Food and Beverage Market, 2016 – 2026 (USD Million)
Fig.75	Italy Cannabis in Food and Beverage  Market, 2016 – 2026 (Kilo Tons)
Fig.76	Spain Cannabis in Food and Beverage Market, 2016 – 2026 (USD Million)
Fig.77	Spain Cannabis in Food and Beverage  Market, 2016 – 2026 (Kilo Tons)
Fig.78	Rest of Europe Cannabis in Food and Beverage Market, 2016 – 2026 (USD Million)
Fig.79	Rest of Europe Cannabis in Food and Beverage  Market, 2016 – 2026 (Kilo Tons)
Fig.80	Asia Pacific Cannabis in Food and Beverage Market, 2016 – 2026 (USD Million)
Fig.81	Asia Pacific Cannabis in Food and Beverage Market, 2016 – 2026 (Kilo Tons)
Fig.82	China Cannabis in Food and Beverage Market, 2016 – 2026 (USD Million)
Fig.83	China Cannabis in Food and Beverage  Market, 2016 – 2026 (Kilo Tons)
Fig.84	Japan Cannabis in Food and Beverage Market, 2016 – 2026 (USD Million)
Fig.85	Japan Cannabis in Food and Beverage  Market, 2016 – 2026 (Kilo Tons)
Fig.86	India Cannabis in Food and Beverage Market, 2016 – 2026 (USD Million)
Fig.87	India Cannabis in Food and Beverage  Market, 2016 – 2026 (Kilo Tons)
Fig.88	South  Korea Cannabis in Food and Beverage Market, 2016 – 2026 (USD Million)
Fig.89	South  Korea Cannabis in Food and Beverage  Market, 2016 – 2026 (Kilo Tons)
Fig.90	South-East Asia Cannabis in Food and Beverage Market, 2016 – 2026 (USD Million)
Fig.91	South-East Asia Cannabis in Food and Beverage  Market, 2016 – 2026 (Kilo Tons)
Fig.92	Rest of Asia Pacific Cannabis in Food and Beverage Market, 2016 – 2026 (USD Million)
Fig.93	Rest of Asia Pacific Cannabis in Food and Beverage  Market, 2016 – 2026 (Kilo Tons)
Fig.94	Latin America Cannabis in Food and Beverage Market, 2016 – 2026 (USD Million)
Fig.95	Latin America Cannabis in Food and Beverage Market, 2016 – 2026 (Kilo Tons)
Fig.96	Brazil Cannabis in Food and Beverage Market, 2016 – 2026 (USD Million)
Fig.97	Brazil Cannabis in Food and Beverage  Market, 2016 – 2026 (Kilo Tons)
Fig.98	Mexico Cannabis in Food and Beverage Market, 2016 – 2026 (USD Million)
Fig.99	Mexico Cannabis in Food and Beverage  Market, 2016 – 2026 (Kilo Tons)
Fig.100	Rest of Latin America Cannabis in Food and Beverage Market, 2016 – 2026 (USD Million)
Fig.101	Rest of Latin America Cannabis in Food and Beverage  Market, 2016 – 2026 (Kilo Tons)
Fig.102	The Middle-East and Africa Cannabis in Food and Beverage Market, 2016 – 2026 (USD Million)
Fig.103	The Middle-East and Africa Cannabis in Food and Beverage Market, 2016 – 2026 (Kilo Tons)
Fig.104	GCC Countries Cannabis in Food and Beverage Market, 2016 – 2026 (USD Million)
Fig.105	GCC Countries Cannabis in Food and Beverage  Market, 2016 – 2026 (Kilo Tons)
Fig.106	South Africa Cannabis in Food and Beverage Market, 2016 – 2026 (USD Million)
Fig.107	South Africa Cannabis in Food and Beverage  Market, 2016 – 2026 (Kilo Tons)
Fig.108	Rest of Middle-East Africa Cannabis in Food and Beverage Market, 2016 – 2026 (USD Million)
Fig.109	Rest of Middle-East Africa Cannabis in Food and Beverage  Market, 2016 – 2026 (Kilo Tons)
Fig.110	Global Cannabis in Food and Beverage Production and Consumption, 2016 – 2026 (Kilo Tons)
Fig.111	North America Cannabis in Food and Beverage Production and Consumption, 2016 – 2026 (USD Million) (Kilo Tons)
Fig.112	Europe Cannabis in Food and Beverage Production and Consumption, 2016 – 2026 (USD Million) (Kilo Tons)
Fig.113	Asia Pacific Cannabis in Food and Beverage Production and Consumption, 2016 – 2026 (USD Million) (Kilo Tons)
Fig.114	Latin America Cannabis in Food and Beverage Production and Consumption, 2016 – 2026 (USD Million) (Kilo Tons)
Fig.115	The Middle-East and Africa Cannabis in Food and Beverage Production and Consumption, 2016 – 2026 (USD Million) (Kilo Tons)
Fig.116	Competitor Market Share – Revenue
Fig.117	Competitor Market Share – Volume
Fig.118	Natural Extractions Revenue and Growth Rate
Fig.119	Natural Extractions Market Share
Fig.120	Beverages Trade Network Revenue and Growth Rate
Fig.121	Beverages Trade Network Market Share
Fig.122	Canopy Growth Revenue and Growth Rate
Fig.123	Canopy Growth Market Share
Fig.124	VCC Brand Revenue and Growth Rate
Fig.125	VCC Brand Market Share
Fig.126	Dixie Brands Inc. Revenue and Growth Rate
Fig.127	Dixie Brands Inc. Market Share
Fig.128	Lagunitas Revenue and Growth Rate
Fig.129	Lagunitas Market Share
Fig.130	Hexo Group Revenue and Growth Rate
Fig.131	Hexo Group Market Share
Fig.132	Aphira Revenue and Growth Rate
Fig.133	Aphira Market Share
Fig.134	New Age Beverages Corporation Revenue and Growth Rate
Fig.135	New Age Beverages Corporation Market Share
Fig.136	General Cannabis Corporation Revenue and Growth Rate
Fig.137	General Cannabis Corporation Market Share
Fig.138	Phivida Holdings Inc Revenue and Growth Rate
Fig.139	Phivida Holdings Inc Market Share
Fig.140	The Supreme Cannabis Company Revenue and Growth Rate
Fig.141	The Supreme Cannabis Company Market Share
Fig.142	Coalition Brewing Revenue and Growth Rate
Fig.143	Coalition Brewing Market Share
Fig.144	Koios Beverage Corporation Revenue and Growth Rate
Fig.145	Koios Beverage Corporation Market Share
Fig.146	Alkaline88 LLC Revenue and Growth Rate
Fig.147	Alkaline88 LLC Market Share
Fig.148	The Alkaline Water Company Revenue and Growth Rate
Fig.149	The Alkaline Water Company Market Share
Fig.150	Others Revenue and Growth Rate
Fig.151	Others Market Share
Fig.152	Market Dynamics
Fig.153	Global Cannabis in Food and Beverage – Value Chain Analysis
Fig.154	Key Mandates and Regulations
Fig.155	Technology Roadmap and Timeline
Fig.156	Market Attractiveness Analysis – By Product Type
Fig.157	Market Attractiveness Analysis – By Source Type
Fig.158	Market Attractiveness Analysis – By Grade Type
Fig.159	Market Attractiveness Analysis – By  End User
Fig.160	Market Attractiveness Analysis – By Distribution Channel
Fig.161	Market Attractiveness Analysis – By Region
Fig.162	Manufacturing Cost Structure of Cannabis in Food and Beverage
Fig.163	Cannabis in Food and Beverage Industrial Chain Analysis
Fig.164	Market Channels
Fig.165	Marketing Channel Development Trend
Fig.166	Growth in World Gross Product, 2008-2018
List of Tables
Table 1	Global Cannabis in Food and Beverage Market, 2020 & 2026 (USD Million)
Table 2	Global Cannabis in Food and Beverage Market, by Product Type, 2016 – 2026 (USD Million)
Table 3	Global Cannabis in Food and Beverage Market, by Product Type, 2016 – 2026 (Kilo Tons)
Table 4	Global Cannabis in Food and Beverage Market, by Source Type, 2016 – 2026 (USD Million)
Table 5	Global Cannabis in Food and Beverage Market, by Source Type, 2016 – 2026 (Kilo Tons)
Table 6	Global Cannabis in Food and Beverage Market, by Grade Type, 2016 – 2026 (USD Million)
Table 7	Global Cannabis in Food and Beverage Market, by Grade Type, 2016 – 2026 (Kilo Tons)
Table 8	Global Cannabis in Food and Beverage Market, by  End User, 2016 – 2026 (USD Million)
Table 9	Global Cannabis in Food and Beverage Market, by  End User, 2016 – 2026 (Kilo Tons)
Table 10 Global Cannabis in Food and Beverage Market, by Distribution Channel, 2016 – 2026 (USD Million)
Table 11 Global Cannabis in Food and Beverage Market, by Distribution Channel, 2016 – 2026 (Kilo Tons)
Table 12 Global Cannabis in Food and Beverage Market, by Region, 2016 – 2026 (USD Million)
Table 13 Global Cannabis in Food and Beverage Market, by Region, 2016 – 2026 (Kilo Tons)
Table 14 North America Cannabis in Food and Beverage Market, by Country, 2016 – 2026 (USD Million)
Table 15 North America Cannabis in Food and Beverage Market, by Country, 2016 – 2026 (Kilo Tons)
Table 16 North America Cannabis in Food and Beverage Market, by Product Type, 2016 – 2026 (USD Million)
Table 17 North America Cannabis in Food and Beverage Market, by Product Type, 2016 – 2026 (Kilo Tons)
Table 18 North America Cannabis in Food and Beverage Market, by Source Type, 2016 – 2026 (USD Million)
Table 19 North America Cannabis in Food and Beverage Market, by Source Type, 2016 – 2026 (Kilo Tons)
Table 20 North America Cannabis in Food and Beverage Market, by Grade Type, 2016 – 2026 (USD Million)
Table 21 North America Cannabis in Food and Beverage Market, by Grade Type, 2016 – 2026 (Kilo Tons)
Table 22 North America Cannabis in Food and Beverage Market, by  End User, 2016 – 2026 (USD Million)
Table 23 North America Cannabis in Food and Beverage Market, by  End User, 2016 – 2026 (Kilo Tons)
Table 24 North America Cannabis in Food and Beverage Market, by Distribution Channel, 2016 – 2026 (USD Million)
Table 25 North America Cannabis in Food and Beverage Market, by Distribution Channel, 2016 – 2026 (Kilo Tons)
Table 26 Europe Cannabis in Food and Beverage Market, by Country, 2016 – 2026 (USD Million)
Table 27 Europe Cannabis in Food and Beverage Market, by Country, 2016 – 2026 (Kilo Tons)
Table 28 Europe Cannabis in Food and Beverage Market, by Product Type, 2016 – 2026 (USD Million)
Table 29 Europe Cannabis in Food and Beverage Market, by Product Type, 2016 – 2026 (Kilo Tons)
Table 30 Europe Cannabis in Food and Beverage Market, by Source Type, 2016 – 2026 (USD Million)
Table 31 Europe Cannabis in Food and Beverage Market, by Source Type, 2016 – 2026 (Kilo Tons)
Table 32 Europe Cannabis in Food and Beverage Market, by Grade Type, 2016 – 2026 (USD Million)
Table 33 Europe Cannabis in Food and Beverage Market, by Grade Type, 2016 – 2026 (Kilo Tons)
Table 34 Europe Cannabis in Food and Beverage Market, by  End User, 2016 – 2026 (USD Million)
Table 35 Europe Cannabis in Food and Beverage Market, by  End User, 2016 – 2026 (Kilo Tons)
Table 36 Europe Cannabis in Food and Beverage Market, by Distribution Channel, 2016 – 2026 (USD Million)
Table 37 Europe Cannabis in Food and Beverage Market, by Distribution Channel, 2016 – 2026 (Kilo Tons)
Table 38 Asia Pacific Cannabis in Food and Beverage Market, by Country, 2016 – 2026 (USD Million)
Table 39 Asia Pacific Cannabis in Food and Beverage Market, by Country, 2016 – 2026 (Kilo Tons)
Table 40 Asia Pacific Cannabis in Food and Beverage Market, by Product Type, 2016 – 2026 (USD Million)
Table 41 Asia Pacific Cannabis in Food and Beverage Market, by Product Type, 2016 – 2026 (Kilo Tons)
Table 42 Asia Pacific Cannabis in Food and Beverage Market, by Source Type, 2016 – 2026 (USD Million)
Table 43 Asia Pacific Cannabis in Food and Beverage Market, by Source Type, 2016 – 2026 (Kilo Tons)
Table 44 Asia Pacific Cannabis in Food and Beverage Market, by Grade Type, 2016 – 2026 (USD Million)
Table 45 Asia Pacific Cannabis in Food and Beverage Market, by Grade Type, 2016 – 2026 (Kilo Tons)
Table 46 Asia Pacific Cannabis in Food and Beverage Market, by  End User, 2016 – 2026 (USD Million)
Table 47 Asia Pacific Cannabis in Food and Beverage Market, by  End User, 2016 – 2026 (Kilo Tons)
Table 48 Asia Pacific Cannabis in Food and Beverage Market, by Distribution Channel, 2016 – 2026 (USD Million)
Table 49 Asia Pacific Cannabis in Food and Beverage Market, by Distribution Channel, 2016 – 2026 (Kilo Tons)
Table 50 Latin America Cannabis in Food and Beverage Market, by Country, 2016 – 2026 (USD Million)
Table 51 Latin America Cannabis in Food and Beverage Market, by Country, 2016 – 2026 (Kilo Tons)
Table 52 Latin America Cannabis in Food and Beverage Market, by Product Type, 2016 – 2026 (USD Million)
Table 53 Latin America Cannabis in Food and Beverage Market, by Product Type, 2016 – 2026 (Kilo Tons)
Table 54 Latin America Cannabis in Food and Beverage Market, by Source Type, 2016 – 2026 (USD Million)
Table 55 Latin America Cannabis in Food and Beverage Market, by Source Type, 2016 – 2026 (Kilo Tons)
Table 56 Latin America Cannabis in Food and Beverage Market, by Grade Type, 2016 – 2026 (USD Million)
Table 57 Latin America Cannabis in Food and Beverage Market, by Grade Type, 2016 – 2026 (Kilo Tons)
Table 58 Latin America Cannabis in Food and Beverage Market, by  End User, 2016 – 2026 (USD Million)
Table 59 Latin America Cannabis in Food and Beverage Market, by  End User, 2016 – 2026 (Kilo Tons)
Table 60 Latin America Cannabis in Food and Beverage Market, by Distribution Channel, 2016 – 2026 (USD Million)
Table 61 Latin America Cannabis in Food and Beverage Market, by Distribution Channel, 2016 – 2026 (Kilo Tons)
Table 62 The Middle-East and Africa Cannabis in Food and Beverage Market, by Country, 2016 – 2026 (USD Million)
Table 63 The Middle-East and Africa Cannabis in Food and Beverage Market, by Country, 2016 – 2026 (Kilo Tons)
Table 64 The Middle-East and Africa Cannabis in Food and Beverage Market, by Product Type, 2016 – 2026 (USD Million)
Table 65 The Middle-East and Africa Cannabis in Food and Beverage Market, by Product Type, 2016 – 2026 (Kilo Tons)
Table 66 The Middle-East and Africa Cannabis in Food and Beverage Market, by Source Type, 2016 – 2026 (USD Million)
Table 67 The Middle-East and Africa Cannabis in Food and Beverage Market, by Source Type, 2016 – 2026 (Kilo Tons)
Table 68 The Middle-East and Africa Cannabis in Food and Beverage Market, by Grade Type, 2016 – 2026 (USD Million)
Table 69 The Middle-East and Africa Cannabis in Food and Beverage Market, by Grade Type, 2016 – 2026 (Kilo Tons)
Table 70 The Middle-East and Africa Cannabis in Food and Beverage Market, by  End User, 2016 – 2026 (USD Million)
Table 71 The Middle-East and Africa Cannabis in Food and Beverage Market, by  End User, 2016 – 2026 (Kilo Tons)
Table 72 The Middle-East and Africa Cannabis in Food and Beverage Market, by Distribution Channel, 2016 – 2026 (USD Million)
Table 73 The Middle-East and Africa Cannabis in Food and Beverage Market, by Distribution Channel, 2016 – 2026 (Kilo Tons)
Table 74 North America Cannabis in Food and Beverage Production, Consumption, Export, Import, 2016 – 2020
Table 75 Europe Cannabis in Food and Beverage Production, Consumption, Export, Import, 2016 – 2020
Table 76 Asia Pacific Cannabis in Food and Beverage Production, Consumption, Export, Import, 2016 – 2020
Table 77 Latin America Cannabis in Food and Beverage Production, Consumption, Export, Import, 2016 – 2020
Table 78 The Middle-East and Africa Cannabis in Food and Beverage Production, Consumption, Export, Import, 2016 – 2020
Table 79 Global Cannabis in Food and Beverage Market - Company Revenue Analysis, 2016 – 2020 (USD Million)
Table 80 Global Cannabis in Food and Beverage Market - Company Revenue Share Analysis, 2016 – 2020 (%)
Table 81 Global Cannabis in Food and Beverage Market - Company Volume Analysis, 2016 – 2020 (Kilo Tons)
Table 82 Global Cannabis in Food and Beverage Market - Company Volume Share Analysis, 2016 – 2020 (%)
Table 83 Acquisitions and Mergers
Table 84 Market Drivers – Impact Analysis
Table 85 Market Restraints
Table 86 Market Opportunities
Table 87 Production Base and Market Concentration Rate of Raw Material
Table 88 Key Suppliers of Raw Materials
Table 89 Raw Materials Sources of Cannabis in Food and Beverage Major Manufacturers
Table 90 Major Buyers of Cannabis in Food and Beverage
Table 91 Distributors/Traders of Cannabis in Food and Beverage by Region

 Market Overview