Search Market Research Report

Discover Our Latest Reports
Discover Our Featured Reports
Discover Top Selling Reports

Cable Management Accessory Market Size, Share Global Analysis Report, , 2020 – 2026

report img

Cable Management Accessory Market By Product Type (Cable Lung, Cable Marker, Heat Shrink Tube, and Others), By End-User (IT and Telecom, Manufacturing, Energy & Utility, Health Care, Logistics and Transportation, Mining, Oil & Gas, Construction, and Others), and By Regions - Global Industry Perspective, Comprehensive Analysis, and Forecast, 2020 – 2026

Industry Insights

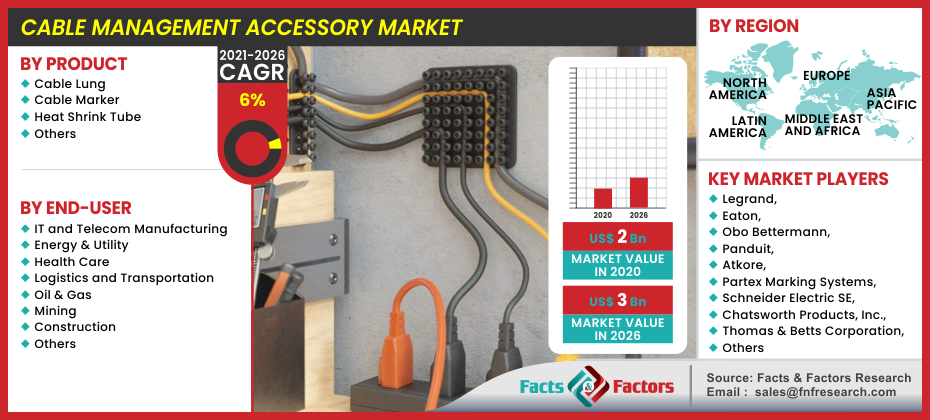
[189+ Pages Report] Facts and Factors has recently published the report titled “Cable Management Accessories Market” which illustrates that the global cable management accessories market was estimated at around USD 2 Billion in 2020, and it is expected to provide revenue of about USD 3 Billion by end of 2026, developing at a CAGR of around 6% between 2021 and 2026.

logoGlobal Cable Management Accessories Market: Overview

Cable management accessories are physical systems that help in reducing the hassle by providing intermediate support by maintaining documented physical support networks. These accessories further provide a pivotal role in avoiding financial losses and enabling a higher level of productivity. Furthermore, the measures provided by cable management accessories prolong the life cycle of these devices. Additional benefits include improved performance, flexible functionality, and enhanced safety features. A high rise for cable management accessories has given manufacturers the power to experiment with lightweight yet durable materials.

logoGlobal Cable Management Accessories Market: Growth Factors

The global infrastructure sector indicates a higher growth than before owing to sectors such as railways, roads, airports, and communication sectors witnessing an enormous boom. Consumption of electrical units will expect a higher consumption rate all through the world which will play a crucial role in shaping the growth of the cable management accessory market. Higher demand for energy and increased investment in the private sector will drive the growth of the market to a higher margin. Renewing or building old electrical infrastructure in developed countries will led to a rise in the development of cable management accessories.

The average lifespan of a transformer ranges from 25 to 30 years. As the lifespan of such generators come close, the government of various countries will begin ramping up infrastructure to upgrade their existing structures. Aging equipment does not bode well for environmental and technical efforts in times of need. Even though government bodies are working toward achieving a technology to extend the average lifespan of a transformer, the technology to be developed will until the current lifestyle of the standing infrastructure succeeds. However, a constant price inequality of raw materials and a highly segmented market at regional levels is expected to hamper the growth of the market to a certain extent.

Cable Management Accessory Market

To know more about this report | Request Free Sample Copy

logoGlobal Cable Management Accessories Market: Segmentation

The global cable management accessories market can be segmented on the basis of product type, end-user, and region.

On the basis of type, the market of cable management accessory can be broken down into cable lung, cable marker, heat shrink tube, and others. On the basis of end-user, the market of cable management accessory can be segmented into IT and Telecom, manufacturing, energy & utility, health care, logistics and transportation, mining, oil & gas, construction, and others. The telecom sector witnesses the highest growth due to continuous development in the field of technology and the rising demand in the communication field. Furthermore, the increasing popularity of data/communication applications and new systems and products developed by manufacturers of cable management accessories to adapt to varying requirements help propel the demand in the telecom sector.

logoGlobal Cable Management Accessories Market: Regional Analysis

The region of Asia-Pacific is expected to witness the highest growth CAGR during the forecast period. Increased investments in renewable power sources in emerging economies such as India and other countries in South-East Asia will add a boost to the cable management accessory market in the region. Other factors such as a growing need for industrialization in the region will further propel the market to a greater extent.

logoReport Scope

Report Attribute

Details

Market Size in 2020

USD 2 Billion in 2020

Projected Market Size in 2026

USD 3 Billion

CAGR Growth Rate

6% CAGR

Base Year

2020

Forecast Years

2021-2026

Key Market Players

Legrand, Eaton, Obo Bettermann, Panduit, Atkore, Partex Marking Systems, Schneider Electric SE, Chatsworth Products, Inc., Weidmuller Interface GnbH & Co. KG, Thomas & Betts Corporation, Anixter, Inc., Hellermann Tyton Group PLC, and Panduit Copr., among others.

Key Segment

By Product Type, By End-User, and By Region

Major Regions Covered

North America, Europe, Asia Pacific, Latin America, and the Middle East & Africa

Purchase Options

Request customized purchase options to meet your research needs. Explore purchase options

logoGlobal Cable Management Accessories Market: Competitive Players

Some of the major participants in the cable management accessories market are:

  • Legrand
  • Eaton
  • Obo Bettermann
  • Panduit
  • Atkore
  • Partex Marking Systems
  • Schneider Electric SE
  • Chatsworth Products Inc.
  • Weidmuller Interface GnbH & Co. KG
  • Thomas & Betts Corporation
  • Anixter Inc.
  • Hellermann Tyton Group PLC
  • Panduit Copr.

logoGlobal Cable Management Accessories Market: By Product Type Analysis

  • Cable Lung
  • Cable Marker
  • Heat Shrink Tube
  • Others

logoGlobal Cable Management Accessories Market: By End-User Segment Analysis

  • IT and Telecom Manufacturing
  • Energy & Utility
  • Health Care
  • Logistics and Transportation
  • Oil & Gas
  • Mining
  • Construction
  • Others

logoGlobal Cable Management Accessories Market: By Regional Segment Analysis

  • North America
    • U.S.
    • Canada
  • Europe
    • UK
    • France
    • Germany
    • Italy
    • Spain
    • Rest of Europe
  • Asia Pacific
    • China
    • Japan
    • India
    • South Korea
    • Southeast Asia
    • Rest of Asia Pacific
  • Latin America
    • Brazil
    • Mexico
    • Rest of Latin America
  • Middle East and Africa
    • GCC Countries
    • South Africa
    • Rest of MEA

Table of Content

  1. Chapter 1 Executive Summary
    1. 1.1. Introduction of Cable Management Accessories
    2. 1.2. Global Cable Management Accessories Market, 2020 & 2026 (USD Billion)
    3. 1.3. Global Cable Management Accessories Market, 2016 – 2026 (USD Billion)
    4. 1.4. Global Cable Management Accessories Market Absolute Revenue Opportunity, 2016 – 2026 (USD Billion)
    5. 1.5. Global Cable Management Accessories Market Incremental Revenue Opportunity, 2020 – 2026 (USD Billion)
  2. Chapter 2 Cable Management Accessories Market – Product Type Analysis
    1. 2.1. Global Cable Management Accessories Market – Product Type Overview
    2. 2.2. Global Cable Management Accessories Market Share, by Product Type, 2020 & 2026 (USD Billion)
    3. 2.3. Global Cable Management Accessories Market share, by Product Type, 2020 & 2026
    4. 2.4. Cable Lung
      1. 2.4.1. Global Cable Lung Cable Management Accessories Market, 2016 – 2026 (USD Billion)
      2. 2.4.2. Global Cable Lung Cable Management Accessories Market, 2016 – 2026
    5. 2.5. Cable Marker
      1. 2.5.1. Global Cable Marker Cable Management Accessories Market, 2016 – 2026 (USD Billion)
      2. 2.5.2. Global Cable Marker Cable Management Accessories Market, 2016 – 2026
    6. 2.6. Heat Shrink Tube
      1. 2.6.1. Global Heat Shrink Tube Cable Management Accessories Market, 2016 – 2026 (USD Billion)
      2. 2.6.2. Global Heat Shrink Tube Cable Management Accessories Market, 2016 – 2026
    7. 2.7. Others
      1. 2.7.1. Global Others Cable Management Accessories Market, 2016 – 2026 (USD Billion)
      2. 2.7.2. Global Others Cable Management Accessories Market, 2016 – 2026
  3. Chapter 3 Cable Management Accessories Market – End-User Analysis
    1. 3.1. Global Cable Management Accessories Market – End-User Overview
    2. 3.2. Global Cable Management Accessories Market Share, by End-User, 2020 & 2026 (USD Billion)
    3. 3.3. Global Cable Management Accessories Market share, by End-User, 2020 & 2026
    4. 3.4. IT and Telecom
      1. 3.4.1. Global IT and Telecom Cable Management Accessories Market, 2016 – 2026 (USD Billion)
      2. 3.4.2. Global IT and Telecom Cable Management Accessories Market, 2016 – 2026
    5. 3.5. Manufacturing
      1. 3.5.1. Global Manufacturing Cable Management Accessories Market, 2016 – 2026 (USD Billion)
      2. 3.5.2. Global Manufacturing Cable Management Accessories Market, 2016 – 2026
    6. 3.6. Energy & Utility
      1. 3.6.1. Global Energy & Utility Cable Management Accessories Market, 2016 – 2026 (USD Billion)
      2. 3.6.2. Global Energy & Utility Cable Management Accessories Market, 2016 – 2026
    7. 3.7. Health Care
      1. 3.7.1. Global Health Care Cable Management Accessories Market, 2016 – 2026 (USD Billion)
      2. 3.7.2. Global Health Care Cable Management Accessories Market, 2016 – 2026
    8. 3.8. Logistics and Transportation
      1. 3.8.1. Global Logistics and Transportation Cable Management Accessories Market, 2016 – 2026 (USD Billion)
      2. 3.8.2. Global Logistics and Transportation Cable Management Accessories Market, 2016 – 2026
    9. 3.9. Mining
      1. 3.9.1. Global Mining Cable Management Accessories Market, 2016 – 2026 (USD Billion)
      2. 3.9.2. Global Mining Cable Management Accessories Market, 2016 – 2026
    10. 3.10. Oil & Gas
      1. 3.10.1. Global Oil & Gas Cable Management Accessories Market, 2016 – 2026 (USD Billion)
      2. 3.10.2. Global Oil & Gas Cable Management Accessories Market, 2016 – 2026
    11. 3.11. Construction
      1. 3.11.1. Global Construction Cable Management Accessories Market, 2016 – 2026 (USD Billion)
      2. 3.11.2. Global Construction Cable Management Accessories Market, 2016 – 2026
    12. 3.12. Others
      1. 3.12.1. Global Others Cable Management Accessories Market, 2016 – 2026 (USD Billion)
      2. 3.12.2. Global Others Cable Management Accessories Market, 2016 – 2026
  4. Chapter 4 Cable Management Accessories Market – Regional Analysis
    1. 4.1. Global Cable Management Accessories Market Regional Overview
    2. 4.2. Global Cable Management Accessories Market Share, by Region, 2020 & 2026 (USD Billion)
    3. 4.3. Global Cable Management Accessories Market Share, by Region, 2020 & 2026
    4. 4.4. North America
      1. 4.4.1. North America Cable Management Accessories Market, 2016 – 2026 (USD Billion)
        1. 4.4.1.1. North America Cable Management Accessories Market, by Country, 2016 – 2026 (USD Billion)
      2. 4.4.2. North America Market, 2016 – 2026
        1. 4.4.2.1. North America Cable Management Accessories Market, by Country, 2016 – 2026
      3. 4.4.3. North America Cable Management Accessories Market, by Product Type, 2016 – 2026
        1. 4.4.3.1. North America Cable Management Accessories Market, by Product Type, 2016 – 2026 (USD Billion)
        2. 4.4.3.2. North America Cable Management Accessories Market, by Product Type, 2016 – 2026
      4. 4.4.4. North America Cable Management Accessories Market, by End-User, 2016 – 2026
        1. 4.4.4.1. North America Cable Management Accessories Market, by End-User, 2016 – 2026 (USD Billion)
        2. 4.4.4.2. North America Cable Management Accessories Market, by End-User, 2016 – 2026
      5. 4.4.5. U.S.
        1. 4.4.5.1. U.S. Cable Management Accessories Market, 2016 – 2026 (USD Billion)
        2. 4.4.5.2. U.S. Cable Management Accessories Market, 2016 – 2026
      6. 4.4.6. Canada
        1. 4.4.6.1. Canada Cable Management Accessories Market, 2016 – 2026 (USD Billion)
        2. 4.4.6.2. Canada Cable Management Accessories Market, 2016 – 2026
    5. 4.5. Europe
      1. 4.5.1. Europe Cable Management Accessories Market, 2016 – 2026 (USD Billion)
        1. 4.5.1.1. Europe Cable Management Accessories Market, by Country, 2016 – 2026 (USD Billion)
      2. 4.5.2. Europe Market, 2016 – 2026
        1. 4.5.2.1. Europe Cable Management Accessories Market, by Country, 2016 – 2026
      3. 4.5.3. Europe Cable Management Accessories Market, by Product Type, 2016 – 2026
        1. 4.5.3.1. Europe Cable Management Accessories Market, by Product Type, 2016 – 2026 (USD Billion)
        2. 4.5.3.2. Europe Cable Management Accessories Market, by Product Type, 2016 – 2026
      4. 4.5.4. Europe Cable Management Accessories Market, by End-User, 2016 – 2026
        1. 4.5.4.1. Europe Cable Management Accessories Market, by End-User, 2016 – 2026 (USD Billion)
        2. 4.5.4.2. Europe Cable Management Accessories Market, by End-User, 2016 – 2026
      5. 4.5.5. Germany
        1. 4.5.5.1. Germany Cable Management Accessories Market, 2016 – 2026 (USD Billion)
        2. 4.5.5.2. Germany Cable Management Accessories Market, 2016 – 2026
      6. 4.5.6. France
        1. 4.5.6.1. France Cable Management Accessories Market, 2016 – 2026 (USD Billion)
        2. 4.5.6.2. France Cable Management Accessories Market, 2016 – 2026
      7. 4.5.7. U.K.
        1. 4.5.7.1. U.K. Cable Management Accessories Market, 2016 – 2026 (USD Billion)
        2. 4.5.7.2. U.K. Cable Management Accessories Market, 2016 – 2026
      8. 4.5.8. Italy
        1. 4.5.8.1. Italy Cable Management Accessories Market, 2016 – 2026 (USD Billion)
        2. 4.5.8.2. Italy Cable Management Accessories Market, 2016 – 2026
      9. 4.5.9. Spain
        1. 4.5.9.1. Spain Cable Management Accessories Market, 2016 – 2026 (USD Billion)
        2. 4.5.9.2. Spain Cable Management Accessories Market, 2016 – 2026
      10. 4.5.10. Rest of Europe
        1. 4.5.10.1. Rest of Europe Cable Management Accessories Market, 2016 – 2026 (USD Billion)
        2. 4.5.10.2. Rest of Europe Cable Management Accessories Market, 2016 – 2026
    6. 4.6. Asia Pacific
      1. 4.6.1. Asia Pacific Cable Management Accessories Market, 2016 – 2026 (USD Billion)
        1. 4.6.1.1. Asia Pacific Cable Management Accessories Market, by Country, 2016 – 2026 (USD Billion)
      2. 4.6.2. Asia Pacific Market, 2016 – 2026
        1. 4.6.2.1. Asia Pacific Cable Management Accessories Market, by Country, 2016 – 2026
      3. 4.6.3. Asia Pacific Cable Management Accessories Market, by Product Type, 2016 – 2026
        1. 4.6.3.1. Asia Pacific Cable Management Accessories Market, by Product Type, 2016 – 2026 (USD Billion)
        2. 4.6.3.2. Asia Pacific Cable Management Accessories Market, by Product Type, 2016 – 2026
      4. 4.6.4. Asia Pacific Cable Management Accessories Market, by End-User, 2016 – 2026
        1. 4.6.4.1. Asia Pacific Cable Management Accessories Market, by End-User, 2016 – 2026 (USD Billion)
        2. 4.6.4.2. Asia Pacific Cable Management Accessories Market, by End-User, 2016 – 2026
      5. 4.6.5. China
        1. 4.6.5.1. China Cable Management Accessories Market, 2016 – 2026 (USD Billion)
        2. 4.6.5.2. China Cable Management Accessories Market, 2016 – 2026
      6. 4.6.6. Japan
        1. 4.6.6.1. Japan Cable Management Accessories Market, 2016 – 2026 (USD Billion)
        2. 4.6.6.2. Japan Cable Management Accessories Market, 2016 – 2026
      7. 4.6.7. India
        1. 4.6.7.1. India Cable Management Accessories Market, 2016 – 2026 (USD Billion)
        2. 4.6.7.2. India Cable Management Accessories Market, 2016 – 2026
      8. 4.6.8. South Korea
        1. 4.6.8.1. South Korea Cable Management Accessories Market, 2016 – 2026 (USD Billion)
        2. 4.6.8.2. South Korea Cable Management Accessories Market, 2016 – 2026
      9. 4.6.9. South-East Asia
        1. 4.6.9.1. South-East Asia Cable Management Accessories Market, 2016 – 2026 (USD Billion)
        2. 4.6.9.2. South-East Asia Cable Management Accessories Market, 2016 – 2026
      10. 4.6.10. Rest of Asia Pacific
        1. 4.6.10.1. Rest of Asia Pacific Cable Management Accessories Market, 2016 – 2026 (USD Billion)
        2. 4.6.10.2. Rest of Asia Pacific Cable Management Accessories Market, 2016 – 2026
    7. 4.7. Latin America
      1. 4.7.1. Latin America Cable Management Accessories Market, 2016 – 2026 (USD Billion)
        1. 4.7.1.1. Latin America Cable Management Accessories Market, by Country, 2016 – 2026 (USD Billion)
      2. 4.7.2. Latin America Market, 2016 – 2026
        1. 4.7.2.1. Latin America Cable Management Accessories Market, by Country, 2016 – 2026
      3. 4.7.3. Latin America Cable Management Accessories Market, by Product Type, 2016 – 2026
        1. 4.7.3.1. Latin America Cable Management Accessories Market, by Product Type, 2016 – 2026 (USD Billion)
        2. 4.7.3.2. Latin America Cable Management Accessories Market, by Product Type, 2016 – 2026
      4. 4.7.4. Latin America Cable Management Accessories Market, by End-User, 2016 – 2026
        1. 4.7.4.1. Latin America Cable Management Accessories Market, by End-User, 2016 – 2026 (USD Billion)
        2. 4.7.4.2. Latin America Cable Management Accessories Market, by End-User, 2016 – 2026
      5. 4.7.5. Brazil
        1. 4.7.5.1. Brazil Cable Management Accessories Market, 2016 – 2026 (USD Billion)
        2. 4.7.5.2. Brazil Cable Management Accessories Market, 2016 – 2026
      6. 4.7.6. Mexico
        1. 4.7.6.1. Mexico Cable Management Accessories Market, 2016 – 2026 (USD Billion)
        2. 4.7.6.2. Mexico Cable Management Accessories Market, 2016 – 2026
      7. 4.7.7. Rest of Latin America
        1. 4.7.7.1. Rest of Latin America Cable Management Accessories Market, 2016 – 2026 (USD Billion)
        2. 4.7.7.2. Rest of Latin America Cable Management Accessories Market, 2016 – 2026
    8. 4.8. The Middle-East and Africa
      1. 4.8.1. The Middle-East and Africa Cable Management Accessories Market, 2016 – 2026 (USD Billion)
        1. 4.8.1.1. The Middle-East and Africa Cable Management Accessories Market, by Country, 2016 – 2026 (USD Billion)
      2. 4.8.2. The Middle-East and Africa Market, 2016 – 2026
        1. 4.8.2.1. The Middle-East and Africa Cable Management Accessories Market, by Country, 2016 – 2026
      3. 4.8.3. The Middle-East and Africa Cable Management Accessories Market, by Product Type, 2016 – 2026
        1. 4.8.3.1. The Middle-East and Africa Cable Management Accessories Market, by Product Type, 2016 – 2026 (USD Billion)
        2. 4.8.3.2. The Middle-East and Africa Cable Management Accessories Market, by Product Type, 2016 – 2026
      4. 4.8.4. The Middle-East and Africa Cable Management Accessories Market, by End-User, 2016 – 2026
        1. 4.8.4.1. The Middle-East and Africa Cable Management Accessories Market, by End-User, 2016 – 2026 (USD Billion)
        2. 4.8.4.2. The Middle-East and Africa Cable Management Accessories Market, by End-User, 2016 – 2026
      5. 4.8.5. GCC Countries
        1. 4.8.5.1. GCC Countries Cable Management Accessories Market, 2016 – 2026 (USD Billion)
        2. 4.8.5.2. GCC Countries Cable Management Accessories Market, 2016 – 2026
      6. 4.8.6. South Africa
        1. 4.8.6.1. South Africa Cable Management Accessories Market, 2016 – 2026 (USD Billion)
        2. 4.8.6.2. South Africa Cable Management Accessories Market, 2016 – 2026
      7. 4.8.7. Rest of Middle-East Africa
        1. 4.8.7.1. Rest of Middle-East Africa Cable Management Accessories Market, 2016 – 2026 (USD Billion)
        2. 4.8.7.2. Rest of Middle-East Africa Cable Management Accessories Market, 2016 – 2026
  5. Chapter 5 Cable Management Accessories Production, Consumption, Export, Import by Regions
    1. 5.1. Global Cable Management Accessories Production and Consumption, 2016 – 2026
    2. 5.2. Global Import and Export Analysis, by Region
  6. Chapter 6 Cable Management Accessories Market – Competitive Landscape
    1. 6.1. Competitor Market Share – Revenue
    2. 6.2. Market Concentration Rate Analysis, Top 3 and Top 5 Players
    3. 6.3. Competitor Market Share – Volume
    4. 6.4. Strategic Developments
      1. 6.4.1. Acquisitions and Mergers
      2. 6.4.2. New Products
      3. 6.4.3. Research & Development Activities
  7. Chapter 7 Company Profiles
    1. 7.1. Legrand
      1. 7.1.1. Company Overview
      2. 7.1.2. Product/Service Portfolio
      3. 7.1.3. Legrand Sales, Revenue, Price, and Gross Margin
      4. 7.1.4. Legrand Revenue and Growth Rate
      5. 7.1.5. Legrand Market Share
      6. 7.1.6. Recent Initiatives, Funding/VC Activities, and Technological Innovations
    2. 7.2. Eaton
      1. 7.2.1. Company Overview
      2. 7.2.2. Product/Service Portfolio
      3. 7.2.3. Eaton Sales, Revenue, Price, and Gross Margin
      4. 7.2.4. Eaton Revenue and Growth Rate
      5. 7.2.5. Eaton Market Share
      6. 7.2.6. Recent Initiatives, Funding/VC Activities, and Technological Innovations
    3. 7.3. Obo Bettermann
      1. 7.3.1. Company Overview
      2. 7.3.2. Product/Service Portfolio
      3. 7.3.3. Obo Bettermann Sales, Revenue, Price, and Gross Margin
      4. 7.3.4. Obo Bettermann Revenue and Growth Rate
      5. 7.3.5. Obo Bettermann Market Share
      6. 7.3.6. Recent Initiatives, Funding/VC Activities, and Technological Innovations
    4. 7.4. Panduit
      1. 7.4.1. Company Overview
      2. 7.4.2. Product/Service Portfolio
      3. 7.4.3. Panduit Sales, Revenue, Price, and Gross Margin
      4. 7.4.4. Panduit Revenue and Growth Rate
      5. 7.4.5. Panduit Market Share
      6. 7.4.6. Recent Initiatives, Funding/VC Activities, and Technological Innovations
    5. 7.5. Atkore
      1. 7.5.1. Company Overview
      2. 7.5.2. Product/Service Portfolio
      3. 7.5.3. Atkore Sales, Revenue, Price, and Gross Margin
      4. 7.5.4. Atkore Revenue and Growth Rate
      5. 7.5.5. Atkore Market Share
      6. 7.5.6. Recent Initiatives, Funding/VC Activities, and Technological Innovations
    6. 7.6. Partex Marking Systems
      1. 7.6.1. Company Overview
      2. 7.6.2. Product/Service Portfolio
      3. 7.6.3. Partex Marking Systems Sales, Revenue, Price, and Gross Margin
      4. 7.6.4. Partex Marking Systems Revenue and Growth Rate
      5. 7.6.5. Partex Marking Systems Market Share
      6. 7.6.6. Recent Initiatives, Funding/VC Activities, and Technological Innovations
    7. 7.7. Schneider Electric SE
      1. 7.7.1. Company Overview
      2. 7.7.2. Product/Service Portfolio
      3. 7.7.3. Schneider Electric SE Sales, Revenue, Price, and Gross Margin
      4. 7.7.4. Schneider Electric SE Revenue and Growth Rate
      5. 7.7.5. Schneider Electric SE Market Share
      6. 7.7.6. Recent Initiatives, Funding/VC Activities, and Technological Innovations
    8. 7.8. Chatsworth Products Inc.
      1. 7.8.1. Company Overview
      2. 7.8.2. Product/Service Portfolio
      3. 7.8.3. Chatsworth Products Inc. Sales, Revenue, Price, and Gross Margin
      4. 7.8.4. Chatsworth Products Inc. Revenue and Growth Rate
      5. 7.8.5. Chatsworth Products Inc. Market Share
      6. 7.8.6. Recent Initiatives, Funding/VC Activities, and Technological Innovations
    9. 7.9. Weidmuller Interface GnbH & Co. KG
      1. 7.9.1. Company Overview
      2. 7.9.2. Product/Service Portfolio
      3. 7.9.3. Weidmuller Interface GnbH & Co. KG Sales, Revenue, Price, and Gross Margin
      4. 7.9.4. Weidmuller Interface GnbH & Co. KG Revenue and Growth Rate
      5. 7.9.5. Weidmuller Interface GnbH & Co. KG Market Share
      6. 7.9.6. Recent Initiatives, Funding/VC Activities, and Technological Innovations
    10. 7.10. Thomas & Betts Corporation
      1. 7.10.1. Company Overview
      2. 7.10.2. Product/Service Portfolio
      3. 7.10.3. Thomas & Betts Corporation Sales, Revenue, Price, and Gross Margin
      4. 7.10.4. Thomas & Betts Corporation Revenue and Growth Rate
      5. 7.10.5. Thomas & Betts Corporation Market Share
      6. 7.10.6. Recent Initiatives, Funding/VC Activities, and Technological Innovations
    11. 7.11. Anixter Inc.
      1. 7.11.1. Company Overview
      2. 7.11.2. Product/Service Portfolio
      3. 7.11.3. Anixter Inc. Sales, Revenue, Price, and Gross Margin
      4. 7.11.4. Anixter Inc. Revenue and Growth Rate
      5. 7.11.5. Anixter Inc. Market Share
      6. 7.11.6. Recent Initiatives, Funding/VC Activities, and Technological Innovations
    12. 7.12. Hellermann Tyton Group PLC
      1. 7.12.1. Company Overview
      2. 7.12.2. Product/Service Portfolio
      3. 7.12.3. Hellermann Tyton Group PLC Sales, Revenue, Price, and Gross Margin
      4. 7.12.4. Hellermann Tyton Group PLC Revenue and Growth Rate
      5. 7.12.5. Hellermann Tyton Group PLC Market Share
      6. 7.12.6. Recent Initiatives, Funding/VC Activities, and Technological Innovations
    13. 7.13. Panduit Copr.
      1. 7.13.1. Company Overview
      2. 7.13.2. Product/Service Portfolio
      3. 7.13.3. Panduit Copr. Sales, Revenue, Price, and Gross Margin
      4. 7.13.4. Panduit Copr. Revenue and Growth Rate
      5. 7.13.5. Panduit Copr. Market Share
      6. 7.13.6. Recent Initiatives, Funding/VC Activities, and Technological Innovations
    14. 7.14. Others
      1. 7.14.1. Company Overview
      2. 7.14.2. Product/Service Portfolio
      3. 7.14.3. Others Sales, Revenue, Price, and Gross Margin
      4. 7.14.4. Others Revenue and Growth Rate
      5. 7.14.5. Others Market Share
      6. 7.14.6. Recent Initiatives, Funding/VC Activities, and Technological Innovations
  8. Chapter 8 Cable Management Accessories — Industry Analysis
    1. 8.1. Introduction and Taxonomy
    2. 8.2. Cable Management Accessories Market – Key Trends
      1. 8.2.1. Market Drivers
      2. 8.2.2. Market Restraints
      3. 8.2.3. Market Opportunities
    3. 8.3. Value Chain Analysis
    4. 8.4. Key Mandates and Regulations
    5. 8.5. Technology Roadmap and Timeline
    6. 8.6. Cable Management Accessories Market – Attractiveness Analysis
      1. 8.6.1. By Product Type
      2. 8.6.2. By End-User
      3. 8.6.3. By Region
  9. Chapter 9 Raw Material Analysis
    1. 9.1. Cable Management Accessories Key Raw Material Analysis
      1. 9.1.1. Key Raw Materials
      2. 9.1.2. Price Trend of Key Raw Materials
    2. 9.2. Key Suppliers of Raw Materials
    3. 9.3. Proportion of Manufacturing Cost Structure
      1. 9.3.1. Raw Materials Cost
      2. 9.3.2. Labor Cost
      3. 9.3.3. Manufacturing Expenses
      4. 9.3.4. Miscellaneous Expenses
    4. 9.4. Manufacturing Cost Analysis of Cable Management Accessories
  10. Chapter 10 Industrial Chain, Sourcing Strategy, and Downstream Buyers
    1. 10.1. Cable Management Accessories Industrial Chain Analysis
    2. 10.2. Upstream Raw Materials Sourcing
      1. 10.2.1. Risk Mitigation:
      2. 10.2.2. Supplier Relationships:
      3. 10.2.3. Business Processes:
      4. 10.2.4. Securing the Product:
    3. 10.3. Raw Materials Sources of Cable Management Accessories Major Manufacturers
    4. 10.4. Downstream Buyers
    5. 10.5. Distributors/Traders List
  11. Chapter 11 Marketing Strategy Analysis, Distributors
    1. 11.1. Marketing Channel
    2. 11.2. Direct Marketing
    3. 11.3. Indirect Marketing
    4. 11.4. Marketing Channel Development Trends
    5. 11.5. Economic/Political Environmental Change
  12. Chapter 12 Report Conclusion & Key Insights
    1. 12.1. Key Insights from Primary Interviews & Surveys Respondents
    2. 12.2. Key Takeaways from Analysts, Consultants, and Industry Leaders
  13. Chapter 13 Research Approach & Methodology
    1. 13.1. Report Description
    2. 13.2. Research Scope
    3. 13.3. Research Methodology
      1. 13.3.1. Secondary Research
      2. 13.3.2. Primary Research
      3. 13.3.3. Statistical Models
        1. 13.3.3.1. Company Share Analysis Model
        2. 13.3.3.2. Revenue Based Modeling
      4. 13.3.4. Research Limitations

      List of Figures

      Fig.1	Product Picture of Cable Management Accessories
      Fig.2	Global Cable Management Accessories Market,  2016 – 2026 (USD Billion)
      Fig.3	Global Cable Management Accessories Market,  2016 – 2026  
      Fig.4	Global Cable Management Accessories Market Absolute Revenue Opportunity,  2016 – 2026 (USD Billion)
      Fig.5	Global Cable Management Accessories Market Incremental Revenue Opportunity, 2020 – 2026 (USD Billion)
      Fig.6	Global Cable Management Accessories Market Share, by Product Type, 2020 & 2026 (USD Billion)
      Fig.7	Global Cable Management Accessories Market Share, by Product Type, 2020 & 2026  
      Fig.8	Global Cable Lung Cable Management Accessories Market,  2016 – 2026 (USD Billion)
      Fig.9	Global Cable Lung Cable Management Accessories Market,  2016 – 2026  
      Fig.10	Global Cable Marker Cable Management Accessories Market,  2016 – 2026 (USD Billion)
      Fig.11	Global Cable Marker Cable Management Accessories Market,  2016 – 2026  
      Fig.12	Global Heat Shrink Tube Cable Management Accessories Market,  2016 – 2026 (USD Billion)
      Fig.13	Global Heat Shrink Tube Cable Management Accessories Market,  2016 – 2026  
      Fig.14	Global Others Cable Management Accessories Market,  2016 – 2026 (USD Billion)
      Fig.15	Global Others Cable Management Accessories Market,  2016 – 2026  
      Fig.16	Global Cable Management Accessories Market Share, by End-User, 2020 & 2026 (USD Billion)
      Fig.17	Global Cable Management Accessories Market Share, by End-User, 2020 & 2026  
      Fig.18	Global IT and Telecom Cable Management Accessories Market,  2016 – 2026 (USD Billion)
      Fig.19	Global IT and Telecom Cable Management Accessories Market,  2016 – 2026  
      Fig.20	Global Manufacturing Cable Management Accessories Market,  2016 – 2026 (USD Billion)
      Fig.21	Global Manufacturing Cable Management Accessories Market,  2016 – 2026  
      Fig.22	Global Energy & Utility Cable Management Accessories Market,  2016 – 2026 (USD Billion)
      Fig.23	Global Energy & Utility Cable Management Accessories Market,  2016 – 2026  
      Fig.24	Global Health Care Cable Management Accessories Market,  2016 – 2026 (USD Billion)
      Fig.25	Global Health Care Cable Management Accessories Market,  2016 – 2026  
      Fig.26	Global Logistics and Transportation Cable Management Accessories Market,  2016 – 2026 (USD Billion)
      Fig.27	Global Logistics and Transportation Cable Management Accessories Market,  2016 – 2026  
      Fig.28	Global Mining Cable Management Accessories Market,  2016 – 2026 (USD Billion)
      Fig.29	Global Mining Cable Management Accessories Market,  2016 – 2026  
      Fig.30	Global Oil & Gas Cable Management Accessories Market,  2016 – 2026 (USD Billion)
      Fig.31	Global Oil & Gas Cable Management Accessories Market,  2016 – 2026  
      Fig.32	Global Construction Cable Management Accessories Market,  2016 – 2026 (USD Billion)
      Fig.33	Global Construction Cable Management Accessories Market,  2016 – 2026  
      Fig.34	Global Others Cable Management Accessories Market,  2016 – 2026 (USD Billion)
      Fig.35	Global Others Cable Management Accessories Market,  2016 – 2026  
      Fig.36	Global Cable Management Accessories Market Share, by Region, 2020 & 2026 (USD Billion)
      Fig.37	Global Cable Management Accessories Market Share, by Region, 2020 & 2026  
      Fig.38	North America Cable Management Accessories Market,  2016 – 2026 (USD Billion)
      Fig.39	North America Cable Management Accessories Market,  2016 – 2026  
      Fig.40	U.S. Cable Management Accessories Market,  2016 – 2026 (USD Billion)
      Fig.41	U.S. Cable Management Accessories  Market,  2016 – 2026  
      Fig.42	Canada Cable Management Accessories Market,  2016 – 2026 (USD Billion)
      Fig.43	Canada Cable Management Accessories  Market,  2016 – 2026  
      Fig.44	Europe Cable Management Accessories Market,  2016 – 2026 (USD Billion)
      Fig.45	Europe Cable Management Accessories Market,  2016 – 2026  
      Fig.46	Germany Cable Management Accessories Market,  2016 – 2026 (USD Billion)
      Fig.47	Germany Cable Management Accessories  Market,  2016 – 2026  
      Fig.48	France Cable Management Accessories Market,  2016 – 2026 (USD Billion)
      Fig.49	France Cable Management Accessories  Market,  2016 – 2026  
      Fig.50	U.K. Cable Management Accessories Market,  2016 – 2026 (USD Billion)
      Fig.51	U.K. Cable Management Accessories  Market,  2016 – 2026  
      Fig.52	Italy Cable Management Accessories Market,  2016 – 2026 (USD Billion)
      Fig.53	Italy Cable Management Accessories  Market,  2016 – 2026  
      Fig.54	Spain Cable Management Accessories Market,  2016 – 2026 (USD Billion)
      Fig.55	Spain Cable Management Accessories  Market,  2016 – 2026  
      Fig.56	Rest of Europe Cable Management Accessories Market,  2016 – 2026 (USD Billion)
      Fig.57	Rest of Europe Cable Management Accessories  Market,  2016 – 2026  
      Fig.58	Asia Pacific Cable Management Accessories Market,  2016 – 2026 (USD Billion)
      Fig.59	Asia Pacific Cable Management Accessories Market,  2016 – 2026  
      Fig.60	China Cable Management Accessories Market,  2016 – 2026 (USD Billion)
      Fig.61	China Cable Management Accessories  Market,  2016 – 2026  
      Fig.62	Japan Cable Management Accessories Market,  2016 – 2026 (USD Billion)
      Fig.63	Japan Cable Management Accessories  Market,  2016 – 2026  
      Fig.64	India Cable Management Accessories Market,  2016 – 2026 (USD Billion)
      Fig.65	India Cable Management Accessories  Market,  2016 – 2026  
      Fig.66	South  Korea Cable Management Accessories Market,  2016 – 2026 (USD Billion)
      Fig.67	South  Korea Cable Management Accessories  Market,  2016 – 2026  
      Fig.68	South-East Asia Cable Management Accessories Market,  2016 – 2026 (USD Billion)
      Fig.69	South-East Asia Cable Management Accessories  Market,  2016 – 2026  
      Fig.70	Rest of Asia Pacific Cable Management Accessories Market,  2016 – 2026 (USD Billion)
      Fig.71	Rest of Asia Pacific Cable Management Accessories  Market,  2016 – 2026  
      Fig.72	Latin America Cable Management Accessories Market,  2016 – 2026 (USD Billion)
      Fig.73	Latin America Cable Management Accessories Market,  2016 – 2026  
      Fig.74	Brazil Cable Management Accessories Market,  2016 – 2026 (USD Billion)
      Fig.75	Brazil Cable Management Accessories  Market,  2016 – 2026  
      Fig.76	Mexico Cable Management Accessories Market,  2016 – 2026 (USD Billion)
      Fig.77	Mexico Cable Management Accessories  Market,  2016 – 2026  
      Fig.78	Rest of Latin America Cable Management Accessories Market,  2016 – 2026 (USD Billion)
      Fig.79	Rest of Latin America Cable Management Accessories  Market,  2016 – 2026  
      Fig.80	The Middle-East and Africa Cable Management Accessories Market,  2016 – 2026 (USD Billion)
      Fig.81	The Middle-East and Africa Cable Management Accessories Market,  2016 – 2026  
      Fig.82	GCC Countries Cable Management Accessories Market,  2016 – 2026 (USD Billion)
      Fig.83	GCC Countries Cable Management Accessories  Market,  2016 – 2026  
      Fig.84	South Africa Cable Management Accessories Market,  2016 – 2026 (USD Billion)
      Fig.85	South Africa Cable Management Accessories  Market,  2016 – 2026  
      Fig.86	Rest of Middle-East Africa Cable Management Accessories Market,  2016 – 2026 (USD Billion)
      Fig.87	Rest of Middle-East Africa Cable Management Accessories  Market,  2016 – 2026  
      Fig.88	Global Cable Management Accessories Production and Consumption,  2016 – 2026  
      Fig.89	North America Cable Management Accessories Production and Consumption,  2016 – 2026 (USD Billion)  
      Fig.90	Europe Cable Management Accessories Production and Consumption,  2016 – 2026 (USD Billion)  
      Fig.91	Asia Pacific Cable Management Accessories Production and Consumption,  2016 – 2026 (USD Billion)  
      Fig.92	Latin America Cable Management Accessories Production and Consumption,  2016 – 2026 (USD Billion)  
      Fig.93	The Middle-East and Africa Cable Management Accessories Production and Consumption,  2016 – 2026 (USD Billion)  
      Fig.94	Competitor Market Share – Revenue
      Fig.95	Competitor Market Share – Volume
      Fig.96	Legrand Revenue and Growth Rate
      Fig.97	Legrand Market Share
      Fig.98	Eaton Revenue and Growth Rate
      Fig.99	Eaton Market Share
      Fig.100	Obo Bettermann Revenue and Growth Rate
      Fig.101	Obo Bettermann Market Share
      Fig.102	Panduit Revenue and Growth Rate
      Fig.103	Panduit Market Share
      Fig.104	Atkore Revenue and Growth Rate
      Fig.105	Atkore Market Share
      Fig.106	Partex Marking Systems Revenue and Growth Rate
      Fig.107	Partex Marking Systems Market Share
      Fig.108	Schneider Electric SE Revenue and Growth Rate
      Fig.109	Schneider Electric SE Market Share
      Fig.110	Chatsworth Products Inc. Revenue and Growth Rate
      Fig.111	Chatsworth Products Inc. Market Share
      Fig.112	Weidmuller Interface GnbH & Co. KG Revenue and Growth Rate
      Fig.113	Weidmuller Interface GnbH & Co. KG Market Share
      Fig.114	Thomas & Betts Corporation Revenue and Growth Rate
      Fig.115	Thomas & Betts Corporation Market Share
      Fig.116	Anixter Inc. Revenue and Growth Rate
      Fig.117	Anixter Inc. Market Share
      Fig.118	Hellermann Tyton Group PLC Revenue and Growth Rate
      Fig.119	Hellermann Tyton Group PLC Market Share
      Fig.120	Panduit Copr. Revenue and Growth Rate
      Fig.121	Panduit Copr. Market Share
      Fig.122	Others Revenue and Growth Rate
      Fig.123	Others Market Share
      Fig.124	Market Dynamics
      Fig.125	Global Cable Management Accessories – Value Chain Analysis
      Fig.126	Key Mandates and Regulations
      Fig.127	Technology Roadmap and Timeline
      Fig.128	Market Attractiveness Analysis – By Product Type
      Fig.129	Market Attractiveness Analysis – By End-User
      Fig.130	Market Attractiveness Analysis – By Region
      Fig.131	Manufacturing Cost Structure of Cable Management Accessories
      Fig.132	Cable Management Accessories Industrial Chain Analysis
      Fig.133	Market Channels
      Fig.134	Marketing Channel Development Trend
      Fig.135	Growth in World Gross Product, 2008-2018
      

      List of Tables

      Table 1	Global Cable Management Accessories Market, 2020 & 2026 (USD Billion)
      Table 2	Global Cable Management Accessories Market, by Product Type,  2016 – 2026 (USD Billion)
      Table 3	Global Cable Management Accessories Market, by Product Type,  2016 – 2026  
      Table 4	Global Cable Management Accessories Market, by End-User,  2016 – 2026 (USD Billion)
      Table 5	Global Cable Management Accessories Market, by End-User,  2016 – 2026  
      Table 6	Global Cable Management Accessories Market, by Region,  2016 – 2026 (USD Billion)
      Table 7	Global Cable Management Accessories Market, by Region,  2016 – 2026  
      Table 8	North America Cable Management Accessories Market, by Country,  2016 – 2026 (USD Billion)
      Table 9	North America Cable Management Accessories Market, by Country,  2016 – 2026  
      Table 10 North America Cable Management Accessories Market, by Product Type,  2016 – 2026 (USD Billion)
      Table 11 North America Cable Management Accessories Market, by Product Type,  2016 – 2026  
      Table 12 North America Cable Management Accessories Market, by End-User,  2016 – 2026 (USD Billion)
      Table 13 North America Cable Management Accessories Market, by End-User,  2016 – 2026  
      Table 14 Europe Cable Management Accessories Market, by Country,  2016 – 2026 (USD Billion)
      Table 15 Europe Cable Management Accessories Market, by Country,  2016 – 2026  
      Table 16 Europe Cable Management Accessories Market, by Product Type,  2016 – 2026 (USD Billion)
      Table 17 Europe Cable Management Accessories Market, by Product Type,  2016 – 2026  
      Table 18 Europe Cable Management Accessories Market, by End-User,  2016 – 2026 (USD Billion)
      Table 19 Europe Cable Management Accessories Market, by End-User,  2016 – 2026  
      Table 20 Asia Pacific Cable Management Accessories Market, by Country,  2016 – 2026 (USD Billion)
      Table 21 Asia Pacific Cable Management Accessories Market, by Country,  2016 – 2026  
      Table 22 Asia Pacific Cable Management Accessories Market, by Product Type,  2016 – 2026 (USD Billion)
      Table 23 Asia Pacific Cable Management Accessories Market, by Product Type,  2016 – 2026  
      Table 24 Asia Pacific Cable Management Accessories Market, by End-User,  2016 – 2026 (USD Billion)
      Table 25 Asia Pacific Cable Management Accessories Market, by End-User,  2016 – 2026  
      Table 26 Latin America Cable Management Accessories Market, by Country,  2016 – 2026 (USD Billion)
      Table 27 Latin America Cable Management Accessories Market, by Country,  2016 – 2026  
      Table 28 Latin America Cable Management Accessories Market, by Product Type,  2016 – 2026 (USD Billion)
      Table 29 Latin America Cable Management Accessories Market, by Product Type,  2016 – 2026  
      Table 30 Latin America Cable Management Accessories Market, by End-User,  2016 – 2026 (USD Billion)
      Table 31 Latin America Cable Management Accessories Market, by End-User,  2016 – 2026  
      Table 32 The Middle-East and Africa Cable Management Accessories Market, by Country,  2016 – 2026 (USD Billion)
      Table 33 The Middle-East and Africa Cable Management Accessories Market, by Country,  2016 – 2026  
      Table 34 The Middle-East and Africa Cable Management Accessories Market, by Product Type,  2016 – 2026 (USD Billion)
      Table 35 The Middle-East and Africa Cable Management Accessories Market, by Product Type,  2016 – 2026  
      Table 36 The Middle-East and Africa Cable Management Accessories Market, by End-User,  2016 – 2026 (USD Billion)
      Table 37 The Middle-East and Africa Cable Management Accessories Market, by End-User,  2016 – 2026  
      Table 38 North America Cable Management Accessories Production, Consumption, Export, Import, 2016 – 2020
      Table 39 Europe Cable Management Accessories Production, Consumption, Export, Import, 2016 – 2020
      Table 40 Asia Pacific Cable Management Accessories Production, Consumption, Export, Import, 2016 – 2020
      Table 41 Latin America Cable Management Accessories Production, Consumption, Export, Import, 2016 – 2020
      Table 42 The Middle-East and Africa Cable Management Accessories Production, Consumption, Export, Import, 2016 – 2020
      Table 43 Global Cable Management Accessories Market - Company Revenue Analysis, 2016 – 2020 (USD Billion)
      Table 44 Global Cable Management Accessories Market - Company Revenue Share Analysis, 2016 – 2020 (%)
      Table 45 Global Cable Management Accessories Market - Company Volume Analysis, 2016 – 2020  
      Table 46 Global Cable Management Accessories Market - Company Volume Share Analysis, 2016 – 2020 (%)
      Table 47 Acquisitions and Mergers
      Table 48 Market Drivers – Impact Analysis
      Table 49 Market Restraints
      Table 50 Market Opportunities
      Table 51 Production Base and Market Concentration Rate of Raw Material
      Table 52 Key Suppliers of Raw Materials
      Table 53 Raw Materials Sources of Cable Management Accessories Major Manufacturers
      Table 54 Major Buyers of Cable Management Accessories
      Table 55 Distributors/Traders of Cable Management Accessories by Region
      

Industry Major Market Players

  • Legrand
  • Eaton
  • Obo Bettermann
  • Panduit
  • Atkore
  • Partex Marking Systems
  • Schneider Electric SE
  • Chatsworth Products Inc.
  • Weidmuller Interface GnbH & Co. KG
  • Thomas & Betts Corporation
  • Anixter Inc.
  • Hellermann Tyton Group PLC
  • Panduit Copr.