Search Market Research Report

Discover Our Latest Reports
Discover Our Featured Reports
Discover Top Selling Reports

C9 Solvent Market Size, Share Global Analysis Report, 2020–2026

report img

C9 Solvent Market By Type (Benzene, 1,2,4-trimethyl, Benzene, 1,3,5-trimethyl Benzene, ethylmethyl (ethyltoluene mixed isomers), Solvent naphtha, (petroleum), light aromatic), By Application (Pharmaceuticals, Oilfield Chemicals, Automotive, Paints and Coatings, and Others): Global Industry Outlook, Market Size, Business Intelligence, Consumer Preferences, Statistical Surveys, Comprehensive Analysis, Historical Developments, Current Trends, and Forecast 2020–2026

Industry Insights

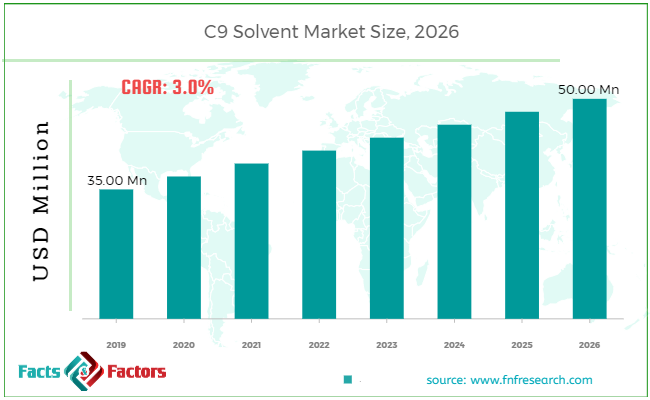
[198+ Pages Report] According to the report published by Facts Factors, the global C9 solvent market size was worth around USD 35.00 million in 2019 and is predicted to grow to around USD 50.00 million by 2026 with a compound annual growth rate (CAGR) of roughly 3.0% between 2020 and 2026. The report analyzes the global C9 solvent market drivers, restraints/challenges, and the effect they have on the demands during the projection period. In addition, the report explores emerging opportunities in the C9 solvent market.

C9 Solvent Market Size

To know more about this report | Request Free Sample Copy

This specialized and expertise oriented industry research report scrutinizes the technical and commercial business outlook of the C9 Solvent industry. The report analyzes and declares the historical and current trends analysis of the C9 Solvent industry and subsequently recommends the projected trends anticipated to be observed in the C9 Solvent market during the upcoming years.

The C9 Solvent market report analyzes and notifies the industry statistics at the global as well as regional and country levels in order to acquire a thorough perspective of the entire C9 Solvent market. The historical and past insights are provided for FY 2016 to FY 2019 whereas projected trends are delivered for FY 2020 to FY 2026. The quantitative and numerical data is represented in terms of value (USD Million) and volume (Kilotons) from FY 2016 – 2026.


logoKey Insights from Primary Research

  • As per our primary respondents, the China C9 solvent market is set to grow annually at a rate of around 3.0%
  • It was established through primary research that the China C9 solvent market was valued at more than USD 35.00 million in 2019
  • The increasing demand for C9 solvent from various industries in China is supposed to display the highest growth in the regional market as it is one of the developed economies.
  • Innovation in C9 solvent is supposed to fuel market growth. The companies are supposed to invest in R&D to innovate the better product. Product invention will open new opportunities for the C9 solvent thus is expected to propel the industry demand in the upcoming years.
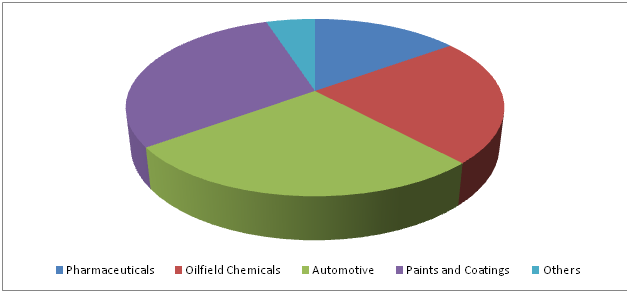
  • The “Solvent naphtha, (petroleum), light aromatic” category, on the basis of type segmentation, was the leading revenue-generating category share, in 2019.
  • The “Paints and Coatings” category, on the basis of application segmentation, was the leading revenue-generating share, in 2019.

logoKey Recommendations from Analysts

  • The increasing intake of C9 solvent, increasing demand from the Automotive,  paints and coatings industries, in the various countries across the globe, is increasing the demand for the C9 solvent segment. There is a huge demand for C9 solvent in developing regions such as the Asia Pacific, which is driving the pharmaceuticals, oilfield chemicals, automotive, paints and coatings industries in the regions.
  • Asia Pacific region is anticipated to a larger share of the C9 solvent market in the upcoming years.
  • China's C9 solvent market is anticipated to rise at the highest rate between 2020 and 2026.
  • Growing at a CAGR around 4.0%, China C9 solvent market offers several opportunities for all of the involved investors crosswise the entire value chain
  • Our analysts have identified “Solvent naphtha, (petroleum), light aromatic”, and “Paints and Coatings” categories as the leading investment pockets for the C9 solvent market in terms of type and application segmentation respectively.

logoGlobal C9 solvent Market Revenue Share In 2019– By Application

C9 Solvent Market

To know more about this report | Request Free Sample Copy


The quantitative data is further underlined and reinforced by comprehensive qualitative data which comprises various across-the-board market dynamics. The rationales which directly or indirectly impact the C9 Solvent industry are exemplified through parameters such as growth drivers, restraints, challenges, and opportunities among other impacting factors.

Throughout our research report, we have encompassed all the proven models and tools of industry analysis and extensively illustrated all the key business strategies and business models adopted in the C9 Solvent industry. The report provides an all-inclusive and detailed competitive landscape prevalent in the C9 Solvent market.

The report utilizes established industry analysis tools and models such as Porter’s Five Forces framework to analyze and recognize critical business strategies adopted by various stakeholders involved in the entire value chain of the C9 Solvent industry. The C9 Solvent market report additionally employs SWOT analysis and PESTLE analysis models for further in-depth analysis.

The report study further includes an in-depth analysis of industry players' market shares and provides an overview of leading players' market position in the C9 Solvent sector. Key strategic developments in the C9 Solvent market competitive landscape such as acquisitions & mergers, inaugurations of different products and services, partnerships & joint ventures, MoU agreements, VC & funding activities, R&D activities, and geographic expansion among other noteworthy activities by key players of the C9 Solvent market are appropriately highlighted in the report.

The global C9 Solvent market is experiencing significant growth that is expected to continue over the upcoming years. A massive rise in the demand for C9 Solvent in the paints & coatings industry sectors is likely to act as a key driver of the global C9 Solvent market.

The C9 Solvent market research report delivers an acute valuation and taxonomy of the C9 Solvent industry by practically splitting the market on the basis of a different type, and application, and region. Through the analysis of the historical and projected trends, all the segments and sub-segments were evaluated through the bottom-up approach, and different market sizes have been projected for FY 2020 to FY 2026.

logoReport Scope

Report Attribute

Details

Market Size in 2019

USD 35.00 Million

Projected Market Size in 2026

USD 50.00 Million

CAGR Growth Rate

3.0% CAGR

Base Year

2019

Forecast Years

2020-2026

Key Market Players

Chevron Phillips Chemicals Company, Arham Petrochem, Eastman Chemical Company, DEZA, Galp Energia, Exxon Mobil, Hanwha Group, Ganga Rasayanie, Kandla Energy & Chemicals, Jiangsu Hualun, Monument Chemical, Korea Petrochemical Ind, Reliance Industries, Pampa Energa, SK global chemical, Shell International, Total, S-OIL CORPORATION, and VIRENT, and Others

Key Segment

By Product, Application, and Region

Major Regions Covered

North America, Europe, Asia Pacific, Latin America, and the Middle East & Africa

Purchase Options

Request customized purchase options to meet your research needs.Explore purchase options

The regional segmentation of the C9 Solvent industry includes the complete classification of all the major continents including North America, Latin America, Europe, Asia Pacific, and the Middle East & Africa. Further, country-wise data for the C9 Solvent industry is provided for the leading economies of the world.

The C9 Solvent market is segmented based on type and application. On the basis of type segmentation, the market is classified into Benzene, 1,2,4-trimethyl, Benzene, 1,3,5-trimethyl, Benzene, ethylmethyl (ethyltoluene mixed isomers), and Solvent naphtha, (petroleum), light aromatic. In terms of application segmentation, the market is bifurcated into Pharmaceuticals, Oilfield Chemicals, Automotive, Paints and coatings, and others.

logoSome of the leading players in the global market include

  •  Arham Petrochem
  •  Chevron Phillips Chemicals Company
  •  DEZA
  •  Eastman Chemical Company
  •  Exxon Mobil
  •  Galp Energia
  •  Ganga Rasayanie
  •  Hanwha Group
  •  Jiangsu Hualun
  •  Kandla Energy & Chemicals
  •  Korea Petrochemical Ind
  •  Monument Chemical
  •  Pampa Energa
  •  Reliance Industries
  •  Shell International
  •  SK global chemical
  •  S-OIL CORPORATION
  •  Total
  •  VIRENT

The taxonomy of the C9 Solvent industry by its scope and segmentation is as follows:

logoBy Type Analysis

  • Benzene, 1,2,4-trimethyl
  • Benzene, 1,3,5-trimethyl
  • Benzene, ethylmethyl (ethyltoluene mixed isomers)
  • Solvent naphtha, (petroleum), light aromatic

logoBy Application Analysis

  • Pharmaceuticals
  • Oilfield Chemicals
  • Automotive
  • Paints and coatings
  • Others

logoBy Regional Segmentation Analysis

  • North America
    • The U.S.
    • Canada
  • Europe
    • Germany
    • The UK
    • France
    • Spain
    • Italy
    • Rest of Europe
  • Asia Pacific
    • China
    • Japan
    • India
    • South Korea
    • Southeast Asia
    • Rest of Asia Pacific
  • Latin America
    • Brazil
    • Mexico
    • Rest of Latin America
  • Middle East & Africa
    • GCC
    • South Africa
    • Rest of Middle East & Africa

Table of Content

  1. CHAPTER 1. Executive Summary
  2. CHAPTER 2. C9 Solvents market – Type Analysis
    1. 2.1. Global C9 Solvents Market – Type Overview
    2. 2.2. Global C9 Solvents Market Share, by Type, 2019 & 2026 (USD Million)
    3. 2.3. Global C9 Solvents Market share, by Type, 2019 & 2026 (Kilotons)
    4. 2.4. Benzene, 1,2,4-trimethyl
      1. 2.4.1. Global Benzene, 1,2,4-trimethyl C9 Solvents Market, 2016-2026 (USD Million)
      2. 2.4.2. Global Benzene, 1,2,4-trimethyl C9 Solvents Market, 2016-2026 (Kilotons)
    5. 2.5. Benzene, 1,3,5-trimethyl
      1. 2.5.1. Global Benzene, 1,3,5-trimethyl C9 Solvents Market, 2016-2026 (USD Million)
      2. 2.5.2. Global Benzene, 1,3,5-trimethyl C9 Solvents Market, 2016-2026 (Kilotons)
    6. 2.6. Benzene, ethylmethyl (ethyltoluene mixed isomers)
      1. 2.6.1. Global Benzene, ethylmethyl (ethyltoluene mixed isomers) C9 Solvents Market, 2016-2026 (USD Million)
      2. 2.6.2. Global Benzene, ethylmethyl (ethyltoluene mixed isomers) C9 Solvents Market, 2016-2026 (Kilotons)
    7. 2.7. Solvent naphtha, (petroleum), light aromatic
      1. 2.7.1. Global Solvent naphtha, (petroleum), light aromatic C9 Solvents Market, 2016-2026 (USD Million)
      2. 2.7.2. Global Solvent naphtha, (petroleum), light aromatic C9 Solvents Market, 2016-2026 (Kilotons)
  3. CHAPTER 3. C9 Solvents market – Application Analysis
    1. 3.1. Global C9 Solvents Market – Application Overview
    2. 3.2. Global C9 Solvents Market Share, by Application, 2019 & 2026 (USD Million)
    3. 3.3. Global C9 Solvents Market share, by Application, 2019 & 2026 (Kilotons)
    4. 3.4. Pharmaceuticals
      1. 3.4.1. Global Pharmaceuticals C9 Solvents Market, 2016-2026 (USD Million)
      2. 3.4.2. Global Pharmaceuticals C9 Solvents Market, 2016-2026 (Kilotons)
    5. 3.5. Oilfield Chemicals
      1. 3.5.1. Global Oilfield Chemicals C9 Solvents Market, 2016-2026 (USD Million)
      2. 3.5.2. Global Oilfield Chemicals C9 Solvents Market, 2016-2026 (Kilotons)
    6. 3.6. Automotive
      1. 3.6.1. Global Automotive C9 Solvents Market, 2016-2026 (USD Million)
      2. 3.6.2. Global Automotive C9 Solvents Market, 2016-2026 (Kilotons)
    7. 3.7. Paints and Coatings
      1. 3.7.1. Global Paints and Coatings C9 Solvents Market, 2016-2026 (USD Million)
      2. 3.7.2. Global Paints and Coatings C9 Solvents Market, 2016-2026 (Kilotons)
    8. 3.8. Others
      1. 3.8.1. Global Others C9 Solvents Market, 2016-2026 (USD Million)
      2. 3.8.2. Global Others C9 Solvents Market, 2016-2026 (Kilotons)
  4. CHAPTER 4. C9 Solvents market – Regional Analysis
    1. 4.1. Global C9 Solvents Market Regional Overview
    2. 4.2. Global C9 Solvents Market Share, by Region, 2019 & 2026 (Value)
    3. 4.3. Global C9 Solvents Market Share, by Region, 2019 & 2026 (Volume)
    4. 4.4. North America
      1. 4.4.1. North America C9 Solvents Market size and forecast, 2016-2026
      2. 4.4.2. North America C9 Solvents Market, by Country, 2019 - 2026 (USD Million)
      3. 4.4.3. North America Market size and forecast, 2016-2026 (Kilotons)
      4. 4.4.4. North America C9 Solvents Market, by Country, 2019 - 2026 (Kilotons)
      5. 4.4.5. North America C9 Solvents Market, by Type, 2016-2026
        1. 4.4.5.1. North America C9 Solvents Market, by Type, 2016-2026 (USD Million)
        2. 4.4.5.2. North America C9 Solvents Market, by Type, 2016-2026 (Kilotons)
      6. 4.4.6. North America C9 Solvents Market, by Application, 2016-2026
        1. 4.4.6.1. North America C9 Solvents Market, by Application, 2016-2026 (USD Million)
        2. 4.4.6.2. North America C9 Solvents Market, by Application, 2016-2026 (Kilotons)
      7. 4.4.7. U.S.
        1. 4.4.7.1. U.S. Market size and forecast, 2016-2026 (USD Million)
        2. 4.4.7.2. U.S. Market size and forecast, 2016-2026 (Kilotons)
      8. 4.4.8. Canada
        1. 4.4.8.1. Canada Market size and forecast, 2016-2026 (USD Million)
        2. 4.4.8.2. Canada Market size and forecast, 2016-2026 (Kilotons)
    5. 4.5. Europe
      1. 4.5.1. Europe C9 Solvents Market size and forecast, 2016-2026
      2. 4.5.2. Europe C9 Solvents Market, by Country, 2019 - 2026 (USD Million)
      3. 4.5.3. Europe Market size and forecast, 2016-2026 (Kilotons)
      4. 4.5.4. Europe C9 Solvents Market, by Country, 2019 - 2026 (Kilotons)
      5. 4.5.5. Europe C9 Solvents Market, by Type, 2016-2026
        1. 4.5.5.1. Europe C9 Solvents Market, by Type, 2016-2026 (USD Million)
        2. 4.5.5.2. Europe C9 Solvents Market, by Type, 2016-2026 (Kilotons)
      6. 4.5.6. Europe C9 Solvents Market, by Application, 2016-2026
        1. 4.5.6.1. Europe C9 Solvents Market, by Application, 2016-2026 (USD Million)
        2. 4.5.6.2. Europe C9 Solvents Market, by Application, 2016-2026 (Kilotons)
      7. 4.5.7. Germany
        1. 4.5.7.1. Germany Market size and forecast, 2016-2026 (USD Million)
        2. 4.5.7.2. Germany Market size and forecast, 2016-2026 (Kilotons)
      8. 4.5.8. France
        1. 4.5.8.1. France Market size and forecast, 2016-2026 (USD Million)
        2. 4.5.8.2. France Market size and forecast, 2016-2026 (Kilotons)
      9. 4.5.9. U.K.
        1. 4.5.9.1. U.K. Market size and forecast, 2016-2026 (USD Million)
        2. 4.5.9.2. U.K. Market size and forecast, 2016-2026 (Kilotons)
      10. 4.5.10. Italy
        1. 4.5.10.1. Italy Market size and forecast, 2016-2026 (USD Million)
        2. 4.5.10.2. Italy Market size and forecast, 2016-2026 (Kilotons)
      11. 4.5.11. Spain
        1. 4.5.11.1. Spain Market size and forecast, 2016-2026 (USD Million)
        2. 4.5.11.2. Spain Market size and forecast, 2016-2026 (Kilotons)
      12. 4.5.12. Rest of Europe
        1. 4.5.12.1. Rest of Europe Market size and forecast, 2016-2026 (USD Million)
        2. 4.5.12.2. Rest of Europe Market size and forecast, 2016-2026 (Kilotons)
    6. 4.6. Asia Pacific
      1. 4.6.1. Asia Pacific C9 Solvents Market size and forecast, 2016-2026
      2. 4.6.2. Asia Pacific C9 Solvents Market, by Country, 2019 - 2026 (USD Million)
      3. 4.6.3. Asia Pacific Market size and forecast, 2016-2026 (Kilotons)
      4. 4.6.4. Asia Pacific C9 Solvents Market, by Country, 2019 - 2026 (Kilotons)
      5. 4.6.5. Asia Pacific C9 Solvents Market, by Type, 2016-2026
        1. 4.6.5.1. Asia Pacific C9 Solvents Market, by Type, 2016-2026 (USD Million)
        2. 4.6.5.2. Asia Pacific C9 Solvents Market, by Type, 2016-2026 (Kilotons)
      6. 4.6.6. Asia Pacific C9 Solvents Market, by Application, 2016-2026
        1. 4.6.6.1. Asia Pacific C9 Solvents Market, by Application, 2016-2026 (USD Million)
        2. 4.6.6.2. Asia Pacific C9 Solvents Market, by Application, 2016-2026 (Kilotons)
      7. 4.6.7. China
        1. 4.6.7.1. China Market size and forecast, 2016-2026 (USD Million)
        2. 4.6.7.2. China Market size and forecast, 2016-2026 (Kilotons)
      8. 4.6.8. Japan
        1. 4.6.8.1. Japan Market size and forecast, 2016-2026 (USD Million)
        2. 4.6.8.2. Japan Market size and forecast, 2016-2026 (Kilotons)
      9. 4.6.9. India
        1. 4.6.9.1. India Market size and forecast, 2016-2026 (USD Million)
        2. 4.6.9.2. India Market size and forecast, 2016-2026 (Kilotons)
      10. 4.6.10. South Korea
        1. 4.6.10.1. South Korea Market size and forecast, 2016-2026 (USD Million)
        2. 4.6.10.2. South Korea Market size and forecast, 2016-2026 (Kilotons)
      11. 4.6.11. South-East Asia
        1. 4.6.11.1. South-East Asia Market size and forecast, 2016-2026 (USD Million)
        2. 4.6.11.2. South-East Asia Market size and forecast, 2016-2026 (Kilotons)
      12. 4.6.12. Rest of Asia Pacific
        1. 4.6.12.1. Rest of Asia Pacific Market size and forecast, 2016-2026 (USD Million)
        2. 4.6.12.2. Rest of Asia Pacific Market size and forecast, 2016-2026 (Kilotons)
    7. 4.7. Latin America
      1. 4.7.1. Latin America C9 Solvents Market size and forecast, 2016-2026
      2. 4.7.2. Latin America C9 Solvents Market, by Country, 2019 - 2026 (USD Million)
      3. 4.7.3. Latin America Market size and forecast, 2016-2026 (Kilotons)
      4. 4.7.4. Latin America C9 Solvents Market, by Country, 2019 - 2026 (Kilotons)
      5. 4.7.5. Latin America C9 Solvents Market, by Type, 2016-2026
        1. 4.7.5.1. Latin America C9 Solvents Market, by Type, 2016-2026 (USD Million)
        2. 4.7.5.2. Latin America C9 Solvents Market, by Type, 2016-2026 (Kilotons)
      6. 4.7.6. Latin America C9 Solvents Market, by Application, 2016-2026
        1. 4.7.6.1. Latin America C9 Solvents Market, by Application, 2016-2026 (USD Million)
        2. 4.7.6.2. Latin America C9 Solvents Market, by Application, 2016-2026 (Kilotons)
      7. 4.7.7. Brazil
        1. 4.7.7.1. Brazil Market size and forecast, 2016-2026 (USD Million)
        2. 4.7.7.2. Brazil Market size and forecast, 2016-2026 (Kilotons)
      8. 4.7.8. Mexico
        1. 4.7.8.1. Mexico Market size and forecast, 2016-2026 (USD Million)
        2. 4.7.8.2. Mexico Market size and forecast, 2016-2026 (Kilotons)
      9. 4.7.9. Rest of Latin America
        1. 4.7.9.1. Rest of Latin America Market size and forecast, 2016-2026 (USD Million)
        2. 4.7.9.2. Rest of Latin America Market size and forecast, 2016-2026 (Kilotons)
    8. 4.8. The Middle-East and Africa
      1. 4.8.1. The Middle-East and Africa C9 Solvents Market size and forecast, 2016-2026
      2. 4.8.2. The Middle-East and Africa C9 Solvents Market, by Country, 2019 - 2026 (USD Million)
      3. 4.8.3. The Middle-East and Africa Market size and forecast, 2016-2026 (Kilotons)
      4. 4.8.4. The Middle-East and Africa C9 Solvents Market, by Country, 2019 - 2026 (Kilotons)
      5. 4.8.5. The Middle-East and Africa C9 Solvents Market, by Type, 2016-2026
        1. 4.8.5.1. The Middle-East and Africa C9 Solvents Market, by Type, 2016-2026 (USD Million)
        2. 4.8.5.2. The Middle-East and Africa C9 Solvents Market, by Type, 2016-2026 (Kilotons)
      6. 4.8.6. The Middle-East and Africa C9 Solvents Market, by Application, 2016-2026
        1. 4.8.6.1. The Middle-East and Africa C9 Solvents Market, by Application, 2016-2026 (USD Million)
        2. 4.8.6.2. The Middle-East and Africa C9 Solvents Market, by Application, 2016-2026 (Kilotons)
      7. 4.8.7. GCC Countries
        1. 4.8.7.1. GCC Countries Market size and forecast, 2016-2026 (USD Million)
        2. 4.8.7.2. GCC Countries Market size and forecast, 2016-2026 (Kilotons)
      8. 4.8.8. South Africa
        1. 4.8.8.1. South Africa Market size and forecast, 2016-2026 (USD Million)
        2. 4.8.8.2. South Africa Market size and forecast, 2016-2026 (Kilotons)
      9. 4.8.9. Rest of Middle-East Africa
        1. 4.8.9.1. Rest of Middle-East Africa Market size and forecast, 2016-2026 (USD Million)
        2. 4.8.9.2. Rest of Middle-East Africa Market size and forecast, 2016-2026 (Kilotons)
  5. CHAPTER 5. C9 Solvents Production, Consumption, Export, Import by Regions
    1. 5.1. Global C9 Solvents production and revenue, 2016-2026 (USD Million) (Kilotons)
    2. 5.2. Global Import and Export Analysis, by Region
  6. CHAPTER 6. C9 Solvents market – Competitive Landscape
    1. 6.1. Competitor Market Share – Revenue
    2. 6.2. Market Concentration Rate Analysis, Top 3 and Top 5 Players
    3. 6.3. Competitor Market Share – Volume
    4. 6.4. Strategic Development
      1. 6.4.1. Acquisitions and Mergers
      2. 6.4.2. New Products
      3. 6.4.3. Research & Development Activities
  7. CHAPTER 7. Company Profiles
    1. 7.1. Arham Petrochem
      1. 7.1.1. Company Overview
      2. 7.1.2. Arham Petrochem Sales, Revenue, Price, and Gross Margin
      3. 7.1.3. Product portfolio
      4. 7.1.4. Recent initiatives
    2. 7.2. Chevron Phillips Chemicals Company
      1. 7.2.1. Company Overview
      2. 7.2.2. Chevron Phillips Chemicals Company Sales, Revenue, Price, and Gross Margin
      3. 7.2.3. Product portfolio
      4. 7.2.4. Recent initiatives
    3. 7.3. DEZA
      1. 7.3.1. Company Overview
      2. 7.3.2. DEZA Sales, Revenue, Price, and Gross Margin
      3. 7.3.3. Product portfolio
      4. 7.3.4. Recent initiatives
    4. 7.4. Eastman Chemical Company
      1. 7.4.1. Company Overview
      2. 7.4.2. Eastman Chemical Company Sales, Revenue, Price, and Gross Margin
      3. 7.4.3. Product portfolio
      4. 7.4.4. Recent initiatives
    5. 7.5. Exxon Mobil
      1. 7.5.1. Company Overview
      2. 7.5.2. Exxon Mobil Sales, Revenue, Price, and Gross Margin
      3. 7.5.3. Product portfolio
      4. 7.5.4. Recent initiatives
    6. 7.6. Galp Energia
      1. 7.6.1. Company Overview
      2. 7.6.2. Galp Energia Sales, Revenue, Price, and Gross Margin
      3. 7.6.3. Product portfolio
      4. 7.6.4. Recent initiatives
    7. 7.7. Ganga Rasayanie
      1. 7.7.1. Company Overview
      2. 7.7.2. Ganga Rasayanie Sales, Revenue, Price, and Gross Margin
      3. 7.7.3. Product portfolio
      4. 7.7.4. Recent initiatives
    8. 7.8. Hanwha Group
      1. 7.8.1. Company Overview
      2. 7.8.2. Hanwha Group Sales, Revenue, Price, and Gross Margin
      3. 7.8.3. Product portfolio
      4. 7.8.4. Recent initiatives
    9. 7.9. Jiangsu Hualun
      1. 7.9.1. Company Overview
      2. 7.9.2. Jiangsu Hualun Sales, Revenue, Price, and Gross Margin
      3. 7.9.3. Product portfolio
      4. 7.9.4. Recent initiatives
    10. 7.10. Kandla Energy & Chemicals
      1. 7.10.1. Company Overview
      2. 7.10.2. Kandla Energy & Chemicals Sales, Revenue, Price, and Gross Margin
      3. 7.10.3. Product portfolio
      4. 7.10.4. Recent initiatives
    11. 7.11. Korea Petrochemical Ind
      1. 7.11.1. Company Overview
      2. 7.11.2. Korea Petrochemical Ind Sales, Revenue, Price, and Gross Margin
      3. 7.11.3. Product portfolio
      4. 7.11.4. Recent initiatives
    12. 7.12. Monument Chemical
      1. 7.12.1. Company Overview
      2. 7.12.2. Monument Chemical Sales, Revenue, Price, and Gross Margin
      3. 7.12.3. Product portfolio
      4. 7.12.4. Recent initiatives
    13. 7.13. Pampa Energa
      1. 7.13.1. Company Overview
      2. 7.13.2. Pampa Energa Sales, Revenue, Price, and Gross Margin
      3. 7.13.3. Product portfolio
      4. 7.13.4. Recent initiatives
    14. 7.14. Reliance Industries
      1. 7.14.1. Company Overview
      2. 7.14.2. Reliance Industries Sales, Revenue, Price, and Gross Margin
      3. 7.14.3. Product portfolio
      4. 7.14.4. Recent initiatives
    15. 7.15. Shell International
      1. 7.15.1. Company Overview
      2. 7.15.2. Shell International Sales, Revenue, Price, and Gross Margin
      3. 7.15.3. Product portfolio
      4. 7.15.4. Recent initiatives
    16. 7.16. SK global chemical
      1. 7.16.1. Company Overview
      2. 7.16.2. SK global chemical Sales, Revenue, Price, and Gross Margin
      3. 7.16.3. Product portfolio
      4. 7.16.4. Recent initiatives
    17. 7.17. S-OIL CORPORATION
      1. 7.17.1. Company Overview
      2. 7.17.2. S-OIL CORPORATION Sales, Revenue, Price, and Gross Margin
      3. 7.17.3. Product portfolio
      4. 7.17.4. Recent initiatives
    18. 7.18. Total
      1. 7.18.1. Company Overview
      2. 7.18.2. Total Sales, Revenue, Price, and Gross Margin
      3. 7.18.3. Product portfolio
      4. 7.18.4. Recent initiatives
    19. 7.19. VIRENT
      1. 7.19.1. Company Overview
      2. 7.19.2. VIRENT Sales, Revenue, Price, and Gross Margin
      3. 7.19.3. Product portfolio
      4. 7.19.4. Recent initiatives
  8. CHAPTER 8. C9 Solvents — Industry Analysis
    1. 8.1. Introduction and Taxonomy
    2. 8.2. C9 Solvents Market – Key Trends
      1. 8.2.1. Market Drivers
      2. 8.2.2. Market Restraints
      3. 8.2.3. Market Opportunities
    3. 8.3. Value Chain Analysis
    4. 8.4. Key Mandates and Regulations
    5. 8.5. Technology Roadmap and Timeline
    6. 8.6. C9 Solvents market – Attractiveness Analysis
      1. 8.6.1. By Type
      2. 8.6.2. By Application
      3. 8.6.3. By Region
  9. CHAPTER 9. Raw Material analysis
    1. 9.1. C9 Solvents Key Raw Material Analysis
      1. 9.1.1. Key Raw Materials
      2. 9.1.2. Price Trend of Key Raw Materials
    2. 9.2. Key Suppliers of Raw Materials
    3. 9.3. Proportion of Manufacturing Cost Structure
      1. 9.3.1. Raw Materials
      2. 9.3.2. Labor Cost
    4. 9.4. Manufacturing Expenses Analysis of C9 Solvents
  10. CHAPTER 10. Industrial Chain, Sourcing Strategy and Downstream Buyers
    1. 10.1. C9 Solvents Industrial Chain Analysis
    2. 10.2. Upstream Raw Materials Sourcing
      1. 10.2.1. Risk Mitigation:
      2. 10.2.2. Supplier Relationships:
      3. 10.2.3. Business Processes:
      4. 10.2.4. Securing the Product:
    3. 10.3. Raw Materials Sources of C9 Solvents Major Manufacturers in 2019
    4. 10.4. Downstream Buyers
    5. 10.5. Distributors/Traders List
  11. CHAPTER 11. Marketing Strategy Analysis, Distributors
    1. 11.1. Marketing Channel
    2. 11.2. Direct Marketing
    3. 11.3. Indirect Marketing
    4. 11.4. Marketing Channel Development Trend
    5. 11.5. Economic/Political Environmental Change
  12. CHAPTER 12. Report Conclusion
  13. CHAPTER 13. Research Approach & Methodology
    1. 13.1. Report Description
    2. 13.2. Research Scope
    3. 13.3. Research Methodology
      1. 13.3.1. Secondary Research
      2. 13.3.2. Primary Research
      3. 13.3.3. Models
        1. 13.3.3.1. Company Share Analysis Model
        2. 13.3.3.2. Revenue Based Modeling
        3. 13.3.3.3. Research Limitations

        List of Figures

        FIG. 1 Global C9 Solvents Market, 2016-2026 (USD Million)
        FIG. 2 Global C9 Solvents Market Share, by Type, 2019 & 2026 (USD Million)
        FIG. 3 Global C9 Solvents Market share, by Type, 2019 & 2026 (Kilotons)
        FIG. 4 Global Benzene, 1,2,4-trimethyl C9 Solvents Market, 2016-2026 (USD Million)
        FIG. 5 Global Benzene, 1,2,4-trimethyl C9 Solvents  Market, 2016-2026 (Kilotons)
        FIG. 6 Global Benzene, 1,3,5-trimethyl C9 Solvents Market, 2016-2026 (USD Million)
        FIG. 7 Global Benzene, 1,3,5-trimethyl C9 Solvents  Market, 2016-2026 (Kilotons)
        FIG. 8 Global Benzene, ethylmethyl (ethyltoluene mixed isomers) C9 Solvents Market, 2016-2026 (USD Million)
        FIG. 9 Global Benzene, ethylmethyl (ethyltoluene mixed isomers) C9 Solvents  Market, 2016-2026 (Kilotons)
        FIG. 10 Global Solvent naphtha, (petroleum), light aromatic C9 Solvents Market, 2016-2026 (USD Million)
        FIG. 11 Global Solvent naphtha, (petroleum), light aromatic C9 Solvents  Market, 2016-2026 (Kilotons)
        FIG. 12 Global C9 Solvents Market Share, by Application, 2019 & 2026 (USD Million)
        FIG. 13 Global C9 Solvents Market share, by Application, 2019 & 2026 (Kilotons)
        FIG. 14 Global Pharmaceuticals C9 Solvents Market, 2016-2026 (USD Million)
        FIG. 15 Global Pharmaceuticals C9 Solvents  Market, 2016-2026 (Kilotons)
        FIG. 16 Global Oilfield Chemicals C9 Solvents Market, 2016-2026 (USD Million)
        FIG. 17 Global Oilfield Chemicals C9 Solvents  Market, 2016-2026 (Kilotons)
        FIG. 18 Global Automotive C9 Solvents Market, 2016-2026 (USD Million)
        FIG. 19 Global Automotive C9 Solvents  Market, 2016-2026 (Kilotons)
        FIG. 20 Global Paints and Coatings C9 Solvents Market, 2016-2026 (USD Million)
        FIG. 21 Global Paints and Coatings C9 Solvents  Market, 2016-2026 (Kilotons)
        FIG. 22 Global Others C9 Solvents Market, 2016-2026 (USD Million)
        FIG. 23 Global Others C9 Solvents  Market, 2016-2026 (Kilotons)
        FIG. 24 Global C9 Solvents Market Share, by Region, 2019 & 2026
        FIG. 25 Global C9 Solvents Market Share, by Region, 2019 & 2026
        FIG. 26 North America C9 Solvents Market, 2016-2026
        FIG. 27 North America C9 Solvents  Market, 2016-2026 (Kilotons)
        FIG. 28 U.S. C9 Solvents Market, 2016-2026
        FIG. 29 U.S. C9 Solvents  Market, 2016-2026 (Kilotons)
        FIG. 30 Canada C9 Solvents Market, 2016-2026
        FIG. 31 Canada C9 Solvents  Market, 2016-2026 (Kilotons)
        FIG. 32 Europe C9 Solvents Market, 2016-2026
        FIG. 33 Europe C9 Solvents  Market, 2016-2026 (Kilotons)
        FIG. 34 Germany C9 Solvents Market, 2016-2026
        FIG. 35 Germany C9 Solvents  Market, 2016-2026 (Kilotons)
        FIG. 36 France C9 Solvents Market, 2016-2026
        FIG. 37 France C9 Solvents  Market, 2016-2026 (Kilotons)
        FIG. 38 U.K. C9 Solvents Market, 2016-2026
        FIG. 39 U.K. C9 Solvents  Market, 2016-2026 (Kilotons)
        FIG. 40 Italy C9 Solvents Market, 2016-2026
        FIG. 41 Italy C9 Solvents  Market, 2016-2026 (Kilotons)
        FIG. 42 Spain C9 Solvents Market, 2016-2026
        FIG. 43 Spain C9 Solvents  Market, 2016-2026 (Kilotons)
        FIG. 44 Rest of Europe C9 Solvents Market, 2016-2026
        FIG. 45 Rest of Europe C9 Solvents  Market, 2016-2026 (Kilotons)
        FIG. 46 Asia Pacific C9 Solvents Market, 2016-2026
        FIG. 47 Asia Pacific C9 Solvents  Market, 2016-2026 (Kilotons)
        FIG. 48 China C9 Solvents Market, 2016-2026
        FIG. 49 China C9 Solvents  Market, 2016-2026 (Kilotons)
        FIG. 50 Japan C9 Solvents Market, 2016-2026
        FIG. 51 Japan C9 Solvents  Market, 2016-2026 (Kilotons)
        FIG. 52 India C9 Solvents Market, 2016-2026
        FIG. 53 India C9 Solvents  Market, 2016-2026 (Kilotons)
        FIG. 54 South  Korea C9 Solvents Market, 2016-2026
        FIG. 55 South  Korea C9 Solvents  Market, 2016-2026 (Kilotons)
        FIG. 56 South-East Asia C9 Solvents Market, 2016-2026
        FIG. 57 South-East Asia C9 Solvents  Market, 2016-2026 (Kilotons)
        FIG. 58 Rest of Asia Pacific C9 Solvents Market, 2016-2026
        FIG. 59 Rest of Asia Pacific C9 Solvents  Market, 2016-2026 (Kilotons)
        FIG. 60 Latin America C9 Solvents Market, 2016-2026
        FIG. 61 Latin America C9 Solvents  Market, 2016-2026 (Kilotons)
        FIG. 62 Brazil C9 Solvents Market, 2016-2026
        FIG. 63 Brazil C9 Solvents  Market, 2016-2026 (Kilotons)
        FIG. 64 Mexico C9 Solvents Market, 2016-2026
        FIG. 65 Mexico C9 Solvents  Market, 2016-2026 (Kilotons)
        FIG. 66 Rest of Latin America C9 Solvents Market, 2016-2026
        FIG. 67 Rest of Latin America C9 Solvents  Market, 2016-2026 (Kilotons)
        FIG. 68 The Middle-East and Africa C9 Solvents Market, 2016-2026
        FIG. 69 The Middle-East and Africa C9 Solvents  Market, 2016-2026 (Kilotons)
        FIG. 70 GCC Countries C9 Solvents Market, 2016-2026
        FIG. 71 GCC Countries C9 Solvents  Market, 2016-2026 (Kilotons)
        FIG. 72 South Africa C9 Solvents Market, 2016-2026
        FIG. 73 South Africa C9 Solvents  Market, 2016-2026 (Kilotons)
        FIG. 74 Rest of Middle-East Africa C9 Solvents Market, 2016-2026
        FIG. 75 Rest of Middle-East Africa C9 Solvents  Market, 2016-2026 (Kilotons)
        FIG. 76 Global C9 Solvents production and revenue, 2016-2026 (USD Million) (Kilotons)
        FIG. 77 North America C9 Solvents production and revenue, 2016-2026 (USD Million) (Kilotons)
        FIG. 78 Europe C9 Solvents production and revenue, 2016-2026 (USD Million) (Kilotons)
        FIG. 79 Asia Pacific C9 Solvents production and revenue, 2016-2026 (USD Million) (Kilotons)
        FIG. 80 Latin America C9 Solvents production and revenue, 2016-2026 (USD Million) (Kilotons)
        FIG. 81 Middle East and Africa C9 Solvents production and revenue, 2016-2026 (USD Million) (Kilotons)
        FIG. 82 Competitor Market Share – Revenue
        FIG. 83 Competitor Market Share – Volume
        FIG. 84 Arham Petrochem Revenue and Growth Rate
        FIG. 85 Arham Petrochem Market Share
        FIG. 86 Chevron Phillips Chemicals Company Revenue and Growth Rate
        FIG. 87 Chevron Phillips Chemicals Company Market Share
        FIG. 88 DEZA Revenue and Growth Rate
        FIG. 89 DEZA Market Share
        FIG. 90 Eastman Chemical Company Revenue and Growth Rate
        FIG. 91 Eastman Chemical Company Market Share
        FIG. 92 Exxon Mobil Revenue and Growth Rate
        FIG. 93 Exxon Mobil Market Share
        FIG. 94 Galp Energia Revenue and Growth Rate
        FIG. 95 Galp Energia Market Share
        FIG. 96 Ganga Rasayanie Revenue and Growth Rate
        FIG. 97 Ganga Rasayanie Market Share
        FIG. 98 Hanwha Group Revenue and Growth Rate
        FIG. 99 Hanwha Group Market Share
        FIG. 100 Jiangsu Hualun Revenue and Growth Rate
        FIG. 101 Jiangsu Hualun Market Share
        FIG. 102 Kandla Energy & Chemicals Revenue and Growth Rate
        FIG. 103 Kandla Energy & Chemicals Market Share
        FIG. 104 Korea Petrochemical Ind Revenue and Growth Rate
        FIG. 105 Korea Petrochemical Ind Market Share
        FIG. 106 Monument Chemical Revenue and Growth Rate
        FIG. 107 Monument Chemical Market Share
        FIG. 108 Pampa Energa Revenue and Growth Rate
        FIG. 109 Pampa Energa Market Share
        FIG. 110 Reliance Industries Revenue and Growth Rate
        FIG. 111 Reliance Industries Market Share
        FIG. 112 Shell International Revenue and Growth Rate
        FIG. 113 Shell International Market Share
        FIG. 114 SK global chemical Revenue and Growth Rate
        FIG. 115 SK global chemical Market Share
        FIG. 116 S-OIL CORPORATION Revenue and Growth Rate
        FIG. 117 S-OIL CORPORATION Market Share
        FIG. 118 Total Revenue and Growth Rate
        FIG. 119 Total Market Share
        FIG. 120 VIRENT Revenue and Growth Rate
        FIG. 121 VIRENT Market Share
        FIG. 122 Market Dynamics
        FIG. 123 Global C9 Solvents – Value Chain Analysis
        FIG. 124 Key Mandates and Regulations
        FIG. 125 Technology Roadmap and Timeline
        FIG. 126 Market Attractiveness Analysis – By Type
        FIG. 127 Market Attractiveness Analysis – By Application
        FIG. 128 Market Attractiveness Analysis – By Region
        FIG. 129 Manufacturing Cost Structure of C9 Solvents
        FIG. 130 C9 Solvents Industrial Chain Analysis
        FIG. 131 Market Channel
        FIG. 132 Marketing Channel Development Trend
        FIG. 133 Growth in World Gross Product, 2008-2018

        List of Tables

        TABLE 1 Global C9 Solvents market, 2019 & 2026 (USD Million)
        TABLE 2 Global C9 Solvents market, by Type, 2016-2026 (USD Million)
        TABLE 3 Global C9 Solvents market, by Type, 2016-2026 (Kilotons)
        TABLE 4 Global C9 Solvents market, by Application, 2016-2026 (USD Million)
        TABLE 5 Global C9 Solvents market, by Application, 2016-2026 (Kilotons)
        TABLE 6 Global C9 Solvents market, by region, 2016-2026 (USD Million)
        TABLE 7 Global C9 Solvents market, by region, 2016-2026 (Kilotons)
        TABLE 8 North America C9 Solvents Market, by Type, 2016-2026 (USD Million)
        TABLE 9 North America C9 Solvents Market, by Type, 2016-2026 (Kilotons)
        TABLE 10 North America C9 Solvents Market, by Application, 2016-2026 (USD Million)
        TABLE 11 North America C9 Solvents Market, by Application, 2016-2026 (Kilotons)
        TABLE 12 Europe C9 Solvents Market, by Type, 2016-2026 (USD Million)
        TABLE 13 Europe C9 Solvents Market, by Type, 2016-2026 (Kilotons)
        TABLE 14 Europe C9 Solvents Market, by Application, 2016-2026 (USD Million)
        TABLE 15 Europe C9 Solvents Market, by Application, 2016-2026 (Kilotons)
        TABLE 16 Asia Pacific C9 Solvents Market, by Type, 2016-2026 (USD Million)
        TABLE 17 Asia Pacific C9 Solvents Market, by Type, 2016-2026 (Kilotons)
        TABLE 18 Asia Pacific C9 Solvents Market, by Application, 2016-2026 (USD Million)
        TABLE 19 Asia Pacific C9 Solvents Market, by Application, 2016-2026 (Kilotons)
        TABLE 20 Latin America C9 Solvents Market, by Type, 2016-2026 (USD Million)
        TABLE 21 Latin America C9 Solvents Market, by Type, 2016-2026 (Kilotons)
        TABLE 22 Latin America C9 Solvents Market, by Application, 2016-2026 (USD Million)
        TABLE 23 Latin America C9 Solvents Market, by Application, 2016-2026 (Kilotons)
        TABLE 24 The Middle-East and Africa C9 Solvents Market, by Type, 2016-2026 (USD Million)
        TABLE 25 The Middle-East and Africa C9 Solvents Market, by Type, 2016-2026 (Kilotons)
        TABLE 26 The Middle-East and Africa C9 Solvents Market, by Application, 2016-2026 (USD Million)
        TABLE 27 The Middle-East and Africa C9 Solvents Market, by Application, 2016-2026 (Kilotons)
        TABLE 28 North America C9 Solvents Production, Consumption, Export, Import, 2016-2019
        TABLE 29 Europe C9 Solvents Production, Consumption, Export, Import, 2016-2019
        TABLE 30 Asia Pacific C9 Solvents Production, Consumption, Export, Import, 2016-2019
        TABLE 31 Latin America C9 Solvents Production, Consumption, Export, Import, 2016-2019
        TABLE 32 Middle East & Africa C9 Solvents Production, Consumption, Export, Import, 2016-2019
        TABLE 33 Global C9 Solvents Market - Company Revenue Analysis 2016-2019 (USD Million)
        TABLE 34 Global C9 Solvents Market - Company Revenue Share Analysis 2016-2019(%)
        TABLE 35 Global C9 Solvents Market - Company Volume Analysis 2016-2019 (Kilotons)
        TABLE 36 Global C9 Solvents Market - Company Volume Share Analysis 2016-2019(%)
        TABLE 37 Acquisitions and Mergers
        TABLE 38 New Product/Service Launch
        TABLE 39 Research & Development Activities
        TABLE 40 Market Drivers
        TABLE 41 Market Restraints
        TABLE 42 Market Opportunities
        TABLE 43 Production Base and Market Concentration Rate of Raw Material
        TABLE 44 Key Suppliers of Raw Materials
        TABLE 45 Raw Materials Sources of C9 Solvents Major Manufacturers in 2019
        TABLE 46 Major Buyers of C9 Solvents
        TABLE 47 Distributors/Traders of C9 Solvents by Region

Industry Major Market Players

  •  Arham Petrochem
  •  Chevron Phillips Chemicals Company
  •  DEZA
  •  Eastman Chemical Company
  •  Exxon Mobil
  •  Galp Energia
  •  Ganga Rasayanie
  •  Hanwha Group
  •  Jiangsu Hualun
  •  Kandla Energy & Chemicals
  •  Korea Petrochemical Ind
  •  Monument Chemical
  •  Pampa Energa
  •  Reliance Industries
  •  Shell International
  •  SK global chemical
  •  S-OIL CORPORATION
  •  Total
  •  VIRENT