Search Market Research Report

Discover Our Latest Reports
Discover Our Featured Reports
Discover Top Selling Reports

C1 Inhibitors Market Size, Share Global Analysis Report, , 2020 – 2026

report img

C1 Inhibitors Market By Source (Human Derived & Recombinant Derived C1 Inhibitors), By Mode of Administration (Intravenous & Subcutaneous), By End-User (Hospitals & Pharmacies), and By Regions - Global Industry Perspective, Comprehensive Analysis, and Forecast, 2020 – 2026

Industry Insights

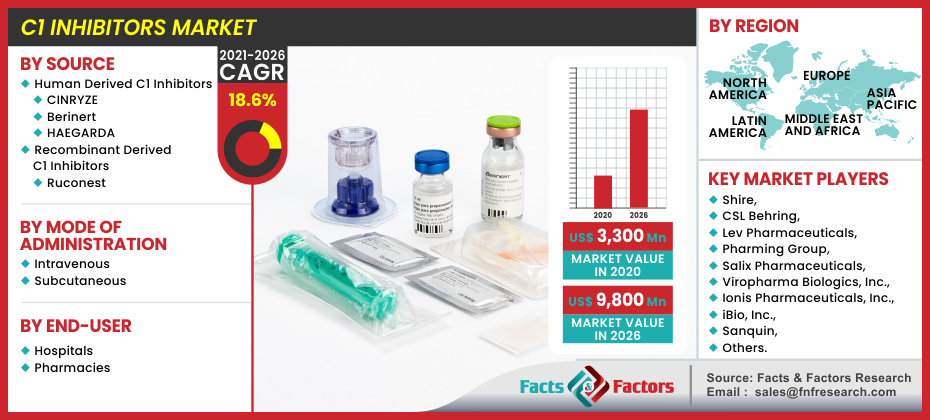
[197+ Pages Report] Facts and Factors have recently published the report titled “C1 Inhibitor Market” which illustrates that the global C1 inhibitors market was estimated at around USD 3,300 Million in 2020, and it is expected to provide revenue of about USD 9,800 Million by end of 2026, developing at a CAGR of around 18.6% between 2021 and 2026.

logoMarket Overview

C1 inhibitors are a part of the superfamily of the protein tree named “serpin.” C1 inhibitors could also be referred to as “C1 esterase inhibitors.” Just like the other serpin candidates of the family, they also comprise of two parts: C-terminal and N-terminal.C1 inhibitors are a form of protease inhibitors entitled with the function of reducing self-consciousness of the complement system in order to preserve function and avoid any hazardous reaction. Normally, 0.25g/L is the quantity in which it is present in the blood; however, its level doubles on any inflammatory reaction. Generally, the increased levels of C1 are not desired as it can cause genital conditions such as hereditary or acquired angioedema. It is found to play an important role in the complement activation, regulation of blood coagulation, and production of fibrinolysis and kinins. C1 inhibitors are effective FXIIa inhibitors.

C1 Inhibitors Market

To know more about this report | Request Free Sample Copy

logoIndustry Growth Factors

A high growth in the rise of hereditary angioedema (HAE) and the preferred use of prophylactic treatment will drive the market to higher growth. Additionally, benefits include treatment and prevention of acute attacks and routine prophylaxis against other forms of HAE. Other drivers for the C1 inhibitors market include a rise in awareness by various studies that show the effective nature of C1 inhibitors in the treatment of HAE diseases. Acquired investment pools from investors will also fuel the growth of the market during the forecast. C1 inhibitor medications are also used for short-term treatment for prophylactic diseases which increases their market footprint to a larger extent. Furthermore, the rising requirement for the treatment of HAE diseases coupled with the growing awareness regarding these diseases is all projected to drive the global C1 inhibitors market growth. Growing investments also fuel the market. The rising occurrence of HAE increases the demand for C1 inhibitors, thereby boosting the market during the forecast period. The advancements in the drugs and formulations along with the use of C1 inhibitors as short-term prophylactic medication are other factors that propel the market. Additionally, the rising adoption of the subcutaneous route of administration by doctors and improving availability of Ruconest further fuel the C1 inhibitor market.

However, a high initial cost and widened reimbursement times from third-party vendors for the operation will hinder the growth of the market to some extent. The lack of awareness and delay in approval tend to hamper the market growth. Also, misdiagnosis and costly medication are other factors likely to restrain the C1 inhibitors market growth.

logoSegmentation Analysis

The global C1 inhibitors market can be segmented on the basis of source, route of administration, end-users, and regions.

On the basis of source, the global C1 inhibitors market can be divided into human-derived and recombinant derived. The human-derived C1 inhibitors can be further broken down into CINRYZE, Berinert, and HAEGARDA while the recombinant derived C1 inhibitors can be bifurcated into Ruconest. On the basis of mode of administration, the global C1 inhibitors market can be divided into intravenous and subcutaneous. On the basis of end-users, the global C1 inhibitors market can be divided into hospitals and pharmacies.

logo Regional Analysis

North America is expected to occupy the largest market share during the forecast period in terms of market revenue. Factors for the heavy rise of the C1 inhibitors market are a well-established healthcare infrastructure, improved healthcare access, increased awareness about HAE treatments, and widened reimbursement support from healthcare providers. North America will be followed by Europe and Asia-Pacific in terms of growth during the forecast period.

logoReport Scope

Report Attribute

Details

Market Size in 2020

USD 3,300 Million

Projected Market Size in 2026

USD 9,800 Million

CAGR Growth Rate

18.6% CAGR

Base Year

2020

Forecast Years

2021-2026

Key Market Players

Shire, CSL Behring, Lev Pharmaceuticals, Pharming Group, Salix Pharmaceuticals, Viropharma Biologics, Inc., Ionis Pharmaceuticals, Inc., iBio, Inc., Sanquin, and BioCryst Pharmaceuticals., among others.

Key Segment

By Source, By Mode of Administration, By End-User, and By Region

Major Regions Covered

North America, Europe, Asia Pacific, Latin America, and the Middle East & Africa

Purchase Options

Request customized purchase options to meet your research needs. Explore purchase options

logo Competitive Players

The major participants in the global C1 inhibitors market are :

  • Shire
  • CSL Behring
  • Lev Pharmaceuticals
  • Pharming Group
  • Salix Pharmaceuticals
  • Viropharma Biologics Inc.
  • Ionis Pharmaceuticals Inc.
  • iBio Inc.
  • Sanquin
  • BioCryst Pharmaceuticals

logo By Source Segment Analysis

  • Human Derived C1 Inhibitors
    • CINRYZE
    • Berinert
    • HAEGARDA
  • Recombinant Derived C1 Inhibitors
    • Ruconest

logo By Mode of Administration Segment Analysis

  • Intravenous
  • Subcutaneous

logo By End-User Segment Analysis

  • Hospitals
  • Pharmacies

logo By Regional Segment Analysis

  • North America
    • U.S.
    • Canada
  • Europe
    • UK
    • France
    • Germany
    • Italy
    • Spain
    • Rest of Europe
  • Asia Pacific
    • China
    • Japan
    • India
    • South Korea
    • Southeast Asia
    • Rest of Asia Pacific
  • Latin America
    • Brazil
    • Mexico
    • Rest of Latin America
  • Middle East and Africa
    • GCC Countries
    • South Africa
    • Rest of MEA

Table of Content

  1. Chapter 1 Executive Summary
    1. 1.1. Introduction of C1 Inhibitors
    2. 1.2. Global C1 Inhibitors Market, 2019 & 2021 (USD Million)
    3. 1.3. Global C1 Inhibitors Market, 2020 – 2021 (USD Million) ()
    4. 1.4. Global C1 Inhibitors Market Absolute Revenue Opportunity, 2020 – 2021 (USD Million)
    5. 1.5. Global C1 Inhibitors Market Incremental Revenue Opportunity, 2020 – 2021 (USD Million)
  2. Chapter 2 C1 Inhibitors Market – Source Analysis
    1. 2.1. Global C1 Inhibitors Market – Source Overview
    2. 2.2. Global C1 Inhibitors Market Share, by Source, 2019 & 2021 (USD Million)
    3. 2.3. Global C1 Inhibitors Market share, by Source, 2019 & 2021 ()
    4. 2.4. Human Derived C1 Inhibitors
      1. 2.4.1. Global Human Derived C1 Inhibitors C1 Inhibitors Market, 2020 – 2021 (USD Million)
      2. 2.4.2. Global Human Derived C1 Inhibitors C1 Inhibitors Market, 2020 – 2021 ()
    5. 2.5. Recombinant Derived C1 Inhibitors
      1. 2.5.1. Global Recombinant Derived C1 Inhibitors C1 Inhibitors Market, 2020 – 2021 (USD Million)
      2. 2.5.2. Global Recombinant Derived C1 Inhibitors C1 Inhibitors Market, 2020 – 2021 ()
  3. Chapter 3 C1 Inhibitors Market – Mode of Administration Analysis
    1. 3.1. Global C1 Inhibitors Market – Mode of Administration Overview
    2. 3.2. Global C1 Inhibitors Market Share, by Mode of Administration, 2019 & 2021 (USD Million)
    3. 3.3. Global C1 Inhibitors Market share, by Mode of Administration, 2019 & 2021 ()
    4. 3.4. Intravenous
      1. 3.4.1. Global Intravenous C1 Inhibitors Market, 2020 – 2021 (USD Million)
      2. 3.4.2. Global Intravenous C1 Inhibitors Market, 2020 – 2021 ()
    5. 3.5. Subcutaneous
      1. 3.5.1. Global Subcutaneous C1 Inhibitors Market, 2020 – 2021 (USD Million)
      2. 3.5.2. Global Subcutaneous C1 Inhibitors Market, 2020 – 2021 ()
  4. Chapter 4 C1 Inhibitors Market – End-Users Analysis
    1. 4.1. Global C1 Inhibitors Market – End-Users Overview
    2. 4.2. Global C1 Inhibitors Market Share, by End-Users, 2019 & 2021 (USD Million)
    3. 4.3. Global C1 Inhibitors Market share, by End-Users, 2019 & 2021 ()
    4. 4.4. Hospitals
      1. 4.4.1. Global Hospitals C1 Inhibitors Market, 2020 – 2021 (USD Million)
      2. 4.4.2. Global Hospitals C1 Inhibitors Market, 2020 – 2021 ()
    5. 4.5. Pharmacies
      1. 4.5.1. Global Pharmacies C1 Inhibitors Market, 2020 – 2021 (USD Million)
      2. 4.5.2. Global Pharmacies C1 Inhibitors Market, 2020 – 2021 ()
  5. Chapter 5 C1 Inhibitors Market – Regional Analysis
    1. 5.1. Global C1 Inhibitors Market Regional Overview
    2. 5.2. Global C1 Inhibitors Market Share, by Region, 2019 & 2021 (USD Million)
    3. 5.3. Global C1 Inhibitors Market Share, by Region, 2019 & 2021 ()
    4. 5.4. North America
      1. 5.4.1. North America C1 Inhibitors Market, 2020 – 2021 (USD Million)
        1. 5.4.1.1. North America C1 Inhibitors Market, by Country, 2020 – 2021 (USD Million)
      2. 5.4.2. North America Market, 2020 – 2021 ()
        1. 5.4.2.1. North America C1 Inhibitors Market, by Country, 2020 – 2021 ()
      3. 5.4.3. North America C1 Inhibitors Market, by Source, 2020 – 2021
        1. 5.4.3.1. North America C1 Inhibitors Market, by Source, 2020 – 2021 (USD Million)
        2. 5.4.3.2. North America C1 Inhibitors Market, by Source, 2020 – 2021 ()
      4. 5.4.4. North America C1 Inhibitors Market, by Mode of Administration, 2020 – 2021
        1. 5.4.4.1. North America C1 Inhibitors Market, by Mode of Administration, 2020 – 2021 (USD Million)
        2. 5.4.4.2. North America C1 Inhibitors Market, by Mode of Administration, 2020 – 2021 ()
      5. 5.4.5. North America C1 Inhibitors Market, by End-Users, 2020 – 2021
        1. 5.4.5.1. North America C1 Inhibitors Market, by End-Users, 2020 – 2021 (USD Million)
        2. 5.4.5.2. North America C1 Inhibitors Market, by End-Users, 2020 – 2021 ()
      6. 5.4.6. U.S.
        1. 5.4.6.1. U.S. C1 Inhibitors Market, 2020 – 2021 (USD Million)
        2. 5.4.6.2. U.S. C1 Inhibitors Market, 2020 – 2021 ()
      7. 5.4.7. Canada
        1. 5.4.7.1. Canada C1 Inhibitors Market, 2020 – 2021 (USD Million)
        2. 5.4.7.2. Canada C1 Inhibitors Market, 2020 – 2021 ()
    5. 5.5. Europe
      1. 5.5.1. Europe C1 Inhibitors Market, 2020 – 2021 (USD Million)
        1. 5.5.1.1. Europe C1 Inhibitors Market, by Country, 2020 – 2021 (USD Million)
      2. 5.5.2. Europe Market, 2020 – 2021 ()
        1. 5.5.2.1. Europe C1 Inhibitors Market, by Country, 2020 – 2021 ()
      3. 5.5.3. Europe C1 Inhibitors Market, by Source, 2020 – 2021
        1. 5.5.3.1. Europe C1 Inhibitors Market, by Source, 2020 – 2021 (USD Million)
        2. 5.5.3.2. Europe C1 Inhibitors Market, by Source, 2020 – 2021 ()
      4. 5.5.4. Europe C1 Inhibitors Market, by Mode of Administration, 2020 – 2021
        1. 5.5.4.1. Europe C1 Inhibitors Market, by Mode of Administration, 2020 – 2021 (USD Million)
        2. 5.5.4.2. Europe C1 Inhibitors Market, by Mode of Administration, 2020 – 2021 ()
      5. 5.5.5. Europe C1 Inhibitors Market, by End-Users, 2020 – 2021
        1. 5.5.5.1. Europe C1 Inhibitors Market, by End-Users, 2020 – 2021 (USD Million)
        2. 5.5.5.2. Europe C1 Inhibitors Market, by End-Users, 2020 – 2021 ()
      6. 5.5.6. Germany
        1. 5.5.6.1. Germany C1 Inhibitors Market, 2020 – 2021 (USD Million)
        2. 5.5.6.2. Germany C1 Inhibitors Market, 2020 – 2021 ()
      7. 5.5.7. France
        1. 5.5.7.1. France C1 Inhibitors Market, 2020 – 2021 (USD Million)
        2. 5.5.7.2. France C1 Inhibitors Market, 2020 – 2021 ()
      8. 5.5.8. U.K.
        1. 5.5.8.1. U.K. C1 Inhibitors Market, 2020 – 2021 (USD Million)
        2. 5.5.8.2. U.K. C1 Inhibitors Market, 2020 – 2021 ()
      9. 5.5.9. Italy
        1. 5.5.9.1. Italy C1 Inhibitors Market, 2020 – 2021 (USD Million)
        2. 5.5.9.2. Italy C1 Inhibitors Market, 2020 – 2021 ()
      10. 5.5.10. Spain
        1. 5.5.10.1. Spain C1 Inhibitors Market, 2020 – 2021 (USD Million)
        2. 5.5.10.2. Spain C1 Inhibitors Market, 2020 – 2021 ()
      11. 5.5.11. Rest of Europe
        1. 5.5.11.1. Rest of Europe C1 Inhibitors Market, 2020 – 2021 (USD Million)
        2. 5.5.11.2. Rest of Europe C1 Inhibitors Market, 2020 – 2021 ()
    6. 5.6. Asia Pacific
      1. 5.6.1. Asia Pacific C1 Inhibitors Market, 2020 – 2021 (USD Million)
        1. 5.6.1.1. Asia Pacific C1 Inhibitors Market, by Country, 2020 – 2021 (USD Million)
      2. 5.6.2. Asia Pacific Market, 2020 – 2021 ()
        1. 5.6.2.1. Asia Pacific C1 Inhibitors Market, by Country, 2020 – 2021 ()
      3. 5.6.3. Asia Pacific C1 Inhibitors Market, by Source, 2020 – 2021
        1. 5.6.3.1. Asia Pacific C1 Inhibitors Market, by Source, 2020 – 2021 (USD Million)
        2. 5.6.3.2. Asia Pacific C1 Inhibitors Market, by Source, 2020 – 2021 ()
      4. 5.6.4. Asia Pacific C1 Inhibitors Market, by Mode of Administration, 2020 – 2021
        1. 5.6.4.1. Asia Pacific C1 Inhibitors Market, by Mode of Administration, 2020 – 2021 (USD Million)
        2. 5.6.4.2. Asia Pacific C1 Inhibitors Market, by Mode of Administration, 2020 – 2021 ()
      5. 5.6.5. Asia Pacific C1 Inhibitors Market, by End-Users, 2020 – 2021
        1. 5.6.5.1. Asia Pacific C1 Inhibitors Market, by End-Users, 2020 – 2021 (USD Million)
        2. 5.6.5.2. Asia Pacific C1 Inhibitors Market, by End-Users, 2020 – 2021 ()
      6. 5.6.6. China
        1. 5.6.6.1. China C1 Inhibitors Market, 2020 – 2021 (USD Million)
        2. 5.6.6.2. China C1 Inhibitors Market, 2020 – 2021 ()
      7. 5.6.7. Japan
        1. 5.6.7.1. Japan C1 Inhibitors Market, 2020 – 2021 (USD Million)
        2. 5.6.7.2. Japan C1 Inhibitors Market, 2020 – 2021 ()
      8. 5.6.8. India
        1. 5.6.8.1. India C1 Inhibitors Market, 2020 – 2021 (USD Million)
        2. 5.6.8.2. India C1 Inhibitors Market, 2020 – 2021 ()
      9. 5.6.9. South Korea
        1. 5.6.9.1. South Korea C1 Inhibitors Market, 2020 – 2021 (USD Million)
        2. 5.6.9.2. South Korea C1 Inhibitors Market, 2020 – 2021 ()
      10. 5.6.10. South-East Asia
        1. 5.6.10.1. South-East Asia C1 Inhibitors Market, 2020 – 2021 (USD Million)
        2. 5.6.10.2. South-East Asia C1 Inhibitors Market, 2020 – 2021 ()
      11. 5.6.11. Rest of Asia Pacific
        1. 5.6.11.1. Rest of Asia Pacific C1 Inhibitors Market, 2020 – 2021 (USD Million)
        2. 5.6.11.2. Rest of Asia Pacific C1 Inhibitors Market, 2020 – 2021 ()
    7. 5.7. Latin America
      1. 5.7.1. Latin America C1 Inhibitors Market, 2020 – 2021 (USD Million)
        1. 5.7.1.1. Latin America C1 Inhibitors Market, by Country, 2020 – 2021 (USD Million)
      2. 5.7.2. Latin America Market, 2020 – 2021 ()
        1. 5.7.2.1. Latin America C1 Inhibitors Market, by Country, 2020 – 2021 ()
      3. 5.7.3. Latin America C1 Inhibitors Market, by Source, 2020 – 2021
        1. 5.7.3.1. Latin America C1 Inhibitors Market, by Source, 2020 – 2021 (USD Million)
        2. 5.7.3.2. Latin America C1 Inhibitors Market, by Source, 2020 – 2021 ()
      4. 5.7.4. Latin America C1 Inhibitors Market, by Mode of Administration, 2020 – 2021
        1. 5.7.4.1. Latin America C1 Inhibitors Market, by Mode of Administration, 2020 – 2021 (USD Million)
        2. 5.7.4.2. Latin America C1 Inhibitors Market, by Mode of Administration, 2020 – 2021 ()
      5. 5.7.5. Latin America C1 Inhibitors Market, by End-Users, 2020 – 2021
        1. 5.7.5.1. Latin America C1 Inhibitors Market, by End-Users, 2020 – 2021 (USD Million)
        2. 5.7.5.2. Latin America C1 Inhibitors Market, by End-Users, 2020 – 2021 ()
      6. 5.7.6. Brazil
        1. 5.7.6.1. Brazil C1 Inhibitors Market, 2020 – 2021 (USD Million)
        2. 5.7.6.2. Brazil C1 Inhibitors Market, 2020 – 2021 ()
      7. 5.7.7. Mexico
        1. 5.7.7.1. Mexico C1 Inhibitors Market, 2020 – 2021 (USD Million)
        2. 5.7.7.2. Mexico C1 Inhibitors Market, 2020 – 2021 ()
      8. 5.7.8. Rest of Latin America
        1. 5.7.8.1. Rest of Latin America C1 Inhibitors Market, 2020 – 2021 (USD Million)
        2. 5.7.8.2. Rest of Latin America C1 Inhibitors Market, 2020 – 2021 ()
    8. 5.8. The Middle-East and Africa
      1. 5.8.1. The Middle-East and Africa C1 Inhibitors Market, 2020 – 2021 (USD Million)
        1. 5.8.1.1. The Middle-East and Africa C1 Inhibitors Market, by Country, 2020 – 2021 (USD Million)
      2. 5.8.2. The Middle-East and Africa Market, 2020 – 2021 ()
        1. 5.8.2.1. The Middle-East and Africa C1 Inhibitors Market, by Country, 2020 – 2021 ()
      3. 5.8.3. The Middle-East and Africa C1 Inhibitors Market, by Source, 2020 – 2021
        1. 5.8.3.1. The Middle-East and Africa C1 Inhibitors Market, by Source, 2020 – 2021 (USD Million)
        2. 5.8.3.2. The Middle-East and Africa C1 Inhibitors Market, by Source, 2020 – 2021 ()
      4. 5.8.4. The Middle-East and Africa C1 Inhibitors Market, by Mode of Administration, 2020 – 2021
        1. 5.8.4.1. The Middle-East and Africa C1 Inhibitors Market, by Mode of Administration, 2020 – 2021 (USD Million)
        2. 5.8.4.2. The Middle-East and Africa C1 Inhibitors Market, by Mode of Administration, 2020 – 2021 ()
      5. 5.8.5. The Middle-East and Africa C1 Inhibitors Market, by End-Users, 2020 – 2021
        1. 5.8.5.1. The Middle-East and Africa C1 Inhibitors Market, by End-Users, 2020 – 2021 (USD Million)
        2. 5.8.5.2. The Middle-East and Africa C1 Inhibitors Market, by End-Users, 2020 – 2021 ()
      6. 5.8.6. GCC Countries
        1. 5.8.6.1. GCC Countries C1 Inhibitors Market, 2020 – 2021 (USD Million)
        2. 5.8.6.2. GCC Countries C1 Inhibitors Market, 2020 – 2021 ()
      7. 5.8.7. South Africa
        1. 5.8.7.1. South Africa C1 Inhibitors Market, 2020 – 2021 (USD Million)
        2. 5.8.7.2. South Africa C1 Inhibitors Market, 2020 – 2021 ()
      8. 5.8.8. Rest of Middle-East Africa
        1. 5.8.8.1. Rest of Middle-East Africa C1 Inhibitors Market, 2020 – 2021 (USD Million)
        2. 5.8.8.2. Rest of Middle-East Africa C1 Inhibitors Market, 2020 – 2021 ()
  6. Chapter 6 C1 Inhibitors Production, Consumption, Export, Import by Regions
    1. 6.1. Global C1 Inhibitors Production and Consumption, 2020 – 2021 ()
    2. 6.2. Global Import and Export Analysis, by Region
  7. Chapter 7 C1 Inhibitors Market – Competitive Landscape
    1. 7.1. Competitor Market Share – Revenue
    2. 7.2. Market Concentration Rate Analysis, Top 3 and Top 5 Players
    3. 7.3. Competitor Market Share – Volume
    4. 7.4. Strategic Developments
      1. 7.4.1. Acquisitions and Mergers
      2. 7.4.2. New Products
      3. 7.4.3. Research & Development Activities
  8. Chapter 8 Company Profiles
    1. 8.1. Shire
      1. 8.1.1. Company Overview
      2. 8.1.2. Product/Service Portfolio
      3. 8.1.3. Shire Sales, Revenue, Price, and Gross Margin
      4. 8.1.4. Shire Revenue and Growth Rate
      5. 8.1.5. Shire Market Share
      6. 8.1.6. Recent Initiatives, Funding/VC Activities, and Technological Innovations
    2. 8.2. CSL Behring
      1. 8.2.1. Company Overview
      2. 8.2.2. Product/Service Portfolio
      3. 8.2.3. CSL Behring Sales, Revenue, Price, and Gross Margin
      4. 8.2.4. CSL Behring Revenue and Growth Rate
      5. 8.2.5. CSL Behring Market Share
      6. 8.2.6. Recent Initiatives, Funding/VC Activities, and Technological Innovations
    3. 8.3. Lev Pharmaceuticals
      1. 8.3.1. Company Overview
      2. 8.3.2. Product/Service Portfolio
      3. 8.3.3. Lev Pharmaceuticals Sales, Revenue, Price, and Gross Margin
      4. 8.3.4. Lev Pharmaceuticals Revenue and Growth Rate
      5. 8.3.5. Lev Pharmaceuticals Market Share
      6. 8.3.6. Recent Initiatives, Funding/VC Activities, and Technological Innovations
    4. 8.4. Pharming Group
      1. 8.4.1. Company Overview
      2. 8.4.2. Product/Service Portfolio
      3. 8.4.3. Pharming Group Sales, Revenue, Price, and Gross Margin
      4. 8.4.4. Pharming Group Revenue and Growth Rate
      5. 8.4.5. Pharming Group Market Share
      6. 8.4.6. Recent Initiatives, Funding/VC Activities, and Technological Innovations
    5. 8.5. Salix Pharmaceuticals
      1. 8.5.1. Company Overview
      2. 8.5.2. Product/Service Portfolio
      3. 8.5.3. Salix Pharmaceuticals Sales, Revenue, Price, and Gross Margin
      4. 8.5.4. Salix Pharmaceuticals Revenue and Growth Rate
      5. 8.5.5. Salix Pharmaceuticals Market Share
      6. 8.5.6. Recent Initiatives, Funding/VC Activities, and Technological Innovations
    6. 8.6. Viropharma Biologics Inc
      1. 8.6.1. Company Overview
      2. 8.6.2. Product/Service Portfolio
      3. 8.6.3. Viropharma Biologics Inc Sales, Revenue, Price, and Gross Margin
      4. 8.6.4. Viropharma Biologics Inc Revenue and Growth Rate
      5. 8.6.5. Viropharma Biologics Inc Market Share
      6. 8.6.6. Recent Initiatives, Funding/VC Activities, and Technological Innovations
    7. 8.7. Ionis Pharmaceuticals Inc
      1. 8.7.1. Company Overview
      2. 8.7.2. Product/Service Portfolio
      3. 8.7.3. Ionis Pharmaceuticals Inc Sales, Revenue, Price, and Gross Margin
      4. 8.7.4. Ionis Pharmaceuticals Inc Revenue and Growth Rate
      5. 8.7.5. Ionis Pharmaceuticals Inc Market Share
      6. 8.7.6. Recent Initiatives, Funding/VC Activities, and Technological Innovations
    8. 8.8. iBio Inc
      1. 8.8.1. Company Overview
      2. 8.8.2. Product/Service Portfolio
      3. 8.8.3. iBio Inc Sales, Revenue, Price, and Gross Margin
      4. 8.8.4. iBio Inc Revenue and Growth Rate
      5. 8.8.5. iBio Inc Market Share
      6. 8.8.6. Recent Initiatives, Funding/VC Activities, and Technological Innovations
    9. 8.9. Sanquin
      1. 8.9.1. Company Overview
      2. 8.9.2. Product/Service Portfolio
      3. 8.9.3. Sanquin Sales, Revenue, Price, and Gross Margin
      4. 8.9.4. Sanquin Revenue and Growth Rate
      5. 8.9.5. Sanquin Market Share
      6. 8.9.6. Recent Initiatives, Funding/VC Activities, and Technological Innovations
    10. 8.10. BioCryst Pharmaceuticals
      1. 8.10.1. Company Overview
      2. 8.10.2. Product/Service Portfolio
      3. 8.10.3. BioCryst Pharmaceuticals Sales, Revenue, Price, and Gross Margin
      4. 8.10.4. BioCryst Pharmaceuticals Revenue and Growth Rate
      5. 8.10.5. BioCryst Pharmaceuticals Market Share
      6. 8.10.6. Recent Initiatives, Funding/VC Activities, and Technological Innovations
  9. Chapter 9 C1 Inhibitors — Industry Analysis
    1. 9.1. Introduction and Taxonomy
    2. 9.2. C1 Inhibitors Market – Key Trends
      1. 9.2.1. Market Drivers
      2. 9.2.2. Market Restraints
      3. 9.2.3. Market Opportunities
    3. 9.3. Value Chain Analysis
    4. 9.4. Key Mandates and Regulations
    5. 9.5. Technology Roadmap and Timeline
    6. 9.6. C1 Inhibitors Market – Attractiveness Analysis
      1. 9.6.1. By Source
      2. 9.6.2. By Mode of Administration
      3. 9.6.3. By End-Users
      4. 9.6.4. By Region
  10. Chapter 10 Raw Material Analysis
    1. 10.1. C1 Inhibitors Key Raw Material Analysis
      1. 10.1.1. Key Raw Materials
      2. 10.1.2. Price Trend of Key Raw Materials
    2. 10.2. Key Suppliers of Raw Materials
    3. 10.3. Proportion of Manufacturing Cost Structure
      1. 10.3.1. Raw Materials Cost
      2. 10.3.2. Labor Cost
      3. 10.3.3. Manufacturing Expenses
      4. 10.3.4. Miscellaneous Expenses
    4. 10.4. Manufacturing Cost Analysis of C1 Inhibitors
  11. Chapter 11 Industrial Chain, Sourcing Strategy, and Downstream Buyers
    1. 11.1. C1 Inhibitors Industrial Chain Analysis
    2. 11.2. Upstream Raw Materials Sourcing
      1. 11.2.1. Risk Mitigation:
      2. 11.2.2. Supplier Relationships:
      3. 11.2.3. Business Processes:
      4. 11.2.4. Securing the Product:
    3. 11.3. Raw Materials Sources of C1 Inhibitors Major Manufacturers
    4. 11.4. Downstream Buyers
    5. 11.5. Distributors/Traders List
  12. Chapter 12 Marketing Strategy Analysis, Distributors
    1. 12.1. Marketing Channel
    2. 12.2. Direct Marketing
    3. 12.3. Indirect Marketing
    4. 12.4. Marketing Channel Development Trends
    5. 12.5. Economic/Political Environmental Change
  13. Chapter 13 Report Conclusion & Key Insights
    1. 13.1. Key Insights from Primary Interviews & Surveys Respondents
    2. 13.2. Key Takeaways from Analysts, Consultants, and Industry Leaders
  14. Chapter 14 Research Approach & Methodology
    1. 14.1. Report Description
    2. 14.2. Research Scope
    3. 14.3. Research Methodology
      1. 14.3.1. Secondary Research
      2. 14.3.2. Primary Research
      3. 14.3.3. Statistical Models
        1. 14.3.3.1. Company Share Analysis Model
        2. 14.3.3.2. Revenue Based Modeling
      4. 14.3.4. Research Limitations

      List of Figures

      Fig.1	Product Picture of C1 Inhibitors
      Fig.2	Global C1 Inhibitors  Market, 2020 – 2021 (USD Million)
      Fig.3	Global C1 Inhibitors  Market, 2020 – 2021 ()
      Fig.4	Global C1 Inhibitors  Market Absolute Revenue Opportunity, 2020 – 2021 (USD Million)
      Fig.5	Global C1 Inhibitors  Market Incremental Revenue Opportunity, 2020 – 2021 (USD Million)
      Fig.6	Global C1 Inhibitors  Market Share, by Source, 2019 & 2021 (USD Million)
      Fig.7	Global C1 Inhibitors  Market Share, by Source, 2019 & 2021 ()
      Fig.8	Global Human Derived C1 Inhibitors  C1 Inhibitors  Market, 2020 – 2021 (USD Million)
      Fig.9	Global Human Derived C1 Inhibitors  C1 Inhibitors  Market, 2020 – 2021 ()
      Fig.10	Global Recombinant Derived C1 Inhibitors C1 Inhibitors  Market, 2020 – 2021 (USD Million)
      Fig.11	Global Recombinant Derived C1 Inhibitors C1 Inhibitors  Market, 2020 – 2021 ()
      Fig.12	Global C1 Inhibitors  Market Share, by Mode of Administration, 2019 & 2021 (USD Million)
      Fig.13	Global C1 Inhibitors  Market Share, by Mode of Administration, 2019 & 2021 ()
      Fig.14	Global Intravenous  C1 Inhibitors  Market, 2020 – 2021 (USD Million)
      Fig.15	Global Intravenous  C1 Inhibitors  Market, 2020 – 2021 ()
      Fig.16	Global Subcutaneous C1 Inhibitors  Market, 2020 – 2021 (USD Million)
      Fig.17	Global Subcutaneous C1 Inhibitors  Market, 2020 – 2021 ()
      Fig.18	Global C1 Inhibitors  Market Share, by End-Users, 2019 & 2021 (USD Million)
      Fig.19	Global C1 Inhibitors  Market Share, by End-Users, 2019 & 2021 ()
      Fig.20	Global Hospitals C1 Inhibitors  Market, 2020 – 2021 (USD Million)
      Fig.21	Global Hospitals C1 Inhibitors  Market, 2020 – 2021 ()
      Fig.22	Global Pharmacies C1 Inhibitors  Market, 2020 – 2021 (USD Million)
      Fig.23	Global Pharmacies C1 Inhibitors  Market, 2020 – 2021 ()
      Fig.24	Global C1 Inhibitors  Market Share, by Region, 2019 & 2021 (USD Million)
      Fig.25	Global C1 Inhibitors  Market Share, by Region, 2019 & 2021 ()
      Fig.26	North America C1 Inhibitors  Market, 2020 – 2021 (USD Million)
      Fig.27	North America C1 Inhibitors  Market, 2020 – 2021 ()
      Fig.28	U.S. C1 Inhibitors  Market, 2020 – 2021 (USD Million)
      Fig.29	U.S. C1 Inhibitors   Market, 2020 – 2021 ()
      Fig.30	Canada C1 Inhibitors  Market, 2020 – 2021 (USD Million)
      Fig.31	Canada C1 Inhibitors   Market, 2020 – 2021 ()
      Fig.32	Europe C1 Inhibitors  Market, 2020 – 2021 (USD Million)
      Fig.33	Europe C1 Inhibitors  Market, 2020 – 2021 ()
      Fig.34	Germany C1 Inhibitors  Market, 2020 – 2021 (USD Million)
      Fig.35	Germany C1 Inhibitors   Market, 2020 – 2021 ()
      Fig.36	France C1 Inhibitors  Market, 2020 – 2021 (USD Million)
      Fig.37	France C1 Inhibitors   Market, 2020 – 2021 ()
      Fig.38	U.K. C1 Inhibitors  Market, 2020 – 2021 (USD Million)
      Fig.39	U.K. C1 Inhibitors   Market, 2020 – 2021 ()
      Fig.40	Italy C1 Inhibitors  Market, 2020 – 2021 (USD Million)
      Fig.41	Italy C1 Inhibitors   Market, 2020 – 2021 ()
      Fig.42	Spain C1 Inhibitors  Market, 2020 – 2021 (USD Million)
      Fig.43	Spain C1 Inhibitors   Market, 2020 – 2021 ()
      Fig.44	Rest of Europe C1 Inhibitors  Market, 2020 – 2021 (USD Million)
      Fig.45	Rest of Europe C1 Inhibitors   Market, 2020 – 2021 ()
      Fig.46	Asia Pacific C1 Inhibitors  Market, 2020 – 2021 (USD Million)
      Fig.47	Asia Pacific C1 Inhibitors  Market, 2020 – 2021 ()
      Fig.48	China C1 Inhibitors  Market, 2020 – 2021 (USD Million)
      Fig.49	China C1 Inhibitors   Market, 2020 – 2021 ()
      Fig.50	Japan C1 Inhibitors  Market, 2020 – 2021 (USD Million)
      Fig.51	Japan C1 Inhibitors   Market, 2020 – 2021 ()
      Fig.52	India C1 Inhibitors  Market, 2020 – 2021 (USD Million)
      Fig.53	India C1 Inhibitors   Market, 2020 – 2021 ()
      Fig.54	South  Korea C1 Inhibitors  Market, 2020 – 2021 (USD Million)
      Fig.55	South  Korea C1 Inhibitors   Market, 2020 – 2021 ()
      Fig.56	South-East Asia C1 Inhibitors  Market, 2020 – 2021 (USD Million)
      Fig.57	South-East Asia C1 Inhibitors   Market, 2020 – 2021 ()
      Fig.58	Rest of Asia Pacific C1 Inhibitors  Market, 2020 – 2021 (USD Million)
      Fig.59	Rest of Asia Pacific C1 Inhibitors   Market, 2020 – 2021 ()
      Fig.60	Latin America C1 Inhibitors  Market, 2020 – 2021 (USD Million)
      Fig.61	Latin America C1 Inhibitors  Market, 2020 – 2021 ()
      Fig.62	Brazil C1 Inhibitors  Market, 2020 – 2021 (USD Million)
      Fig.63	Brazil C1 Inhibitors   Market, 2020 – 2021 ()
      Fig.64	Mexico C1 Inhibitors  Market, 2020 – 2021 (USD Million)
      Fig.65	Mexico C1 Inhibitors   Market, 2020 – 2021 ()
      Fig.66	Rest of Latin America C1 Inhibitors  Market, 2020 – 2021 (USD Million)
      Fig.67	Rest of Latin America C1 Inhibitors   Market, 2020 – 2021 ()
      Fig.68	The Middle-East and Africa C1 Inhibitors  Market, 2020 – 2021 (USD Million)
      Fig.69	The Middle-East and Africa C1 Inhibitors  Market, 2020 – 2021 ()
      Fig.70	GCC Countries C1 Inhibitors  Market, 2020 – 2021 (USD Million)
      Fig.71	GCC Countries C1 Inhibitors   Market, 2020 – 2021 ()
      Fig.72	South Africa C1 Inhibitors  Market, 2020 – 2021 (USD Million)
      Fig.73	South Africa C1 Inhibitors   Market, 2020 – 2021 ()
      Fig.74	Rest of Middle-East Africa C1 Inhibitors  Market, 2020 – 2021 (USD Million)
      Fig.75	Rest of Middle-East Africa C1 Inhibitors   Market, 2020 – 2021 ()
      Fig.76	Global C1 Inhibitors  Production and Consumption, 2020 – 2021 ()
      Fig.77	North America C1 Inhibitors  Production and Consumption, 2020 – 2021 (USD Million) ()
      Fig.78	Europe C1 Inhibitors  Production and Consumption, 2020 – 2021 (USD Million) ()
      Fig.79	Asia Pacific C1 Inhibitors  Production and Consumption, 2020 – 2021 (USD Million) ()
      Fig.80	Latin America C1 Inhibitors  Production and Consumption, 2020 – 2021 (USD Million) ()
      Fig.81	The Middle-East and Africa C1 Inhibitors  Production and Consumption, 2020 – 2021 (USD Million) ()
      Fig.82	Competitor Market Share – Revenue
      Fig.83	Competitor Market Share – Volume
      Fig.84	Shire Revenue and Growth Rate
      Fig.85	Shire Market Share
      Fig.86	CSL Behring Revenue and Growth Rate
      Fig.87	CSL Behring Market Share
      Fig.88	Lev Pharmaceuticals Revenue and Growth Rate
      Fig.89	Lev Pharmaceuticals Market Share
      Fig.90	Pharming Group Revenue and Growth Rate
      Fig.91	Pharming Group Market Share
      Fig.92	Salix Pharmaceuticals Revenue and Growth Rate
      Fig.93	Salix Pharmaceuticals Market Share
      Fig.94	Viropharma Biologics Inc Revenue and Growth Rate
      Fig.95	Viropharma Biologics Inc Market Share
      Fig.96	Ionis Pharmaceuticals Inc Revenue and Growth Rate
      Fig.97	Ionis Pharmaceuticals Inc Market Share
      Fig.98	iBio Inc Revenue and Growth Rate
      Fig.99	iBio Inc Market Share
      Fig.100	Sanquin Revenue and Growth Rate
      Fig.101	Sanquin Market Share
      Fig.102	BioCryst Pharmaceuticals Revenue and Growth Rate
      Fig.103	BioCryst Pharmaceuticals Market Share
      Fig.104	Market Dynamics
      Fig.105	Global C1 Inhibitors  – Value Chain Analysis
      Fig.106	Key Mandates and Regulations
      Fig.107	Technology Roadmap and Timeline
      Fig.108	Market Attractiveness Analysis – By Source
      Fig.109	Market Attractiveness Analysis – By Mode of Administration
      Fig.110	Market Attractiveness Analysis – By End-Users
      Fig.111	Market Attractiveness Analysis – By Region
      Fig.112	Manufacturing Cost Structure of C1 Inhibitors
      Fig.113	C1 Inhibitors  Industrial Chain Analysis
      Fig.114	Market Channels
      Fig.115	Marketing Channel Development Trend
      Fig.116	Growth in World Gross Product, 2008-2018
      

      List of Tables

      Table 1	Global C1 Inhibitors  Market, 2019 & 2021 (USD Million)
      Table 2	Global C1 Inhibitors  Market, by Source, 2020 – 2021 (USD Million)
      Table 3	Global C1 Inhibitors  Market, by Source, 2020 – 2021 ()
      Table 4	Global C1 Inhibitors  Market, by Mode of Administration, 2020 – 2021 (USD Million)
      Table 5	Global C1 Inhibitors  Market, by Mode of Administration, 2020 – 2021 ()
      Table 6	Global C1 Inhibitors  Market, by End-Users, 2020 – 2021 (USD Million)
      Table 7	Global C1 Inhibitors  Market, by End-Users, 2020 – 2021 ()
      Table 8	Global C1 Inhibitors  Market, by Region, 2020 – 2021 (USD Million)
      Table 9 Global C1 Inhibitors  Market, by Region, 2020 – 2021 ()
      Table 10 North America C1 Inhibitors  Market, by Country, 2020 – 2021 (USD Million)
      Table 11 North America C1 Inhibitors  Market, by Country, 2020 – 2021 ()
      Table 12 North America C1 Inhibitors  Market, by Source, 2020 – 2021 (USD Million)
      Table 13 North America C1 Inhibitors  Market, by Source, 2020 – 2021 ()
      Table 14 North America C1 Inhibitors  Market, by Mode of Administration, 2020 – 2021 (USD Million)
      Table 15 North America C1 Inhibitors  Market, by Mode of Administration, 2020 – 2021 ()
      Table 16 North America C1 Inhibitors  Market, by End-Users, 2020 – 2021 (USD Million)
      Table 17 North America C1 Inhibitors  Market, by End-Users, 2020 – 2021 ()
      Table 18 Europe C1 Inhibitors  Market, by Country, 2020 – 2021 (USD Million)
      Table 19 Europe C1 Inhibitors  Market, by Country, 2020 – 2021 ()
      Table 20 Europe C1 Inhibitors  Market, by Source, 2020 – 2021 (USD Million)
      Table 21 Europe C1 Inhibitors  Market, by Source, 2020 – 2021 ()
      Table 22 Europe C1 Inhibitors  Market, by Mode of Administration, 2020 – 2021 (USD Million)
      Table 23 Europe C1 Inhibitors  Market, by Mode of Administration, 2020 – 2021 ()
      Table 24 Europe C1 Inhibitors  Market, by End-Users, 2020 – 2021 (USD Million)
      Table 25 Europe C1 Inhibitors  Market, by End-Users, 2020 – 2021 ()
      Table 26 Asia Pacific C1 Inhibitors  Market, by Country, 2020 – 2021 (USD Million)
      Table 27 Asia Pacific C1 Inhibitors  Market, by Country, 2020 – 2021 ()
      Table 28 Asia Pacific C1 Inhibitors  Market, by Source, 2020 – 2021 (USD Million)
      Table 29 Asia Pacific C1 Inhibitors  Market, by Source, 2020 – 2021 ()
      Table 30 Asia Pacific C1 Inhibitors  Market, by Mode of Administration, 2020 – 2021 (USD Million)
      Table 31 Asia Pacific C1 Inhibitors  Market, by Mode of Administration, 2020 – 2021 ()
      Table 32 Asia Pacific C1 Inhibitors  Market, by End-Users, 2020 – 2021 (USD Million)
      Table 33 Asia Pacific C1 Inhibitors  Market, by End-Users, 2020 – 2021 ()
      Table 34 Latin America C1 Inhibitors  Market, by Country, 2020 – 2021 (USD Million)
      Table 35 Latin America C1 Inhibitors  Market, by Country, 2020 – 2021 ()
      Table 36 Latin America C1 Inhibitors  Market, by Source, 2020 – 2021 (USD Million)
      Table 37 Latin America C1 Inhibitors  Market, by Source, 2020 – 2021 ()
      Table 38 Latin America C1 Inhibitors  Market, by Mode of Administration, 2020 – 2021 (USD Million)
      Table 39 Latin America C1 Inhibitors  Market, by Mode of Administration, 2020 – 2021 ()
      Table 40 Latin America C1 Inhibitors  Market, by End-Users, 2020 – 2021 (USD Million)
      Table 41 Latin America C1 Inhibitors  Market, by End-Users, 2020 – 2021 ()
      Table 42 The Middle-East and Africa C1 Inhibitors  Market, by Country, 2020 – 2021 (USD Million)
      Table 43 The Middle-East and Africa C1 Inhibitors  Market, by Country, 2020 – 2021 ()
      Table 44 The Middle-East and Africa C1 Inhibitors  Market, by Source, 2020 – 2021 (USD Million)
      Table 45 The Middle-East and Africa C1 Inhibitors  Market, by Source, 2020 – 2021 ()
      Table 46 The Middle-East and Africa C1 Inhibitors  Market, by Mode of Administration, 2020 – 2021 (USD Million)
      Table 47 The Middle-East and Africa C1 Inhibitors  Market, by Mode of Administration, 2020 – 2021 ()
      Table 48 The Middle-East and Africa C1 Inhibitors  Market, by End-Users, 2020 – 2021 (USD Million)
      Table 49 The Middle-East and Africa C1 Inhibitors  Market, by End-Users, 2020 – 2021 ()
      Table 50 North America C1 Inhibitors  Production, Consumption, Export, Import, 2020 – 2019
      Table 51 Europe C1 Inhibitors  Production, Consumption, Export, Import, 2020 – 2019
      Table 52 Asia Pacific C1 Inhibitors  Production, Consumption, Export, Import, 2020 – 2019
      Table 53 Latin America C1 Inhibitors  Production, Consumption, Export, Import, 2020 – 2019
      Table 54 The Middle-East and Africa C1 Inhibitors  Production, Consumption, Export, Import, 2020 – 2019
      Table 55 Global C1 Inhibitors  Market - Company Revenue Analysis, 2016 – 2019 (USD Million)
      Table 56 Global C1 Inhibitors  Market - Company Revenue Share Analysis, 2016 – 2019 (%)
      Table 57 Global C1 Inhibitors  Market - Company Volume Analysis, 2020 – 2019 ()
      Table 58 Global C1 Inhibitors  Market - Company Volume Share Analysis, 2020 – 2019 (%)
      Table 59 Acquisitions and Mergers
      Table 60 Market Drivers – Impact Analysis
      Table 61 Market Restraints
      Table 62 Market Opportunities
      Table 63 Production Base and Market Concentration Rate of Raw Material
      Table 64 Key Suppliers of Raw Materials
      Table 65 Raw Materials Sources of C1 Inhibitors  Major Manufacturers
      Table 66 Major Buyers of C1 Inhibitors
      Table 67 Distributors/Traders of C1 Inhibitors  by Region
      

Industry Major Market Players

  • Shire
  • CSL Behring
  • Lev Pharmaceuticals
  • Pharming Group
  • Salix Pharmaceuticals
  • Viropharma Biologics Inc.
  • Ionis Pharmaceuticals Inc.
  • iBio Inc.
  • Sanquin
  • BioCryst Pharmaceuticals