Search Market Research Report

Discover Our Latest Reports
Discover Our Featured Reports
Discover Top Selling Reports

Bus Services Market Size, Share Global Analysis Report, 2020–2026

report img

Bus Services Market By Type (Light and Medium Type and Large Type) and Application (Urban Transport, Long Distance Transport, and Specialist Services): Global Industry Outlook, Market Size, Business Intelligence, Consumer Preferences, Statistical Surveys, Comprehensive Analysis, Historical Developments, Current Trends, and Forecast 2020–2026

Industry Insights

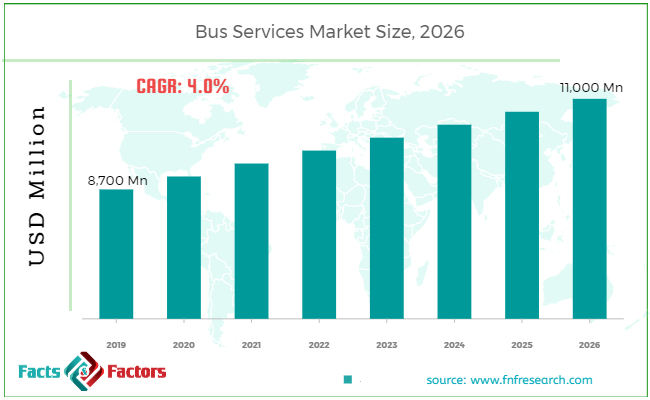
[225+ Pages Report] According to the report published by Facts Factors, the global bus services market size was worth around USD 8,700 Million in 2019 and is predicted to grow to around USD 11,000 Million by 2026 with a compound annual growth rate (CAGR) of roughly 4.0% between 2020 and 2026. The report analyzes the global bus services market drivers, restraints/challenges, and the effect they have on the demands during the projection period. In addition, the report explores emerging opportunities in the bus services market.

Bus Services Market

To know more about this report | Request Free Sample Copy

This specialized and expertise-oriented industry research report scrutinizes the technical and commercial business outlook of the bus services industry. The report analyzes and declares the historical and current trends analysis of the bus services industry and subsequently recommends the projected trends anticipated to be observed in bus services during the upcoming years.


logoKey Insights from Primary Research

  • According to our primary respondents, the global bus services market is expected to grow at an approximate CAGR of 4.0% over the projected period.
  • The global bus services market growth is directly attributable to the increase in the number of bus commuters around the world
  • On the basis of the type, the large bus type segment accounted for a major share of 70% in the global bus services market in 2019
  • Based on geography, Asia Pacific dominated the global bus services market in 2019 and is expected to grow at the fastest rate while recording a CAGR of nearly 5.0% till 2026
  • Based on the application, the specialist services segment is expected to record the fastest growth over the projected period, registering a CAGR of 4.5% till 2026.

logoKey Recommendations from Analysts

  • According to our analysts, the increase in the number of bus travelers in urban parts is expected to grow in years to come due to an increase in the number of private bus service providers, which is likely to drive the market.
  • Based on application, urban transport bus services held the second-largest share in the global bus services market accounting for a market share of nearly 30% in 2019.
  • Densely populated urban cities of China and India have been a key factor that has resulted in a large number of bus commuters in such parts, in turn, propelling the market growth.
  • Based on region, Europe held the second-largest share in the global bus services market in 2019, accounting for a market share of nearly 25%.
  • Our analysts also estimate that the global bus services market is likely to reach a market value of USD 11,000 million by 2025 and was valued at USD 8,700 million in 2019.

The bus services report analyzes and notifies the industry statistics at the global as well as regional and country levels in order to acquire a thorough perspective of the entire bus services market. The historical and past insights are provided for FY 2016 to FY 2019 whereas projected trends are delivered for FY 2020 to FY 2026. The quantitative and numerical data is represented in terms of value (USD Million) from FY 2016 – 2026.

The quantitative data is further underlined and reinforced by comprehensive qualitative data which comprises various across-the-board market dynamics. The rationales which directly or indirectly impact the bus services industry are exemplified through parameters such as growth drivers, restraints, challenges, and opportunities among other impacting factors.

Throughout our research report, we have encompassed all the proven models and tools of industry analysis and extensively illustrated all the key business strategies and business models adopted in the bus services industry. The report provides an all-inclusive and detailed competitive landscape prevalent in bus services.

logoReport Scope

Report Attribute

Details

Market Size in 2019

USD 8,700 Million

Projected Market Size in 2026

USD 11,000 Million

CAGR Growth Rate

4.0% CAGR

Base Year

2019

Forecast Years

2020-2026

Key Market Players

Beeline, Shuttl, DidiBus, CityFlo, ZipGo, and Others

Key Segment

By Type, Application, and Region

Major Regions Covered

North America, Europe, Asia Pacific, Latin America, and the Middle East & Africa

Purchase Options

Request customized purchase options to meet your research needs. Explore purchase options

The report utilizes established industry analysis tools and models such as Porter’s Five Forces framework to analyze and recognize critical business strategies adopted by various stakeholders involved in the entire value chain of the bus services industry. The bus services report additionally employs SWOT analysis and PESTLE analysis models for further in-depth analysis.

The report study further includes an in-depth analysis of industry players' market shares and provides an overview of leading players' market position in the bus services sector. Key strategic developments in the bus services competitive landscape such as acquisitions & mergers, inaugurations of different products and services, partnerships & joint ventures, MoU agreements, VC & funding activities, R&D activities, and geographic expansion among other noteworthy activities by key players of the bus services are appropriately highlighted in the report.

The bus services research report delivers an acute valuation and taxonomy of the bus services industry by practically splitting the market on the basis of different types, applications, and regions. Through the analysis of the historical and projected trends, all the segments and sub-segments were evaluated through the bottom-up approach, and different market sizes have been projected for FY 2020 to FY 2026. The regional segmentation of the bus services industry includes the complete classification of all the major continents including North America, Latin America, Europe, Asia Pacific, and the Middle East & Africa. Further, country-wise data for the bus services industry is provided for the leading economies of the world.

Bus transition has become one of the important parts of public transport all around the world. Bus service is the most common type of public transport used all around the world. Bus services have gained popularity among the middle-class and lower-middle-class populations due to the low cost and flexibility of bus transit. With the efficient design of public transport, bus services can be a more efficient and convenient replacement for private cars or vehicles.

In the last decades, government planning authorities have emphasized reducing the dependency on private automobile transit in urban cities, to avoid traffic congestion, and reduce air pollution in urban cities. This has influenced governments and federal authorities to invest in bus services and improve bus service planning. This has improved the efficiency of bus services. In turn, this drives the global bus services market. However, the use of personal vehicles for commutation is still favored by many urban populations, which is likely to hamper the global bus services market.

The bus services are segmented based on type, application, and region. On the basis of type, the bus services market is classified into the light and medium type and large types. Based on the application, the bus services market is classified into urban transport, long-distance transport, and specialist services.

logoSome of the essential players operating in the bus services, but not restricted to include 

  • Shuttl
  • ZipGo
  • CityFlo
  • Beeline
  • DidiBus

The taxonomy of the bus services market by its scope and segmentation is as follows:

logo By Type Segmentation Analysis

  • Light and Medium Type
  • Large Type
  • Urban Transport
  • Long Distance Transport
  • Specialist Services

logo By Application Segmentation Analysis

  • Urban Transport
  • Long Distance Transport
  • Specialist Services

logo Regional Segmentation Analysis

  • North America
    • The U.S.
    • Canada
  • Europe
    • Germany
    • The UK
    • France
    • Spain
    • Italy
    • Rest of Europe
  • Asia Pacific
    • China
    • Japan
    • India
    • South Korea
    • Southeast Asia
    • Rest of Asia Pacific
  • Latin America
    • Brazil
    • Mexico
    • Rest of Latin America
  • Middle East & Africa
    • GCC
    • South Africa
    • Rest of Middle East & Africa

Table of Content

  1. CHAPTER 1. Executive Summary
  2. CHAPTER 2. Bus Services market – Type Analysis
    1. 2.1. Global Bus Services Market–TypeOverview
    2. 2.2. Global Bus Services Market Share, by Type, 2019 & 2026 (USD Million)
    3. 2.3. Light and Medium Type
      1. 2.3.1. Global Light and Medium TypeBus Services Market,2016-2026 (USD Million)
    4. 2.4. Large Type
      1. 2.4.1. Global Large TypeBus Services Market,2016-2026 (USD Million)
  3. CHAPTER 3. Bus Services market – Application Analysis
    1. 3.1. Global Bus Services Market–ApplicationOverview
    2. 3.2. Global Bus Services Market Share, by Application, 2019 & 2026 (USD Million)
    3. 3.3. Urban Transport
      1. 3.3.1. Global Urban TransportBus Services Market,2016-2026 (USD Million)
    4. 3.4. Long Distance Transport
      1. 3.4.1. Global Long Distance TransportBus Services Market,2016-2026 (USD Million)
    5. 3.5. Specialist Services
      1. 3.5.1. Global Specialist Services Bus Services Market,2016-2026 (USD Million)
  4. CHAPTER 4. Bus Services market – Regional Analysis
    1. 4.1. Global Bus Services MarketRegionalOverview
    2. 4.2. Global Bus Services Market Share, by Region, 2019 & 2026 (Value)
    3. 4.3. North America
      1. 4.3.1. North America Bus Services Market size and forecast, 2016-2026
      2. 4.3.2. North America Bus Services Market, by Country, 2019 & 2026 (USD Million)
      3. 4.3.3. North America Bus Services Market, by Type, 2016-2026
        1. 4.3.3.1. North America Bus Services Market, by Type, 2016-2026 (USD Million)
      4. 4.3.4. North America Bus Services Market, by Application, 2016-2026
        1. 4.3.4.1. North America Bus Services Market, by Application, 2016-2026 (USD Million)
      5. 4.3.5. U.S.
        1. 4.3.5.1. U.S. Market size and forecast, 2016-2026 (USD Million)
      6. 4.3.6. Canada
        1. 4.3.6.1. Canada Market size and forecast, 2016-2026 (USD Million)
    4. 4.4. Europe
      1. 4.4.1. EuropeBus Services Market size and forecast, 2016-2026
      2. 4.4.2. EuropeBus Services Market, by Country, 2019 & 2026 (USD Million)
      3. 4.4.3. EuropeBus Services Market, by Type, 2016-2026
        1. 4.4.3.1. EuropeBus Services Market, by Type, 2016-2026 (USD Million)
      4. 4.4.4. EuropeBus Services Market, by Application, 2016-2026
        1. 4.4.4.1. EuropeBus Services Market, by Application, 2016-2026 (USD Million)
      5. 4.4.5. Germany
        1. 4.4.5.1. Germany Market size and forecast, 2016-2026 (USD Million)
      6. 4.4.6. France
        1. 4.4.6.1. France Market size and forecast, 2016-2026 (USD Million)
      7. 4.4.7. U.K.
        1. 4.4.7.1. U.K. Market size and forecast, 2016-2026 (USD Million)
      8. 4.4.8. Italy
        1. 4.4.8.1. Italy Market size and forecast, 2016-2026 (USD Million)
      9. 4.4.9. Spain
        1. 4.4.9.1. Spain Market size and forecast, 2016-2026 (USD Million)
      10. 4.4.10. Rest of Europe
        1. 4.4.10.1. Rest of Europe Market size and forecast, 2016-2026 (USD Million)
    5. 4.5. Asia Pacific
      1. 4.5.1. Asia Pacific Bus Services Market size and forecast, 2016-2026
      2. 4.5.2. Asia Pacific Bus Services Market, by Country, 2019 & 2026 (USD Million)
      3. 4.5.3. Asia Pacific Bus Services Market, by Type, 2016-2026
        1. 4.5.3.1. Asia Pacific Bus Services Market, by Type, 2016-2026 (USD Million)
      4. 4.5.4. Asia Pacific Bus Services Market, by Application, 2016-2026
        1. 4.5.4.1. Asia Pacific Bus Services Market, by Application, 2016-2026 (USD Million)
      5. 4.5.5. China
        1. 4.5.5.1. China Market size and forecast, 2016-2026 (USD Million)
      6. 4.5.6. Japan
        1. 4.5.6.1. Japan Market size and forecast, 2016-2026 (USD Million)
      7. 4.5.7. India
        1. 4.5.7.1. India Market size and forecast, 2016-2026 (USD Million)
      8. 4.5.8. South Korea
        1. 4.5.8.1. South Korea Market size and forecast, 2016-2026 (USD Million)
      9. 4.5.9. South-East Asia
        1. 4.5.9.1. South-East Asia Market size and forecast, 2016-2026 (USD Million)
      10. 4.5.10. Rest of Asia Pacific
        1. 4.5.10.1. Rest of Asia Pacific Market size and forecast, 2016-2026 (USD Million)
    6. 4.6. Latin America
      1. 4.6.1. Latin America Bus Services Market size and forecast, 2016-2026
      2. 4.6.2. Latin America Bus Services Market, by Country, 2019 & 2026 (USD Million)
      3. 4.6.3. Latin America Bus Services Market, by Type, 2016-2026
        1. 4.6.3.1. Latin America Bus Services Market, by Type, 2016-2026 (USD Million)
      4. 4.6.4. Latin America Bus Services Market, by Application, 2016-2026
        1. 4.6.4.1. Latin America Bus Services Market, by Application, 2016-2026 (USD Million)
      5. 4.6.5. Brazil
        1. 4.6.5.1. Brazil Market size and forecast, 2016-2026 (USD Million)
      6. 4.6.6. Mexico
        1. 4.6.6.1. Mexico Market size and forecast, 2016-2026 (USD Million)
      7. 4.6.7. Rest of Latin America
        1. 4.6.7.1. Rest of Latin America Market size and forecast, 2016-2026 (USD Million)
    7. 4.7. The Middle-East and Africa
      1. 4.7.1. The Middle-East and Africa Bus Services Market size and forecast, 2016-2026
      2. 4.7.2. The Middle-East and Africa Bus Services Market, by Country, 2019 & 2026 (USD Million)
      3. 4.7.3. The Middle-East and Africa Bus Services Market, by Type, 2016-2026
        1. 4.7.3.1. The Middle-East and Africa Bus Services Market, by Type, 2016-2026 (USD Million)
      4. 4.7.4. The Middle-East and Africa Bus Services Market, by Application, 2016-2026
        1. 4.7.4.1. The Middle-East and Africa Bus Services Market, by Application, 2016-2026 (USD Million)
      5. 4.7.5. GCC Countries
        1. 4.7.5.1. GCC Countries Market size and forecast, 2016-2026 (USD Million)
      6. 4.7.6. South Africa
        1. 4.7.6.1. South Africa Market size and forecast, 2016-2026 (USD Million)
      7. 4.7.7. Rest of Middle-East Africa
        1. 4.7.7.1. Rest of Middle-East Africa Market size and forecast, 2016-2026 (USD Million)
  5. CHAPTER 5. Bus Services market – Competitive Landscape
    1. 5.1. Competitor Market Share – Revenue
    2. 5.2. Market Concentration Rate Analysis, Top 3 and Top 5 Players
    3. 5.3. Strategic Development
      1. 5.3.1. Acquisitions and Mergers
      2. 5.3.2. New Products
      3. 5.3.3. Research & Development Activities
  6. CHAPTER 6. Company Profiles
    1. 6.1. Shuttl
      1. 6.1.1. Company Overview
      2. 6.1.2. ShuttlRevenue and Gross Margin
      3. 6.1.3. Product portfolio
      4. 6.1.4. Recent initiatives
    2. 6.2. ZipGo
      1. 6.2.1. Company Overview
      2. 6.2.2. ZipGo Revenue and Gross Margin
      3. 6.2.3. Product portfolio
      4. 6.2.4. Recent initiatives
    3. 6.3. CityFlo
      1. 6.3.1. Company Overview
      2. 6.3.2. CityFloRevenue and Gross Margin
      3. 6.3.3. Product portfolio
      4. 6.3.4. Recent initiatives
    4. 6.4. Beeline
      1. 6.4.1. Company Overview
      2. 6.4.2. BeelineRevenue and Gross Margin
      3. 6.4.3. Product portfolio
      4. 6.4.4. Recent initiatives
    5. 6.5. DidiBus
      1. 6.5.1. Company Overview
      2. 6.5.2. DidiBusRevenue and Gross Margin
      3. 6.5.3. Product portfolio
      4. 6.5.4. Recent initiatives
  7. CHAPTER 7. Bus Services — Industry Analysis
    1. 7.1. Bus Services Market – Key Trends
      1. 7.1.1. Market Drivers
      2. 7.1.2. Market Restraints
      3. 7.1.3. Market Opportunities
    2. 7.2. Value Chain Analysis
    3. 7.3. Technology Roadmap and Timeline
    4. 7.4. Bus Services Market – Attractiveness Analysis
      1. 7.4.1. By Type
      2. 7.4.2. By Application
      3. 7.4.3. By Region
  8. CHAPTER 8. Marketing Strategy Analysis, Distributors
    1. 8.1. Marketing Channel
    2. 8.2. Direct Marketing
    3. 8.3. Indirect Marketing
    4. 8.4. Marketing Channel Development Trend
    5. 8.5. Economic/Political Environmental Change
  9. CHAPTER 9. Report Conclusion
  10. CHAPTER 10. Research Approach & Methodology
    1. 10.1. Report Description
    2. 10.2. Research Scope
    3. 10.3. Research Methodology
      1. 10.3.1. Secondary Research
      2. 10.3.2. Primary Research
      3. 10.3.3. Models
        1. 10.3.3.1. Company Share Analysis Model
        2. 10.3.3.2. Revenue Based Modeling
        3. 10.3.3.3. Research Limitations

        List of Figures

        FIG. 1 Global Bus Services Market, 2016-2026(USD Million)
        FIG. 2 Global Bus Services Market Share, by Type, 2019 & 2026 (USD Million)
        FIG. 3 Global Light and Medium TypeBus Services Market,2016-2026 (USD Million)
        FIG. 4 Global Large TypeBus Services Market,2016-2026 (USD Million)
        FIG. 5 Global Bus Services Market Share, by Application, 2019 & 2026 (USD Million)
        FIG. 6 Global Urban TransportBus Services Market,2016-2026 (USD Million)
        FIG. 7 Global Long Distance TransportBus Services Market,2016-2026 (USD Million)
        FIG. 8 Global Specialist Services Bus Services Market,2016-2026 (USD Million)
        FIG. 9 Global Bus Services Market Share, by Region, 2019 & 2026
        FIG. 10 North America Bus Services Market, 2016-2026
        FIG. 11 U.S.Bus Services Market, 2016-2026
        FIG. 12 CanadaBus Services Market, 2016-2026
        FIG. 13 EuropeBus Services Market, 2016-2026
        FIG. 14 GermanyBus Services Market, 2016-2026
        FIG. 15 FranceBus Services Market, 2016-2026
        FIG. 16 U.K.Bus Services Market, 2016-2026
        FIG. 17 ItalyBus Services Market, 2016-2026
        FIG. 18 SpainBus Services Market, 2016-2026
        FIG. 19 Rest of EuropeBus Services Market, 2016-2026
        FIG. 20 Asia Pacific Bus Services Market, 2016-2026
        FIG. 21 ChinaBus Services Market, 2016-2026
        FIG. 22 JapanBus Services Market, 2016-2026
        FIG. 23 IndiaBus Services Market, 2016-2026
        FIG. 24 South  KoreaBus Services Market, 2016-2026
        FIG. 25 South-East AsiaBus Services Market, 2016-2026
        FIG. 26 Rest of Asia Pacific Bus Services Market, 2016-2026
        FIG. 27 Latin America Bus Services Market, 2016-2026
        FIG. 28 BrazilBus Services Market, 2016-2026
        FIG. 29 MexicoBus Services Market, 2016-2026
        FIG. 30 Rest of Latin America Bus Services Market, 2016-2026
        FIG. 31 The Middle-East and Africa Bus Services Market, 2016-2026
        FIG. 32 GCC CountriesBus Services Market, 2016-2026
        FIG. 33 South Africa Bus Services Market, 2016-2026
        FIG. 34 Rest of Middle-East Africa Bus Services Market, 2016-2026
        FIG. 35 Competitor Market Share – Revenue
        FIG. 36 Shuttl Revenue and Growth Rate
        FIG. 37 Shuttl Market Share
        FIG. 38 ZipGo Revenue and Growth Rate
        FIG. 39 ZipGo Market Share
        FIG. 40 CityFlo Revenue and Growth Rate
        FIG. 41 CityFlo Market Share
        FIG. 42 Beeline Revenue and Growth Rate
        FIG. 43 Beeline Market Share
        FIG. 44 DidiBus Revenue and Growth Rate
        FIG. 45 DidiBus Market Share
        FIG. 46 Market Dynamics
        FIG. 47 Global Bus Services – Value Chain Analysis
        FIG. 48 Technology Roadmap and Timeline
        FIG. 49 Market Attractiveness Analysis – By Type
        FIG. 50 Market Attractiveness Analysis – By Application
        FIG. 51 Market Attractiveness Analysis – By Region
        FIG. 52 Market Channel
        FIG. 53 Marketing Channel Development Trend
        FIG. 54 Growth in World Gross Product, 2008-2019

        List of Tables

        TABLE 1 Global Bus Services Market, 2019& 2026 (USD Million)
        TABLE 2 Global Bus Services market, by Type, 2016-2026 (USD Million)
        TABLE 3 Global Bus Services market, by Application, 2016-2026 (USD Million)
        TABLE 4 Global Bus Services market, by Region, 2016-2026 (USD Million)
        TABLE 5 North America Bus Services Market, by Type, 2016-2026 (USD Million)
        TABLE 6 North America Bus Services Market, by Application, 2016-2026 (USD Million)
        TABLE 7 EuropeBus Services Market, by Type, 2016-2026 (USD Million)
        TABLE 8 EuropeBus Services Market, by Application, 2016-2026 (USD Million)
        TABLE 9 Asia Pacific Bus Services Market, by Type, 2016-2026 (USD Million)
        TABLE 10 Asia Pacific Bus Services Market, by Application, 2016-2026 (USD Million)
        TABLE 11 Latin America Bus Services Market, by Type, 2016-2026 (USD Million)
        TABLE 12 Latin America Bus Services Market, by Application, 2016-2026 (USD Million)
        TABLE 13 The Middle-East and Africa Bus Services Market, by Type, 2016-2026 (USD Million)
        TABLE 14 The Middle-East and Africa Bus Services Market, by Application, 2016-2026 (USD Million)
        TABLE 15 Global Bus Services Market - Company Revenue Analysis 2016-2019 (USD Million)
        TABLE 16 Global Bus Services Market - Company Revenue Share Analysis 2016-2019(%)
        TABLE 17 Acquisitions and Mergers
        TABLE 18 New Product/Service Launch
        TABLE 19 Research & Development Activities
        TABLE 20 Market Drivers
        TABLE 21 Market Restraints
        TABLE 22 Market Opportunities
        

Industry Major Market Players

  • Shuttl
  • ZipGo
  • CityFlo
  • Beeline
  • DidiBus