Search Market Research Report

Discover Our Latest Reports
Discover Our Featured Reports
Discover Top Selling Reports

Bus Seats Market Size, Share Global Analysis Report, 2020–2026

report img

Bus Seats Market By Comfort Type (Comfort Seat and Standard Seat), By Seat Type (Recliner Seat, Regular Passenger Seat, Folding Seat, Integrated Child Seat, Driver Seat, and Others), and By Bus Type (School Bus, Transit Bus, Coach Bus, and Other Bus Type): Global Industry Outlook, Market Size, Business Intelligence, Consumer Preferences, Statistical Surveys, Comprehensive Analysis, Historical Developments, Current Trends, and Forecast 2020–2026

Industry Insights

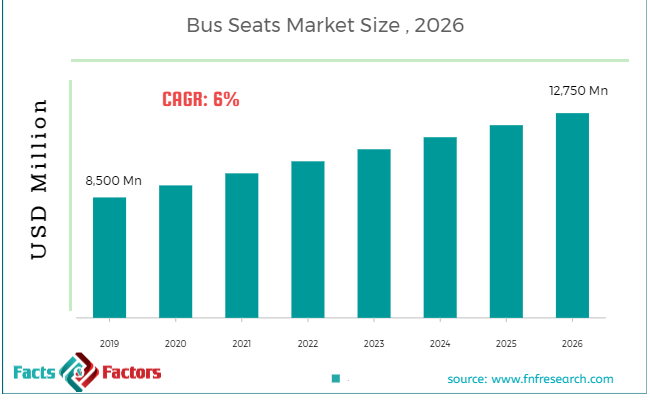
[188+ Pages Report] According to the report published by Facts Factors, the global bus seats market size was worth around USD 8,500 million in 2019 and is predicted to grow to around USD 12,750 million by 2026 with a compound annual growth rate (CAGR) of roughly 6% between 2020 and 2026. The report analyzes the global bus seats market drivers, restraints/challenges, and the effect they have on the demands during the projection period. In addition, the report explores emerging opportunities in the bus seats market.

Bus Seats Market

To know more about this report | Request Free Sample Copy

This specialized and expertise oriented industry research report scrutinizes the technical and commercial business outlook of the Bus Seats industry. The report analyzes and declares the historical and current trends analysis of the Bus Seats industry and subsequently recommends the projected trends anticipated to be observed in the Bus seats market during the upcoming years.

The bus seats market report analyzes and notifies the industry statistics at the global as well as regional and country levels in order to acquire a thorough perspective of the entire Bus Seats market. The historical and past insights are provided for FY 2016 to FY 2019 whereas projected trends are delivered for FY 2020 to FY 2026. The quantitative and numerical data is represented in terms of both volume (Million Units) and value (USD Million) from FY 2016 – 2026.

The quantitative data is further underlined and reinforced by comprehensive qualitative data which comprises various across-the-board market dynamics. The rationales which directly or indirectly impact the Bus Seats industry are exemplified through parameters such as growth drivers, restraints, challenges, and opportunities among other impacting factors.


logoKey Insights from Primary Research

  • According to the interview with industry participants, the government in numerous countries is encouraging public transport operators to make things easy for passengers. This has driven the target market growth
  • The target market is coming up with new ideas to provide durable and comfortable seats to passengers. This has surged the target market growth
  • Target market generated revenue of around USD 8,500 Million in 2019
  • The Asia Pacific was the leading region associated with the target market in 2019
  • Standard seat, regular passenger seat, and transit bus categories were the major revenue-generating categories of comfort type, seat type, and bus type segments

logoKey Recommendations from Analysts

  • As per our analyst, rising demand for transportation mediums coupled with the rising rate of bus transportation services has also propelled the target market growth
  • Target market is anticipated to generate revenue of around USD 12,750 Million in 2026
  • The Asia Pacific is expected to be the dominating region in 2026 as well
  • Standard seat, regular passenger seat, and transit bus categories are anticipated to be the leading categories of comfort type, seat type, and bus type segments in 2026
  • Target market is estimated to grow at CAGR of around 6%

logo
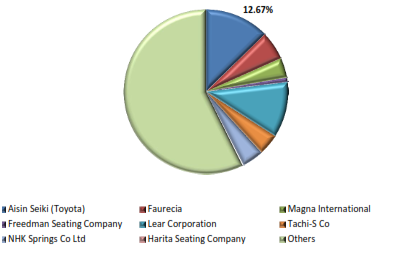
Competitor Sales Value Market Share

Bus Seats Market

To know more about this report | Request Free Sample Copy


Throughout our research report, we have encompassed all the proven models and tools of industry analysis and extensively illustrated all the key business strategies and business models adopted in the Bus Seats industry. The report provides an all-inclusive and detailed competitive landscape prevalent in the Bus Seats market.

The report utilizes established industry analysis tools and models such as Porter’s Five Forces framework to analyze and recognize critical business strategies adopted by various stakeholders involved in the entire value chain of the Bus Seats industry. The Bus Seats market report additionally employs SWOT analysis and PESTLE analysis models for further in-depth analysis.

The report study further includes an in-depth analysis of industry players' market shares and provides an overview of leading players' market position in the Bus Seats sector. Key strategic developments in the Bus Seats market competitive landscape such as acquisitions & mergers, inaugurations of different products and services, partnerships & joint ventures, MoU agreements, VC & funding activities, R&D activities, and geographic expansion among other noteworthy activities by key players of the Bus Seats market are appropriately highlighted in the report.

Target market players are concentrating to improve their solutions in terms of bus seats associated with the needs of companies, travelers, as well as local authorities. This has augmented the target market. In addition, manufacturers are enhancing the networks in accordance with real passenger flows and their usages associated with bus seats. This has been propelling the target market growth.

Moreover, the development of new formulas coupled with the launch of advanced quality products associated with bus seats by prominent target market players is expected to create lucrative opportunities for the target market key players. The main focus of target market key players is product quality and reliability. This may enhance the target market growth over the forecast period.

The Bus Seats market research report delivers an acute valuation and taxonomy of the Bus Seats industry by practically splitting the market on the basis of different comfort types, seat types, bus types, and regions. Through the analysis of the historical and projected trends, all the segments and sub-segments were evaluated through the bottom-up approach, and different market sizes have been projected for FY 2020 to FY 2026.

logoReport Scope

Report Attribute

Details

Market Size in 2019

USD 8,500 Million

Projected Market Size in 2026

USD 12,750 Million

CAGR Growth Rate

6% CAGR

Base Year

2019

Forecast Years

2020-2026

Key Market Players

Faurecia, Aisin Seiki (Toyota), Magna International, Freedman Seating Company, Lear Corporation, Tachi-S Co, NHK Springs Co Ltd, Harita Seating Company, and Others

Key Segment

By Comfort, Seat, Bus, and Region

Major Regions Covered

North America, Europe, Asia Pacific, Latin America, and the Middle East & Africa

Purchase Options

Request customized purchase options to meet your research needs.Explore purchase options

The regional segmentation of the Bus Seats industry includes the complete classification of all the major continents including North America, Latin America, Europe, Asia Pacific, and Middle East & Africa. Further, country-wise data for the Bus Seats industry is provided for the leading economies of the world.

The Bus Seats market is segmented based on comfort types, seat types, bus type. On the basis of comfort type segmentation, the market is classified into a comfort seat and standard seat. In terms of seat type segmentation, the market is bifurcated into recliner seat, regular passenger seat, folding seat, integrated child seat, driver seat, and others. In terms of bus type segmentation, the market is bifurcated into school bus, transit bus, coach bus, and another bus type.

logoSome of the essential players operating in the Bus Seats market, but not restricted to include

  •  Faurecia
  •  Aisin Seiki (Toyota)
  •  Magna International
  •  Freedman Seating Company
  •  Lear Corporation
  •  Tachi-S Co
  •  NHK Springs Co Ltd
  •  Harita Seating Company

.The taxonomy of the Bus Seats industry by its scope and segmentation is as follows:

logoBy Comfort Type Segmentation Analysis

  • Comfort Seat
  • Standard Seat

logoBy Seat Type Segmentation Analysis

  • Recliner Seat
  • Regular Passenger Seat
  • Folding Seat
  • Integrated Child Seat
  • Driver Seat
  • Others

logoBy Bus Type Segmentation Analysis

  • Recliner Seat
  • School Bus
  • Transit Bus
  • Coach Bus
  • Other Bus Type

logoBy Regional Segmentation Analysis

  • North America
    • The U.S.
    • Canada
  • Europe
    • Germany
    • The UK
    • France
    • Spain
    • Italy
    • Rest of Europe
  • Asia Pacific
    • China
    • Japan
    • India
    • South Korea
    • Southeast Asia
    • Rest of Asia Pacific
  • Latin America
    • Brazil
    • Mexico
    • Rest of Latin America
  • Middle East & Africa
    • GCC
    • South Africa
    • Rest of Middle East & Africa

Table of Content

  1. CHAPTER 1. Executive Summary
  2. CHAPTER 2. Bus Seats market – Comfort Type Analysis
    1. 2.1. Global Bus Seats Market – Comfort Type Overview
    2. 2.2. Global Bus Seats Market Share, by Comfort Type, 2018 & 2025 (USD Million)
    3. 2.3. Global Bus Seats Market share, by Comfort Type, 2018 & 2025 (Million Units)
    4. 2.4. Comfort Seat
      1. 2.4.1. Global Comfort Seat Bus Seats Market, 2016-2026 (USD Million)
      2. 2.4.2. Global Comfort Seat Bus Seats Market, 2016-2026 (Million Units)
    5. 2.5. Standard Seat
      1. 2.5.1. Global Standard Seat Bus Seats Market, 2016-2026 (USD Million)
      2. 2.5.2. Global Standard Seat Bus Seats Market, 2016-2026 (Million Units)
  3. CHAPTER 3. Bus Seats market – Seat Type Analysis
    1. 3.1. Global Bus Seats Market – Seat Type Overview
    2. 3.2. Global Bus Seats Market Share, by Seat Type, 2018 & 2025 (USD Million)
    3. 3.3. Global Bus Seats Market share, by Seat Type, 2018 & 2025 (Million Units)
    4. 3.4. Recliner Seat
      1. 3.4.1. Global Recliner Seat Bus Seats Market, 2016-2026 (USD Million)
      2. 3.4.2. Global Recliner Seat Bus Seats Market, 2016-2026 (Million Units)
    5. 3.5. Regular Passenger Seat
      1. 3.5.1. Global Regular Passenger Seat Bus Seats Market, 2016-2026 (USD Million)
      2. 3.5.2. Global Regular Passenger Seat Bus Seats Market, 2016-2026 (Million Units)
    6. 3.6. Folding Seat
      1. 3.6.1. Global Folding Seat Bus Seats Market, 2016-2026 (USD Million)
      2. 3.6.2. Global Folding Seat Bus Seats Market, 2016-2026 (Million Units)
    7. 3.7. Integrated Child Seat
      1. 3.7.1. Global Integrated Child Seat Bus Seats Market, 2016-2026 (USD Million)
      2. 3.7.2. Global Integrated Child Seat Bus Seats Market, 2016-2026 (Million Units)
    8. 3.8. Driver Seat
      1. 3.8.1. Global Driver Seat Bus Seats Market, 2016-2026 (USD Million)
      2. 3.8.2. Global Driver Seat Bus Seats Market, 2016-2026 (Million Units)
  4. CHAPTER 4. Bus Seats market – Bus Type Analysis
    1. 4.1. Global Bus Seats Market – Bus Type Overview
    2. 4.2. Global Bus Seats Market Share, by Bus Type, 2018 & 2025 (USD Million)
    3. 4.3. Global Bus Seats Market share, by Bus Type, 2018 & 2025 (Million Units)
    4. 4.4. School Bus
      1. 4.4.1. Global School Bus Bus Seats Market, 2016-2026 (USD Million)
      2. 4.4.2. Global School Bus Bus Seats Market, 2016-2026 (Million Units)
    5. 4.5. Transit Bus
      1. 4.5.1. Global Transit Bus Bus Seats Market, 2016-2026 (USD Million)
      2. 4.5.2. Global Transit Bus Bus Seats Market, 2016-2026 (Million Units)
    6. 4.6. Coach Bus
      1. 4.6.1. Global Coach Bus Bus Seats Market, 2016-2026 (USD Million)
      2. 4.6.2. Global Coach Bus Bus Seats Market, 2016-2026 (Million Units)
    7. 4.7. Other Bus Type
      1. 4.7.1. Global Other Bus Type Bus Seats Market, 2016-2026 (USD Million)
      2. 4.7.2. Global Other Bus Type Bus Seats Market, 2016-2026 (Million Units)
  5. CHAPTER 5. Bus Seats market – Regional Analysis
    1. 5.1. Global Bus Seats Market Regional Overview
    2. 5.2. Global Bus Seats Market Share, by Region, 2018 & 2025 (Value)
    3. 5.3. Global Bus Seats Market Share, by Region, 2018 & 2025 (Volume)
    4. 5.4. North America
      1. 5.4.1. North America Bus Seats Market size and forecast, 2016-2026
      2. 5.4.2. North America Bus Seats Market, by Country, 2018 - 2025 (USD Million)
      3. 5.4.3. North America Market size and forecast, 2016-2026 (Million Units)
      4. 5.4.4. North America Bus Seats Market, by Country, 2018 - 2025 (Million Units)
      5. 5.4.5. North America Bus Seats Market, by Comfort Type, 2016-2026
        1. 5.4.5.1. North America Bus Seats Market, by Comfort Type, 2016-2026 (USD Million)
        2. 5.4.5.2. North America Bus Seats Market, by Comfort Type, 2016-2026 (Million Units)
      6. 5.4.6. North America Bus Seats Market, by Seat Type, 2016-2026
        1. 5.4.6.1. North America Bus Seats Market, by Seat Type, 2016-2026 (USD Million)
        2. 5.4.6.2. North America Bus Seats Market, by Seat Type, 2016-2026 (Million Units)
      7. 5.4.7. North America Bus Seats Market, by Bus Type, 2016-2026
        1. 5.4.7.1. North America Bus Seats Market, by Bus Type, 2016-2026 (USD Million)
        2. 5.4.7.2. North America Bus Seats Market, by Bus Type, 2016-2026 (Million Units)
      8. 5.4.8. U.S.
        1. 5.4.8.1. U.S. Market size and forecast, 2016-2026 (USD Million)
        2. 5.4.8.2. U.S. Market size and forecast, 2016-2026 (Million Units)
      9. 5.4.9. Canada
        1. 5.4.9.1. Canada Market size and forecast, 2016-2026 (USD Million)
        2. 5.4.9.2. Canada Market size and forecast, 2016-2026 (Million Units)
    5. 5.5. Europe
      1. 5.5.1. Europe Bus Seats Market size and forecast, 2016-2026
      2. 5.5.2. Europe Bus Seats Market, by Country, 2018 - 2025 (USD Million)
      3. 5.5.3. Europe Market size and forecast, 2016-2026 (Million Units)
      4. 5.5.4. Europe Bus Seats Market, by Country, 2018 - 2025 (Million Units)
      5. 5.5.5. Europe Bus Seats Market, by Comfort Type, 2016-2026
        1. 5.5.5.1. Europe Bus Seats Market, by Comfort Type, 2016-2026 (USD Million)
        2. 5.5.5.2. Europe Bus Seats Market, by Comfort Type, 2016-2026 (Million Units)
      6. 5.5.6. Europe Bus Seats Market, by Seat Type, 2016-2026
        1. 5.5.6.1. Europe Bus Seats Market, by Seat Type, 2016-2026 (USD Million)
        2. 5.5.6.2. Europe Bus Seats Market, by Seat Type, 2016-2026 (Million Units)
      7. 5.5.7. Europe Bus Seats Market, by Bus Type, 2016-2026
        1. 5.5.7.1. Europe Bus Seats Market, by Bus Type, 2016-2026 (USD Million)
        2. 5.5.7.2. Europe Bus Seats Market, by Bus Type, 2016-2026 (Million Units)
      8. 5.5.8. Germany
        1. 5.5.8.1. Germany Market size and forecast, 2016-2026 (USD Million)
        2. 5.5.8.2. Germany Market size and forecast, 2016-2026 (Million Units)
      9. 5.5.9. France
        1. 5.5.9.1. France Market size and forecast, 2016-2026 (USD Million)
        2. 5.5.9.2. France Market size and forecast, 2016-2026 (Million Units)
      10. 5.5.10. U.K.
        1. 5.5.10.1. U.K. Market size and forecast, 2016-2026 (USD Million)
        2. 5.5.10.2. U.K. Market size and forecast, 2016-2026 (Million Units)
      11. 5.5.11. Italy
        1. 5.5.11.1. Italy Market size and forecast, 2016-2026 (USD Million)
        2. 5.5.11.2. Italy Market size and forecast, 2016-2026 (Million Units)
      12. 5.5.12. Spain
        1. 5.5.12.1. Spain Market size and forecast, 2016-2026 (USD Million)
        2. 5.5.12.2. Spain Market size and forecast, 2016-2026 (Million Units)
      13. 5.5.13. Rest of Europe
        1. 5.5.13.1. Rest of Europe Market size and forecast, 2016-2026 (USD Million)
        2. 5.5.13.2. Rest of Europe Market size and forecast, 2016-2026 (Million Units)
    6. 5.6. Asia Pacific
      1. 5.6.1. Asia Pacific Bus Seats Market size and forecast, 2016-2026
      2. 5.6.2. Asia Pacific Bus Seats Market, by Country, 2018 - 2025 (USD Million)
      3. 5.6.3. Asia Pacific Market size and forecast, 2016-2026 (Million Units)
      4. 5.6.4. Asia Pacific Bus Seats Market, by Country, 2018 - 2025 (Million Units)
      5. 5.6.5. Asia Pacific Bus Seats Market, by Comfort Type, 2016-2026
        1. 5.6.5.1. Asia Pacific Bus Seats Market, by Comfort Type, 2016-2026 (USD Million)
        2. 5.6.5.2. Asia Pacific Bus Seats Market, by Comfort Type, 2016-2026 (Million Units)
      6. 5.6.6. Asia Pacific Bus Seats Market, by Seat Type, 2016-2026
        1. 5.6.6.1. Asia Pacific Bus Seats Market, by Seat Type, 2016-2026 (USD Million)
        2. 5.6.6.2. Asia Pacific Bus Seats Market, by Seat Type, 2016-2026 (Million Units)
      7. 5.6.7. Asia Pacific Bus Seats Market, by Bus Type, 2016-2026
        1. 5.6.7.1. Asia Pacific Bus Seats Market, by Bus Type, 2016-2026 (USD Million)
        2. 5.6.7.2. Asia Pacific Bus Seats Market, by Bus Type, 2016-2026 (Million Units)
      8. 5.6.8. China
        1. 5.6.8.1. China Market size and forecast, 2016-2026 (USD Million)
        2. 5.6.8.2. China Market size and forecast, 2016-2026 (Million Units)
      9. 5.6.9. Japan
        1. 5.6.9.1. Japan Market size and forecast, 2016-2026 (USD Million)
        2. 5.6.9.2. Japan Market size and forecast, 2016-2026 (Million Units)
      10. 5.6.10. India
        1. 5.6.10.1. India Market size and forecast, 2016-2026 (USD Million)
        2. 5.6.10.2. India Market size and forecast, 2016-2026 (Million Units)
      11. 5.6.11. South Korea
        1. 5.6.11.1. South Korea Market size and forecast, 2016-2026 (USD Million)
        2. 5.6.11.2. South Korea Market size and forecast, 2016-2026 (Million Units)
      12. 5.6.12. South-East Asia
        1. 5.6.12.1. South-East Asia Market size and forecast, 2016-2026 (USD Million)
        2. 5.6.12.2. South-East Asia Market size and forecast, 2016-2026 (Million Units)
      13. 5.6.13. Rest of Asia Pacific
        1. 5.6.13.1. Rest of Asia Pacific Market size and forecast, 2016-2026 (USD Million)
        2. 5.6.13.2. Rest of Asia Pacific Market size and forecast, 2016-2026 (Million Units)
    7. 5.7. Latin America
      1. 5.7.1. Latin America Bus Seats Market size and forecast, 2016-2026
      2. 5.7.2. Latin America Bus Seats Market, by Country, 2018 - 2025 (USD Million)
      3. 5.7.3. Latin America Market size and forecast, 2016-2026 (Million Units)
      4. 5.7.4. Latin America Bus Seats Market, by Country, 2018 - 2025 (Million Units)
      5. 5.7.5. Latin America Bus Seats Market, by Comfort Type, 2016-2026
        1. 5.7.5.1. Latin America Bus Seats Market, by Comfort Type, 2016-2026 (USD Million)
        2. 5.7.5.2. Latin America Bus Seats Market, by Comfort Type, 2016-2026 (Million Units)
      6. 5.7.6. Latin America Bus Seats Market, by Seat Type, 2016-2026
        1. 5.7.6.1. Latin America Bus Seats Market, by Seat Type, 2016-2026 (USD Million)
        2. 5.7.6.2. Latin America Bus Seats Market, by Seat Type, 2016-2026 (Million Units)
      7. 5.7.7. Latin America Bus Seats Market, by Bus Type, 2016-2026
        1. 5.7.7.1. Latin America Bus Seats Market, by Bus Type, 2016-2026 (USD Million)
        2. 5.7.7.2. Latin America Bus Seats Market, by Bus Type, 2016-2026 (Million Units)
      8. 5.7.8. Brazil
        1. 5.7.8.1. Brazil Market size and forecast, 2016-2026 (USD Million)
        2. 5.7.8.2. Brazil Market size and forecast, 2016-2026 (Million Units)
      9. 5.7.9. Mexico
        1. 5.7.9.1. Mexico Market size and forecast, 2016-2026 (USD Million)
        2. 5.7.9.2. Mexico Market size and forecast, 2016-2026 (Million Units)
      10. 5.7.10. Rest of Latin America
        1. 5.7.10.1. Rest of Latin America Market size and forecast, 2016-2026 (USD Million)
        2. 5.7.10.2. Rest of Latin America Market size and forecast, 2016-2026 (Million Units)
    8. 5.8. The Middle-East and Africa
      1. 5.8.1. The Middle-East and Africa Bus Seats Market size and forecast, 2016-2026
      2. 5.8.2. The Middle-East and Africa Bus Seats Market, by Country, 2018 - 2025 (USD Million)
      3. 5.8.3. The Middle-East and Africa Market size and forecast, 2016-2026 (Million Units)
      4. 5.8.4. The Middle-East and Africa Bus Seats Market, by Country, 2018 - 2025 (Million Units)
      5. 5.8.5. The Middle-East and Africa Bus Seats Market, by Comfort Type, 2016-2026
        1. 5.8.5.1. The Middle-East and Africa Bus Seats Market, by Comfort Type, 2016-2026 (USD Million)
        2. 5.8.5.2. The Middle-East and Africa Bus Seats Market, by Comfort Type, 2016-2026 (Million Units)
      6. 5.8.6. The Middle-East and Africa Bus Seats Market, by Seat Type, 2016-2026
        1. 5.8.6.1. The Middle-East and Africa Bus Seats Market, by Seat Type, 2016-2026 (USD Million)
        2. 5.8.6.2. The Middle-East and Africa Bus Seats Market, by Seat Type, 2016-2026 (Million Units)
      7. 5.8.7. The Middle-East and Africa Bus Seats Market, by Bus Type, 2016-2026
        1. 5.8.7.1. The Middle-East and Africa Bus Seats Market, by Bus Type, 2016-2026 (USD Million)
        2. 5.8.7.2. The Middle-East and Africa Bus Seats Market, by Bus Type, 2016-2026 (Million Units)
      8. 5.8.8. GCC Countries
        1. 5.8.8.1. GCC Countries Market size and forecast, 2016-2026 (USD Million)
        2. 5.8.8.2. GCC Countries Market size and forecast, 2016-2026 (Million Units)
      9. 5.8.9. South Africa
        1. 5.8.9.1. South Africa Market size and forecast, 2016-2026 (USD Million)
        2. 5.8.9.2. South Africa Market size and forecast, 2016-2026 (Million Units)
      10. 5.8.10. Rest of Middle-East Africa
        1. 5.8.10.1. Rest of Middle-East Africa Market size and forecast, 2016-2026 (USD Million)
        2. 5.8.10.2. Rest of Middle-East Africa Market size and forecast, 2016-2026 (Million Units)
  6. CHAPTER 6. Bus Seats Production, Consumption, Export, Import by Regions
    1. 6.1. Global Bus Seats production and revenue, 2015-2025 (USD Million) (Million Units)
    2. 6.2. Global Import and Export Analysis, by Region
  7. CHAPTER 7. Bus Seats market – Competitive Landscape
    1. 7.1. Competitor Market Share – Revenue
    2. 7.2. Market Concentration Rate Analysis, Top 3 and Top 5 Players
    3. 7.3. Competitor Market Share – Volume
    4. 7.4. Strategic Development
      1. 7.4.1. Acquisitions and Mergers
      2. 7.4.2. New Products
      3. 7.4.3. Research & Development Activities
  8. CHAPTER 8. Company Profiles
    1. 8.1. Faurecia
      1. 8.1.1. Company Overview
      2. 8.1.2. Faurecia Sales, Revenue, Price, and Gross Margin
      3. 8.1.3. Product portfolio
      4. 8.1.4. Recent initiatives
    2. 8.2. Aisin Seiki (Toyota)
      1. 8.2.1. Company Overview
      2. 8.2.2. Aisin Seiki (Toyota) Sales, Revenue, Price, and Gross Margin
      3. 8.2.3. Product portfolio
      4. 8.2.4. Recent initiatives
    3. 8.3. Magna International
      1. 8.3.1. Company Overview
      2. 8.3.2. Magna International Sales, Revenue, Price, and Gross Margin
      3. 8.3.3. Product portfolio
      4. 8.3.4. Recent initiatives
    4. 8.4. Freedman Seating Company
      1. 8.4.1. Company Overview
      2. 8.4.2. Freedman Seating Company Sales, Revenue, Price, and Gross Margin
      3. 8.4.3. Product portfolio
      4. 8.4.4. Recent initiatives
    5. 8.5. Lear Corporation
      1. 8.5.1. Company Overview
      2. 8.5.2. Lear Corporation Sales, Revenue, Price, and Gross Margin
      3. 8.5.3. Product portfolio
      4. 8.5.4. Recent initiatives
    6. 8.6. Tachi-S Co
      1. 8.6.1. Company Overview
      2. 8.6.2. Tachi-S Co Sales, Revenue, Price, and Gross Margin
      3. 8.6.3. Product portfolio
      4. 8.6.4. Recent initiatives
    7. 8.7. NHK Springs Co Ltd
      1. 8.7.1. Company Overview
      2. 8.7.2. NHK Springs Co Ltd Sales, Revenue, Price, and Gross Margin
      3. 8.7.3. Product portfolio
      4. 8.7.4. Recent initiatives
    8. 8.8. Harita Seating Company
      1. 8.8.1. Company Overview
      2. 8.8.2. Harita Seating Company Sales, Revenue, Price, and Gross Margin
      3. 8.8.3. Product portfolio
      4. 8.8.4. Recent initiatives
    9. 8.9. Others
      1. 8.9.1. Company Overview
      2. 8.9.2. Others Sales, Revenue, Price, and Gross Margin
      3. 8.9.3. Product portfolio
      4. 8.9.4. Recent initiatives
  9. CHAPTER 9. Bus Seats — Industry Analysis
    1. 9.1. Introduction and Taxonomy
    2. 9.2. Bus Seats Market – Key Trends
      1. 9.2.1. Market Drivers
      2. 9.2.2. Market Restraints
      3. 9.2.3. Market Opportunities
    3. 9.3. Value Chain Analysis
    4. 9.4. Key Mandates and Regulations
    5. 9.5. Technology Roadmap and Timeline
    6. 9.6. Bus Seats market – Attractiveness Analysis
      1. 9.6.1. By Comfort Type
      2. 9.6.2. By Seat Type
      3. 9.6.3. By Bus Type
      4. 9.6.4. By Region
  10. CHAPTER 10. Raw Material analysis
    1. 10.1. Bus Seats Key Raw Material Analysis
      1. 10.1.1. Key Raw Materials
      2. 10.1.2. Price Trend of Key Raw Materials
    2. 10.2. Key Suppliers of Raw Materials
    3. 10.3. Proportion of Manufacturing Cost Structure
      1. 10.3.1. Raw Materials
      2. 10.3.2. Labor Cost
    4. 10.4. Manufacturing Expenses Analysis of Bus Seats
  11. CHAPTER 11. Industrial Chain, Sourcing Strategy and Downstream Buyers
    1. 11.1. Bus Seats Industrial Chain Analysis
    2. 11.2. Upstream Raw Materials Sourcing
      1. 11.2.1. Risk Mitigation:
      2. 11.2.2. Supplier Relationships:
      3. 11.2.3. Business Processes:
      4. 11.2.4. Securing the Product:
    3. 11.3. Raw Materials Sources of Bus Seats Major Manufacturers in 2016
    4. 11.4. Downstream Buyers
    5. 11.5. Distributors/Traders List
  12. CHAPTER 12. Marketing Strategy Analysis, Distributors
    1. 12.1. Marketing Channel
    2. 12.2. Direct Marketing
    3. 12.3. Indirect Marketing
    4. 12.4. Marketing Channel Development Trend
    5. 12.5. Economic/Political Environmental Change
  13. CHAPTER 13. Report Conclusion
  14. CHAPTER 14. Research Approach & Methodology
    1. 14.1. Report Description
    2. 14.2. Research Scope
    3. 14.3. Research Methodology
      1. 14.3.1. Secondary Research
      2. 14.3.2. Primary Research
      3. 14.3.3. Models
        1. 14.3.3.1. Company Share Analysis Model
        2. 14.3.3.2. Revenue Based Modeling
        3. 14.3.3.3. Research Limitations

        List of Figures

        FIG. 1 Global Bus Seats Market, 2016-2026 (USD Million)
        FIG. 2 Global Bus Seats Market Share, by Comfort Type, 2018 & 2025 (USD Million)
        FIG. 3 Global Bus Seats Market share, by Comfort Type, 2018 & 2025 (Million Units)
        FIG. 4 Global Comfort Seat Bus Seats Market, 2016-2026 (USD Million)
        FIG. 5 Global Comfort Seat Bus Seats  Market, 2016-2026 (Million Units)
        FIG. 6 Global Standard Seat Bus Seats Market, 2016-2026 (USD Million)
        FIG. 7 Global Standard Seat Bus Seats  Market, 2016-2026 (Million Units)
        FIG. 8 Global Bus Seats Market Share, by Seat Type, 2018 & 2025 (USD Million)
        FIG. 9 Global Bus Seats Market share, by Seat Type, 2018 & 2025 (Million Units)
        FIG. 10 Global Recliner Seat Bus Seats Market, 2016-2026 (USD Million)
        FIG. 11 Global Recliner Seat Bus Seats  Market, 2016-2026 (Million Units)
        FIG. 12 Global Regular Passenger Seat Bus Seats Market, 2016-2026 (USD Million)
        FIG. 13 Global Regular Passenger Seat Bus Seats  Market, 2016-2026 (Million Units)
        FIG. 14 Global Folding Seat Bus Seats Market, 2016-2026 (USD Million)
        FIG. 15 Global Folding Seat Bus Seats  Market, 2016-2026 (Million Units)
        FIG. 16 Global Integrated Child Seat Bus Seats Market, 2016-2026 (USD Million)
        FIG. 17 Global Integrated Child Seat Bus Seats  Market, 2016-2026 (Million Units)
        FIG. 18 Global Driver Seat Bus Seats Market, 2016-2026 (USD Million)
        FIG. 19 Global Driver Seat Bus Seats  Market, 2016-2026 (Million Units)
        FIG. 20 Global Bus Seats Market Share, by Bus Type, 2018 & 2025 (USD Million)
        FIG. 21 Global Bus Seats Market share, by Bus Type, 2018 & 2025 (Million Units)
        FIG. 22 Global School Bus Bus Seats Market, 2016-2026 (USD Million)
        FIG. 23 Global School Bus Bus Seats  Market, 2016-2026 (Million Units)
        FIG. 24 Global Transit Bus Bus Seats Market, 2016-2026 (USD Million)
        FIG. 25 Global Transit Bus Bus Seats  Market, 2016-2026 (Million Units)
        FIG. 26 Global Coach Bus Bus Seats Market, 2016-2026 (USD Million)
        FIG. 27 Global Coach Bus Bus Seats  Market, 2016-2026 (Million Units)
        FIG. 28 Global Other Bus Type Bus Seats Market, 2016-2026 (USD Million)
        FIG. 29 Global Other Bus Type Bus Seats  Market, 2016-2026 (Million Units)
        FIG. 30 Global Bus Seats Market Share, by Region, 2018 & 2025
        FIG. 31 Global Bus Seats Market Share, by Region, 2018 & 2025
        FIG. 32 North America Bus Seats Market, 2016-2026
        FIG. 33 North America Bus Seats  Market, 2016-2026 (Million Units)
        FIG. 34 U.S. Bus Seats Market, 2016-2026
        FIG. 35 U.S. Bus Seats  Market, 2016-2026 (Million Units)
        FIG. 36 Canada Bus Seats Market, 2016-2026
        FIG. 37 Canada Bus Seats  Market, 2016-2026 (Million Units)
        FIG. 38 Europe Bus Seats Market, 2016-2026
        FIG. 39 Europe Bus Seats  Market, 2016-2026 (Million Units)
        FIG. 40 Germany Bus Seats Market, 2016-2026
        FIG. 41 Germany Bus Seats  Market, 2016-2026 (Million Units)
        FIG. 42 France Bus Seats Market, 2016-2026
        FIG. 43 France Bus Seats  Market, 2016-2026 (Million Units)
        FIG. 44 U.K. Bus Seats Market, 2016-2026
        FIG. 45 U.K. Bus Seats  Market, 2016-2026 (Million Units)
        FIG. 46 Italy Bus Seats Market, 2016-2026
        FIG. 47 Italy Bus Seats  Market, 2016-2026 (Million Units)
        FIG. 48 Spain Bus Seats Market, 2016-2026
        FIG. 49 Spain Bus Seats  Market, 2016-2026 (Million Units)
        FIG. 50 Rest of Europe Bus Seats Market, 2016-2026
        FIG. 51 Rest of Europe Bus Seats  Market, 2016-2026 (Million Units)
        FIG. 52 Asia Pacific Bus Seats Market, 2016-2026
        FIG. 53 Asia Pacific Bus Seats  Market, 2016-2026 (Million Units)
        FIG. 54 China Bus Seats Market, 2016-2026
        FIG. 55 China Bus Seats  Market, 2016-2026 (Million Units)
        FIG. 56 Japan Bus Seats Market, 2016-2026
        FIG. 57 Japan Bus Seats  Market, 2016-2026 (Million Units)
        FIG. 58 India Bus Seats Market, 2016-2026
        FIG. 59 India Bus Seats  Market, 2016-2026 (Million Units)
        FIG. 60 South  Korea Bus Seats Market, 2016-2026
        FIG. 61 South  Korea Bus Seats  Market, 2016-2026 (Million Units)
        FIG. 62 South-East Asia Bus Seats Market, 2016-2026
        FIG. 63 South-East Asia Bus Seats  Market, 2016-2026 (Million Units)
        FIG. 64 Rest of Asia Pacific Bus Seats Market, 2016-2026
        FIG. 65 Rest of Asia Pacific Bus Seats  Market, 2016-2026 (Million Units)
        FIG. 66 Latin America Bus Seats Market, 2016-2026
        FIG. 67 Latin America Bus Seats  Market, 2016-2026 (Million Units)
        FIG. 68 Brazil Bus Seats Market, 2016-2026
        FIG. 69 Brazil Bus Seats  Market, 2016-2026 (Million Units)
        FIG. 70 Mexico Bus Seats Market, 2016-2026
        FIG. 71 Mexico Bus Seats  Market, 2016-2026 (Million Units)
        FIG. 72 Rest of Latin America Bus Seats Market, 2016-2026
        FIG. 73 Rest of Latin America Bus Seats  Market, 2016-2026 (Million Units)
        FIG. 74 The Middle-East and Africa Bus Seats Market, 2016-2026
        FIG. 75 The Middle-East and Africa Bus Seats  Market, 2016-2026 (Million Units)
        FIG. 76 GCC Countries Bus Seats Market, 2016-2026
        FIG. 77 GCC Countries Bus Seats  Market, 2016-2026 (Million Units)
        FIG. 78 South Africa Bus Seats Market, 2016-2026
        FIG. 79 South Africa Bus Seats  Market, 2016-2026 (Million Units)
        FIG. 80 Rest of Middle-East Africa Bus Seats Market, 2016-2026
        FIG. 81 Rest of Middle-East Africa Bus Seats  Market, 2016-2026 (Million Units)
        FIG. 82 Global Bus Seats production and revenue, 2015-2025 (USD Million) (Million Units)
        FIG. 83 North America Bus Seats production and revenue, 2015-2025 (USD Million) (Million Units)
        FIG. 84 Europe Bus Seats production and revenue, 2015-2025 (USD Million) (Million Units)
        FIG. 85 Asia Pacific Bus Seats production and revenue, 2015-2025 (USD Million) (Million Units)
        FIG. 86 Latin America Bus Seats production and revenue, 2015-2025 (USD Million) (Million Units)
        FIG. 87 Middle East and Africa Bus Seats production and revenue, 2015-2025 (USD Million) (Million Units)
        FIG. 88 Competitor Market Share – Revenue
        FIG. 89 Competitor Market Share – Volume
        FIG. 90 Faurecia Revenue and Growth Rate
        FIG. 91 Faurecia Market Share
        FIG. 92 Aisin Seiki (Toyota) Revenue and Growth Rate
        FIG. 93 Aisin Seiki (Toyota) Market Share
        FIG. 94 Magna International Revenue and Growth Rate
        FIG. 95 Magna International Market Share
        FIG. 96 Freedman Seating Company Revenue and Growth Rate
        FIG. 97 Freedman Seating Company Market Share
        FIG. 98 Lear Corporation Revenue and Growth Rate
        FIG. 99 Lear Corporation Market Share
        FIG. 100 Tachi-S Co Revenue and Growth Rate
        FIG. 101 Tachi-S Co Market Share
        FIG. 102 NHK Springs Co Ltd Revenue and Growth Rate
        FIG. 103 NHK Springs Co Ltd Market Share
        FIG. 104 Harita Seating Company Revenue and Growth Rate
        FIG. 105 Harita Seating Company Market Share
        FIG. 106 Others Revenue and Growth Rate
        FIG. 107 Others Market Share
        FIG. 108 Market Dynamics
        FIG. 109 Global Bus Seats – Value Chain Analysis
        FIG. 110 Key Mandates and Regulations
        FIG. 111 Technology Roadmap and Timeline
        FIG. 112 Market Attractiveness Analysis – By Comfort Type
        FIG. 113 Market Attractiveness Analysis – By Seat Type
        FIG. 114 Market Attractiveness Analysis – By Bus Type
        FIG. 115 Market Attractiveness Analysis – By Region
        FIG. 116 Manufacturing Cost Structure of Bus Seats
        FIG. 117 Bus Seats Industrial Chain Analysis
        FIG. 118 Market Channel
        FIG. 119 Marketing Channel Development Trend
        FIG. 120 Growth in World Gross Product, 2008-2018

        List of Tables

        TABLE 1 Global Bus Seats market, 2018 & 2025 (USD Million)
        TABLE 2 Global Bus Seats market, by Comfort Type, 2016-2026 (USD Million)
        TABLE 3 Global Bus Seats market, by Comfort Type, 2016-2026 (Million Units)
        TABLE 4 Global Bus Seats market, by Seat Type, 2016-2026 (USD Million)
        TABLE 5 Global Bus Seats market, by Seat Type, 2016-2026 (Million Units)
        TABLE 6 Global Bus Seats market, by Bus Type, 2016-2026 (USD Million)
        TABLE 7 Global Bus Seats market, by Bus Type, 2016-2026 (Million Units)
        TABLE 8 Global Bus Seats market, by region, 2016-2026 (USD Million)
        TABLE 9 Global Bus Seats market, by region, 2016-2026 (Million Units)
        TABLE 10 North America Bus Seats Market, by Comfort Type, 2016-2026 (USD Million)
        TABLE 11 North America Bus Seats Market, by Comfort Type, 2016-2026 (Million Units)
        TABLE 12 North America Bus Seats Market, by Seat Type, 2016-2026 (USD Million)
        TABLE 13 North America Bus Seats Market, by Seat Type, 2016-2026 (Million Units)
        TABLE 14 North America Bus Seats Market, by Bus Type, 2016-2026 (USD Million)
        TABLE 15 North America Bus Seats Market, by Bus Type, 2016-2026 (Million Units)
        TABLE 16 Europe Bus Seats Market, by Comfort Type, 2016-2026 (USD Million)
        TABLE 17 Europe Bus Seats Market, by Comfort Type, 2016-2026 (Million Units)
        TABLE 18 Europe Bus Seats Market, by Seat Type, 2016-2026 (USD Million)
        TABLE 19 Europe Bus Seats Market, by Seat Type, 2016-2026 (Million Units)
        TABLE 20 Europe Bus Seats Market, by Bus Type, 2016-2026 (USD Million)
        TABLE 21 Europe Bus Seats Market, by Bus Type, 2016-2026 (Million Units)
        TABLE 22 Asia Pacific Bus Seats Market, by Comfort Type, 2016-2026 (USD Million)
        TABLE 23 Asia Pacific Bus Seats Market, by Comfort Type, 2016-2026 (Million Units)
        TABLE 24 Asia Pacific Bus Seats Market, by Seat Type, 2016-2026 (USD Million)
        TABLE 25 Asia Pacific Bus Seats Market, by Seat Type, 2016-2026 (Million Units)
        TABLE 26 Asia Pacific Bus Seats Market, by Bus Type, 2016-2026 (USD Million)
        TABLE 27 Asia Pacific Bus Seats Market, by Bus Type, 2016-2026 (Million Units)
        TABLE 28 Latin America Bus Seats Market, by Comfort Type, 2016-2026 (USD Million)
        TABLE 29 Latin America Bus Seats Market, by Comfort Type, 2016-2026 (Million Units)
        TABLE 30 Latin America Bus Seats Market, by Seat Type, 2016-2026 (USD Million)
        TABLE 31 Latin America Bus Seats Market, by Seat Type, 2016-2026 (Million Units)
        TABLE 32 Latin America Bus Seats Market, by Bus Type, 2016-2026 (USD Million)
        TABLE 33 Latin America Bus Seats Market, by Bus Type, 2016-2026 (Million Units)
        TABLE 34 The Middle-East and Africa Bus Seats Market, by Comfort Type, 2016-2026 (USD Million)
        TABLE 35 The Middle-East and Africa Bus Seats Market, by Comfort Type, 2016-2026 (Million Units)
        TABLE 36 The Middle-East and Africa Bus Seats Market, by Seat Type, 2016-2026 (USD Million)
        TABLE 37 The Middle-East and Africa Bus Seats Market, by Seat Type, 2016-2026 (Million Units)
        TABLE 38 The Middle-East and Africa Bus Seats Market, by Bus Type, 2016-2026 (USD Million)
        TABLE 39 The Middle-East and Africa Bus Seats Market, by Bus Type, 2016-2026 (Million Units)
        TABLE 40 North America Bus Seats Production, Consumption, Export, Import, 2016-2019
        TABLE 41 Europe Bus Seats Production, Consumption, Export, Import, 2016-2019
        TABLE 42 Asia Pacific Bus Seats Production, Consumption, Export, Import, 2016-2019
        TABLE 43 Latin America Bus Seats Production, Consumption, Export, Import, 2016-2019
        TABLE 44 Middle East & Africa Bus Seats Production, Consumption, Export, Import, 2016-2019
        TABLE 45 Global Bus Seats Market - Company Revenue Analysis 2016-2019 (USD Million)
        TABLE 46 Global Bus Seats Market - Company Revenue Share Analysis 2016-2019(%)
        TABLE 47 Global Bus Seats Market - Company Volume Analysis 2016-2019 (Million Units)
        TABLE 48 Global Bus Seats Market - Company Volume Share Analysis 2016-2019(%)
        TABLE 49 Acquisitions and Mergers
        TABLE 50 New Product/Service Launch
        TABLE 51 Research & Development Activities
        TABLE 52 Market Drivers
        TABLE 53 Market Restraints
        TABLE 54 Market Opportunities
        TABLE 55 Production Base and Market Concentration Rate of Raw Material
        TABLE 56 Key Suppliers of Raw Materials
        TABLE 57 Raw Materials Sources of Bus Seats Major Manufacturers in 2016
        TABLE 58 Major Buyers of Bus Seats
        TABLE 59 Distributors/Traders of Bus Seats by Region
        

Industry Major Market Players

  •  Faurecia
  •  Aisin Seiki (Toyota)
  •  Magna International
  •  Freedman Seating Company
  •  Lear Corporation
  •  Tachi-S Co
  •  NHK Springs Co Ltd
  •  Harita Seating Company