Search Market Research Report

Discover Our Latest Reports
Discover Our Featured Reports
Discover Top Selling Reports

Building Optimization And Commissioning Services Market Size, Share Global Analysis Report, 2025 – 2034

report img

Building Optimization And Commissioning Services Market Size, Share, Growth Analysis Report By Building Type (Commercial, Industrial, And Residential Buildings), By Building Optimization Technology (Automated Control Systems, Energy Management Systems, Building Automation Systems, And Others), By Service (Retro-Commissioning, Re-Commissioning, New Construction Commissioning, And Others), And By Region - Global Industry Insights, Overview, Comprehensive Analysis, Trends, Statistical Research, Market Intelligence, Historical Data and Forecast 2025 – 2034

Industry Insights

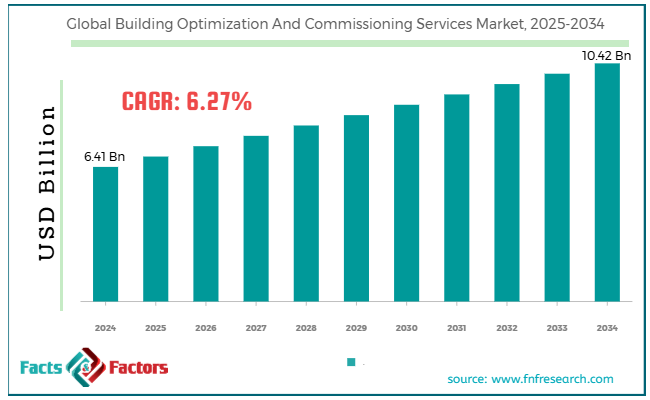
[217+ Pages Report] According to Facts & Factors, the global building optimization and commissioning services market size was valued at USD 6.41 billion in 2024 and is predicted to surpass USD 10.42 billion by the end of 2034. The building optimization and commissioning services industry is expected to grow by a CAGR of 6.27% between 2025 and 2034.

Global Building Optimization And Commissioning Services Market Size

To know more about this report | Request Free Sample Copy

logoMarket Overview

Building optimization and commissioning services encompass a comprehensive range of technical, engineering, and consulting services that help optimize the efficient operation of a building's systems. There are various types of commissioning services available on the market, including new building commissioning, re-commissioning, retro-commissioning, continuous commissioning, and others. End-users can adopt any kind of commissioning as per their requirements. Building optimization refers to the fine-tuning of operational systems, which helps improve comfort, energy efficiency, and equipment life.

logoKey Insights

  • As per the analysis shared by our research analyst, the global building optimization and commissioning services market size is estimated to grow annually at a CAGR of around 6.27% over the forecast period (2025-2034).
  • In terms of revenue, the global building optimization and commissioning services market size was valued at around USD 6.41 billion in 2024 and is projected to reach USD 10.42 billion by 2034.
  • The growing demand for green building certification is driving the growth of the global building optimization and commissioning services market.
  • Based on the building type, the commercial building segment is growing at a high rate and is projected to dominate the global market.
  • Based on building optimization technology, the building automation system segment is anticipated to grow with the highest CAGR in the global market.
  • Based on the service, the retro-commissioning segment is projected to swipe the largest market share. 
  • Based on region, North America is expected to dominate the global market during the forecast period.

logo Growth Drivers

  • How will growing demand for green building certification drive the growth of the global building optimization and commissioning services market?

There are several crucial green building certifications, including LEED, WELL, BREEAM, CASBEE, Green Mark, and GRIHA, which are prerequisites for organizations seeking certification. These certifications are crucial for organizations to achieve their corporate ESG goals, such as ZEB (Zero Energy Building) and ZNC (Zero Net Carbon) targets. These are likely to foster developments in the global building optimization and commissioning services market in the coming years. Many buildings globally are aging, having been in existence for several years, and therefore require retro-commissioning services to optimize their performance.

Moreover, the growing demand for energy efficiency is also likely to revolutionize the market. Municipalities and governments are implementing various performance-based energy codes, including ASHRAE, EPBD, and Title 24. Additionally, the rising energy costs are encouraging owners to invest in energy-efficient products that can optimize their energy consumption.

However, the smart city initiative by governments worldwide is likely to be a transformative force in the global market. Smart city projects involve the installation of automation systems driven by data analytics and many more, which require commissioning services. Numerous government-backed programs are strengthening the demand for integrated BAS platforms, intelligent HVAC systems, smart lighting, energy dashboards, and other related technologies. These smart technologies will improve work performance and ROI.

For instance, BrainBox AI introduced a Cloud Building Management System (CBMS) in 2025. It offers centralized remote optimization with an AI-based virtual engineer.

logo Restraints

  • What impact does high initial capital have on the growth of the global building optimization and commissioning services market?

Commissioning services require specialized software, skilled professionals, and advanced working infrastructure, which poses high implementation costs. This cost is a significant barrier for many building owners, small to medium-sized enterprises, and others with budget constraints.

Additionally, the lack of awareness among end-users is likely to impact the building optimization and commissioning services industry's growth negatively.

logo Opportunities

  • The growing corporate real estate sector is expected to foster growth opportunities in the global market.

Corporate organizations are decentralizing their working offices, which is expected to revolutionize the global building optimization and commissioning services market. The growing demand for remote support facilities and shared spaces is strengthening the requirement for cloud-based optimization dashboards, multi-site commissioning, retro-commissioning, and subscription-based monitoring. The COVID-19 pandemic had a profound impact on the market, as it heightened the demand for HVAC systems, air filters, and other related products.

Nowadays, people seek safe ventilation, air changes per hour, and other features, which are further driving demand for re-commissioning services in the market. For instance, Johnson Controls introduced HVAS, data centers, and software technology in 2025. The company is stepping up its security and fire offerings.

logo Challenges

  • Shortage of skilled professionals is a big challenge in the global market.

Commissioning services require professionals with multidisciplinary skills in various fields, including data analytics, electrical systems, HVAC, and other related areas.

Additionally, there is a lack of standardization due to the highly fragmented building optimization and commissioning services industry. Also, there is no global protocol or standards, which further results in inconsistent quality and limited compatibility.

logoReport Scope

Report Attribute

Details

Market Size in 2024

USD 6.41 Billion

Projected Market Size in 2034

USD 10.42 Billion

CAGR Growth Rate

6.27% CAGR

Base Year

2024

Forecast Years

2025-2034

Key Market Players

WSP, Syska Hennessy Group, Sain Engineering Associates Inc., Pinnacle Infotech, Johnson Controls Inc., Hunton Group Inc., Honeywell International Inc., CIM ENVIRONMENTAL PTY LTD, Affiliated Engineers Inc., and others.

Key Segment

By Building Type, By Building Optimization Technology, By Service, and Region

Major Regions Covered

North America, Europe, Asia Pacific, Latin America, and the Middle East &, Africa

Purchase Options

Request customized purchase options to meet your research needs. Explore purchase options

logoSegmentation Analysis

The global building optimization and commissioning services market can be segmented into building type, building optimization technology, and service type.

  • Based on building type, which segment will dominate the building optimization and commissioning services market?

The market can be segmented into commercial, industrial, and residential buildings. The commercial building segment is expected to be the fastest-growing in the building optimization and commissioning services industry during the predicted period. Strict building regulatory mandates are the primary reasons for the segment's high growth rate. Mandates like ASHRAE 90.1, LEED, BREEAM, Green Globes, and Energy Star are facilitating commercial developments. The high operating costs of commercial buildings are also a critical factor driving growth in the segment.

Therefore, owners invest in HVAC systems and install automation systems to improve overall performance. Also, the high influx of investment in smart commercial infrastructure is fueling the growth rate. There is an increase in the adoption of building automation systems across commercial buildings.

Moreover, facility owners are installing AI-powered fault detection and diagnostics solutions, which are also expected to influence the growth of the segment positively. The solutions have huge applications in airports, offices, and data centers due to the re-commissioning of aging infrastructure. The increasing number of data centers globally is raising the demand for cooling solutions. Hotels and the hospitality sector are using many automation solutions, like lighting and AC systems. The increasing demand for predictive maintenance models to reduce downtime in smart infrastructure is further expected to expand the market.

Based on building optimization technology, the market can be segmented into automated control systems, energy management systems, building automation systems, and others. The building automation system segment is expected to account for the largest share of the global building optimization and commissioning services market. Building automation systems refer to the central system that controls and accesses the entire automated system.

However, it helps in optimizing energy efficiency by facilitating real-time energy monitoring and automated load balancing. Technological advancements are widening the scope of building automated systems. Protocols like BACnet, Modbus, LonWorks, and KNX make BAS more scalable. A cloud-based system is a unique feature of BAS, which enables real-time optimization and remote diagnostics. BAS integrates well with AI models, which help improve the performance of buildings. However, it is an essential aspect of cybersecurity. It offers network encryption and intrusion detection systems, which can prevent unauthorized access in smart buildings.

Additionally, the increasing adoption of smart infrastructure, particularly in developing economies, is likely to strengthen the segment's growth. However, smart city projects by governments in countries such as Japan, Singapore, and India are also expected to create new growth opportunities in the market.

Based on service, the market can be segmented into retro-commissioning, commissioning, new construction, and others. The retro-commissioning segment is likely to dominate the building optimization and commissioning services industry during the forecast period. Retro-commissioning refers to the commissioning of existing buildings due to various reasons, such as performance degradation over time. Many buildings across the globe are years old and, therefore, function inefficiently. Such a landscape is fueling the demand for retro-commissioning without replacing the entire system.

Additionally, organizations are working to lower their energy usage and reduce greenhouse gas emissions. Retro-commissioning can offer energy savings without requiring significant investment. Additionally, there are government mandates for the re-commissioning of certain buildings. However, the government is offering subsidies and rebates for the commissioning works, which is further expected to foster growth opportunities in the market.

logo Regional Analysis

  • Will North America continue to dominate the global building optimization and commissioning services market?

North America is expected to account for the largest share of the global building optimization and commissioning services market during the forecast period. One of the major reasons for the high growth rate of the regional market is the energy efficiency mandates by the North American government. Many industrial facilities are fostering demand for energy optimization, which is likely to increase the need for building optimization services.

The United States is the fastest-growing country in North America, primarily due to federal and state-level energy codes, such as ASHRAE and the IECC. The government is incentivizing retro-commissioning services, thereby expanding the market for these services. Mexico's major infrastructure is prompting demand for retro-commissioning. Urban commercial developments in Monterrey and Guadalajara are also expected to drive market growth.

The Asia-Pacific region is another fastest-growing region in the world and is expected to experience significant developments in the years to come. The APAC region is witnessing numerous smart city projects initiated by governments in countries such as India, China, and Japan.

Additionally, the growing emphasis of regional governments on digitizing public assets is expected to develop the market further. China is the largest market in the APAC region due to the government's increasing focus on offering green building certifications. There is a rise in smart commercial real estate, which is expected to fuel the growth in the segment. India is also growing rapidly due to the increasing public-private partnerships in urban sustainability programs, which are expected to contribute significantly to the growth of the regional market.

Singapore is known for its innovations and is expected to foster numerous developments in the building optimization and commissioning services industry. Additionally, the government has initiated several programs aimed at mandating the commissioning of public infrastructure, which is expected to expand the market further.

logo Competitive Analysis

The key players in the global building optimization and commissioning services market include:

  • WSP
  • Syska Hennessy Group
  • Sain Engineering Associates Inc.
  • Pinnacle Infotech
  • Johnson Controls Inc.
  • Hunton Group Inc.
  • Honeywell International Inc.
  • CIM ENVIRONMENTAL PTY LTD
  • Affiliated Engineers Inc.

For instance, Trane Technologies successfully acquired BrainBox AI in 2024. The acquired company is a Montreal-based firm, a leader in AI-driven HVAC control systems.

The global building optimization and commissioning services market is segmented as follows:

logoBy Building Type Segment Analysis

  • Commercial
  • Industrial
  • Residential Buildings

logoBy Building Optimization Technology Segment Analysis

  • Automated Control Systems
  • Energy Management Systems
  • Building Automation Systems
  • Others

logoBy Service Segment Analysis

  • Retro-Commissioning
  • Re-Commissioning
  • New Construction Commissioning
  • Others

logoBy Regional Segment Analysis

  • North America
    • The U.S.
    • Canada
    • Mexico
  • Europe
    • France
    • The UK
    • Spain
    • Germany
    • Italy
    • Rest of Europe
  • Asia Pacific
    • China
    • Japan
    • India
    • Australia
    • Southeast Asia
    • Rest of Asia Pacific
  • The Middle East & Africa
    • Saudi Arabia
    • UAE
    • Egypt
    • Kuwait
    • South Africa
    • Rest of the Middle East & Africa
  • Latin America
    • Brazil
    • Argentina
    • Rest of Latin America

Table of Content

  1. Chapter 1. Preface
    1. 1.1 Report Description and Scope
  2. 1.2 Research scope
  3. 1.3 Research methodology
    1. 1.3.1 Market Research Type
    2. 1.3.2 Market research methodology
  4. Chapter 2. Executive Summary
    1. 2.1 Global Building Optimization And Commissioning Services Market, (2025 - 2034) (USD Billion)
  5. 2.2 Global Building Optimization And Commissioning Services Market : snapshot
  6. Chapter 3. Global Building Optimization And Commissioning Services Market - Industry Analysis
    1. 3.1 Building Optimization And Commissioning Services Market: Market Dynamics
  7. 3.2 Market Drivers
    1. 3.2.1 Growing demand for green building certification drive the growth of the global building optimization and commissioning services market
    2. 3.2.2 Driver 2
  8. 3.3 Market Restraints
    1. 3.3.1. High initial capital have on the growth of the global building optimization and commissioning services market
  • 3.4 Market Opportunities
    1. 3.4.1. The growing corporate real estate sector is expected to foster growth opportunities in the global market.
  • 3.5 Market Challenges
    1. 3.5.1. The growing corporate real estate sector is expected to foster growth opportunities in the global market.
  • 3.6 Porter’s Five Forces Analysis
  • 3.7 Market Attractiveness Analysis
    1. 3.7.1 Market attractiveness analysis By Building Type
    2. 3.7.2 Market attractiveness analysis By Building Optimization Technology
    3. 3.7.3 Market attractiveness analysis By Service
  • Chapter 4. Global Building Optimization And Commissioning Services Market- Competitive Landscape
    1. 4.1 Company market share analysis
    2. 4.1.1 Global Building Optimization And Commissioning Services Market: company market share, 2024
  • 4.2 Strategic development
    1. 4.2.1 Acquisitions & mergers
    2. 4.2.2 New Product launches
    3. 4.2.3 Agreements, partnerships, cullaborations, and joint ventures
    4. 4.2.4 Research and development and Regional expansion
  • 4.3 Price trend analysis
  • Chapter 5. Global Building Optimization And Commissioning Services Market - Building Type Analysis
    1. 5.1 Global Building Optimization And Commissioning Services Market overview: By Building Type
    2. 5.1.1 Global Building Optimization And Commissioning Services Market share, By Building Type, 2024 and 2034
  • 5.2 Commercial
    1. 5.2.1 Global Building Optimization And Commissioning Services Market by Commercial, 2025 - 2034 (USD Billion)
  • 5.3 Industrial
    1. 5.3.1 Global Building Optimization And Commissioning Services Market by Industrial, 2025 - 2034 (USD Billion)
  • 5.4 Residential Buildings
    1. 5.4.1 Global Building Optimization And Commissioning Services Market by Residential Buildings, 2025 - 2034 (USD Billion)
  • Chapter 6. Global Building Optimization And Commissioning Services Market - Building Optimization Technology Analysis
    1. 6.1 Global Building Optimization And Commissioning Services Market overview: By Building Optimization Technology
    2. 6.1.1 Global Building Optimization And Commissioning Services Market share, By Building Optimization Technology, 2024 and 2034
  • 6.2 Automated Control Systems
    1. 6.2.1 Global Building Optimization And Commissioning Services Market by Automated Control Systems, 2025 - 2034 (USD Billion)
  • 6.3 Energy Management Systems
    1. 6.3.1 Global Building Optimization And Commissioning Services Market by Energy Management Systems, 2025 - 2034 (USD Billion)
  • 6.4 Building Automation Systems
    1. 6.4.1 Global Building Optimization And Commissioning Services Market by Building Automation Systems, 2025 - 2034 (USD Billion)
  • 6.5 Others
    1. 6.5.1 Global Building Optimization And Commissioning Services Market by Others, 2025 - 2034 (USD Billion)
  • Chapter 7. Global Building Optimization And Commissioning Services Market - Service Analysis
    1. 7.1 Global Building Optimization And Commissioning Services Market overview: By Service
    2. 7.1.1 Global Building Optimization And Commissioning Services Market share, By Service, 2024 and 2034
  • 7.2 Retro-Commissioning
    1. 7.2.1 Global Building Optimization And Commissioning Services Market by Retro-Commissioning, 2025 - 2034 (USD Billion)
  • 7.3 Re-Commissioning
    1. 7.3.1 Global Building Optimization And Commissioning Services Market by Re-Commissioning, 2025 - 2034 (USD Billion)
  • 7.4 New Construction Commissioning
    1. 7.4.1 Global Building Optimization And Commissioning Services Market by New Construction Commissioning, 2025 - 2034 (USD Billion)
  • 7.5 Others
    1. 7.5.1 Global Building Optimization And Commissioning Services Market by Others, 2025 - 2034 (USD Billion)
  • Chapter 8. Building Optimization And Commissioning Services Market - Regional Analysis
    1. 8.1 Global Building Optimization And Commissioning Services Market Regional Overview
  • 8.2 Global Building Optimization And Commissioning Services Market Share, by Region, 2024 & 2034 (USD Billion)
    1. 8.3. North America
    2. 8.3.1 North America Building Optimization And Commissioning Services Market, 2025 - 2034 (USD Billion)
      1. 8.3.1.1 North America Building Optimization And Commissioning Services Market, by Country, 2025 - 2034 (USD Billion)
  • 8.4 North America Building Optimization And Commissioning Services Market, by Building Type, 2025 - 2034
    1. 8.4.1 North America Building Optimization And Commissioning Services Market, by Building Type, 2025 - 2034 (USD Billion)
  • 8.5 North America Building Optimization And Commissioning Services Market, by Building Optimization Technology, 2025 - 2034
    1. 8.5.1 North America Building Optimization And Commissioning Services Market, by Building Optimization Technology, 2025 - 2034 (USD Billion)
  • 8.6 North America Building Optimization And Commissioning Services Market, by Service, 2025 - 2034
    1. 8.6.1 North America Building Optimization And Commissioning Services Market, by Service, 2025 - 2034 (USD Billion)
    2. 8.7. Europe
    3. 8.7.1 Europe Building Optimization And Commissioning Services Market, 2025 - 2034 (USD Billion)
      1. 8.7.1.1 Europe Building Optimization And Commissioning Services Market, by Country, 2025 - 2034 (USD Billion)
  • 8.8 Europe Building Optimization And Commissioning Services Market, by Building Type, 2025 - 2034
    1. 8.8.1 Europe Building Optimization And Commissioning Services Market, by Building Type, 2025 - 2034 (USD Billion)
  • 8.9 Europe Building Optimization And Commissioning Services Market, by Building Optimization Technology, 2025 - 2034
    1. 8.9.1 Europe Building Optimization And Commissioning Services Market, by Building Optimization Technology, 2025 - 2034 (USD Billion)
  • 8.10 Europe Building Optimization And Commissioning Services Market, by Service, 2025 - 2034
    1. 8.10.1 Europe Building Optimization And Commissioning Services Market, by Service, 2025 - 2034 (USD Billion)
    2. 8.11. Asia Pacific
    3. 8.11.1 Asia Pacific Building Optimization And Commissioning Services Market, 2025 - 2034 (USD Billion)
      1. 8.11.1.1 Asia Pacific Building Optimization And Commissioning Services Market, by Country, 2025 - 2034 (USD Billion)
  • 8.12 Asia Pacific Building Optimization And Commissioning Services Market, by Building Type, 2025 - 2034
    1. 8.12.1 Asia Pacific Building Optimization And Commissioning Services Market, by Building Type, 2025 - 2034 (USD Billion)
  • 8.13 Asia Pacific Building Optimization And Commissioning Services Market, by Building Optimization Technology, 2025 - 2034
    1. 8.13.1 Asia Pacific Building Optimization And Commissioning Services Market, by Building Optimization Technology, 2025 - 2034 (USD Billion)
  • 8.14 Asia Pacific Building Optimization And Commissioning Services Market, by Service, 2025 - 2034
    1. 8.14.1 Asia Pacific Building Optimization And Commissioning Services Market, by Service, 2025 - 2034 (USD Billion)
    2. 8.15. Latin America
    3. 8.15.1 Latin America Building Optimization And Commissioning Services Market, 2025 - 2034 (USD Billion)
      1. 8.15.1.1 Latin America Building Optimization And Commissioning Services Market, by Country, 2025 - 2034 (USD Billion)
  • 8.16 Latin America Building Optimization And Commissioning Services Market, by Building Type, 2025 - 2034
    1. 8.16.1 Latin America Building Optimization And Commissioning Services Market, by Building Type, 2025 - 2034 (USD Billion)
  • 8.17 Latin America Building Optimization And Commissioning Services Market, by Building Optimization Technology, 2025 - 2034
    1. 8.17.1 Latin America Building Optimization And Commissioning Services Market, by Building Optimization Technology, 2025 - 2034 (USD Billion)
  • 8.18 Latin America Building Optimization And Commissioning Services Market, by Service, 2025 - 2034
    1. 8.18.1 Latin America Building Optimization And Commissioning Services Market, by Service, 2025 - 2034 (USD Billion)
    2. 8.19. The Middle-East and Africa
    3. 8.19.1 The Middle-East and Africa Building Optimization And Commissioning Services Market, 2025 - 2034 (USD Billion)
      1. 8.19.1.1 The Middle-East and Africa Building Optimization And Commissioning Services Market, by Country, 2025 - 2034 (USD Billion)
  • 8.20 The Middle-East and Africa Building Optimization And Commissioning Services Market, by Building Type, 2025 - 2034
    1. 8.20.1 The Middle-East and Africa Building Optimization And Commissioning Services Market, by Building Type, 2025 - 2034 (USD Billion)
  • 8.21 The Middle-East and Africa Building Optimization And Commissioning Services Market, by Building Optimization Technology, 2025 - 2034
    1. 8.21.1 The Middle-East and Africa Building Optimization And Commissioning Services Market, by Building Optimization Technology, 2025 - 2034 (USD Billion)
  • 8.22 The Middle-East and Africa Building Optimization And Commissioning Services Market, by Service, 2025 - 2034
    1. 8.22.1 The Middle-East and Africa Building Optimization And Commissioning Services Market, by Service, 2025 - 2034 (USD Billion)
  • Chapter 9. Company Profiles
    1. 9.1 WSP
    2. 9.1.1 Overview
    3. 9.1.2 Financials
    4. 9.1.3 Product Portfolio
    5. 9.1.4 Business Strategy
    6. 9.1.5 Recent Developments
  • 9.2 Syska Hennessy Group
    1. 9.2.1 Overview
    2. 9.2.2 Financials
    3. 9.2.3 Product Portfolio
    4. 9.2.4 Business Strategy
    5. 9.2.5 Recent Developments
  • 9.3 Sain Engineering Associates Inc.
    1. 9.3.1 Overview
    2. 9.3.2 Financials
    3. 9.3.3 Product Portfolio
    4. 9.3.4 Business Strategy
    5. 9.3.5 Recent Developments
  • 9.4 Pinnacle Infotech
    1. 9.4.1 Overview
    2. 9.4.2 Financials
    3. 9.4.3 Product Portfolio
    4. 9.4.4 Business Strategy
    5. 9.4.5 Recent Developments
  • 9.5 Johnson Controls Inc.
    1. 9.5.1 Overview
    2. 9.5.2 Financials
    3. 9.5.3 Product Portfolio
    4. 9.5.4 Business Strategy
    5. 9.5.5 Recent Developments
  • 9.6 Hunton Group Inc.
    1. 9.6.1 Overview
    2. 9.6.2 Financials
    3. 9.6.3 Product Portfolio
    4. 9.6.4 Business Strategy
    5. 9.6.5 Recent Developments
  • 9.7 Honeywell International Inc.
    1. 9.7.1 Overview
    2. 9.7.2 Financials
    3. 9.7.3 Product Portfolio
    4. 9.7.4 Business Strategy
    5. 9.7.5 Recent Developments
  • 9.8 CIM ENVIRONMENTAL PTY LTD
    1. 9.8.1 Overview
    2. 9.8.2 Financials
    3. 9.8.3 Product Portfolio
    4. 9.8.4 Business Strategy
    5. 9.8.5 Recent Developments
  • 9.9 Affiliated Engineers Inc.
    1. 9.9.1 Overview
    2. 9.9.2 Financials
    3. 9.9.3 Product Portfolio
    4. 9.9.4 Business Strategy
    5. 9.9.5 Recent Developments
  • 9.10 and others.
    1. 9.10.1 Overview
    2. 9.10.2 Financials
    3. 9.10.3 Product Portfolio
    4. 9.10.4 Business Strategy
    5. 9.10.5 Recent Developments

    List of Figures

    1. Market research Type 
    2. Market research methodology 
    3. Global Building Optimization And Commissioning Services Market, 2025 - 2034 (USD Billion) 
    4. Porter’s Five Forces Analysis 
    5. Global Building Optimization And Commissioning Services Market attractiveness, By Building Type 
    6. Global Building Optimization And Commissioning Services Market attractiveness, By Building Optimization Technology 
    7. Global Building Optimization And Commissioning Services Market attractiveness, By Service 
    8. Global Building Optimization And Commissioning Services Market share by Building Type, 2025 and 2034 (USD Billion) 
    9. Global Building Optimization And Commissioning Services Market by Commercial, 2025 - 2034 (USD Billion) 
    10. Global Building Optimization And Commissioning Services Market by Industrial, 2025 - 2034 (USD Billion) 
    11. Global Building Optimization And Commissioning Services Market by Residential Buildings, 2025 - 2034 (USD Billion) 
    12. Global Building Optimization And Commissioning Services Market share by Building Optimization Technology, 2025 and 2034 (USD Billion) 
    13. Global Building Optimization And Commissioning Services Market by Automated Control Systems, 2025 - 2034 (USD Billion) 
    14. Global Building Optimization And Commissioning Services Market by Energy Management Systems, 2025 - 2034 (USD Billion) 
    15. Global Building Optimization And Commissioning Services Market by Building Automation Systems, 2025 - 2034 (USD Billion) 
    16. Global Building Optimization And Commissioning Services Market by Others, 2025 - 2034 (USD Billion) 
    17. Global Building Optimization And Commissioning Services Market share by Service, 2025 and 2034 (USD Billion) 
    18. Global Building Optimization And Commissioning Services Market by Retro-Commissioning, 2025 - 2034 (USD Billion) 
    19. Global Building Optimization And Commissioning Services Market by Re-Commissioning, 2025 - 2034 (USD Billion) 
    20. Global Building Optimization And Commissioning Services Market by New Construction Commissioning, 2025 - 2034 (USD Billion) 
    21. Global Building Optimization And Commissioning Services Market by Others, 2025 - 2034 (USD Billion) 
    22. Global Building Optimization And Commissioning Services Market share, by Region, 2025 and 2034 
    23. North America Building Optimization And Commissioning Services Market, 2025 - 2034 (USD Billion) 
    24. Europe Building Optimization And Commissioning Services Market, 2025 - 2034 (USD Billion) 
    25. Asia Pacific Building Optimization And Commissioning Services Market, 2025 - 2034 (USD Billion) 
    26. Latin America Building Optimization And Commissioning Services Market, 2025 - 2034 (USD Billion) 
    27. The Middle-East and Africa Building Optimization And Commissioning Services Market, 2025 - 2034 (USD Billion) 
    

    List of Tables

    1. Global Building Optimization And Commissioning Services Market: Snapshot 
    2. Drivers of the Building Optimization And Commissioning Services Market: impact analysis 
    3. North America Building Optimization And Commissioning Services Market revenue, By Building Type, 2025 - 2034 (USD Billion) 
    4. North America Building Optimization And Commissioning Services Market revenue, By Building Optimization Technology, 2025 - 2034 (USD Billion) 
    5. North America Building Optimization And Commissioning Services Market revenue, By Service, 2025 - 2034 (USD Billion) 
    6. U.S. Building Optimization And Commissioning Services Market revenue, By Building Type, 2025 - 2034 (USD Billion) 
    7. U.S. Building Optimization And Commissioning Services Market revenue, By Building Optimization Technology, 2025 - 2034 (USD Billion) 
    8. U.S. Building Optimization And Commissioning Services Market revenue, By Service, 2025 - 2034 (USD Billion) 
    9. Canada Building Optimization And Commissioning Services Market revenue, By Building Type, 2025 - 2034 (USD Billion) 
    10. Canada Building Optimization And Commissioning Services Market revenue, By Building Optimization Technology, 2025 - 2034 (USD Billion) 
    11. Canada Building Optimization And Commissioning Services Market revenue, By Service, 2025 - 2034 (USD Billion) 
    12. Europe Building Optimization And Commissioning Services Market revenue, By Building Type, 2025 - 2034 (USD Billion) 
    13. Europe Building Optimization And Commissioning Services Market revenue, By Building Optimization Technology, 2025 - 2034 (USD Billion) 
    14. Europe Building Optimization And Commissioning Services Market revenue, By Service, 2025 - 2034 (USD Billion) 
    15. Germany Building Optimization And Commissioning Services Market revenue, By Building Type, 2025 - 2034 (USD Billion) 
    16. Germany Building Optimization And Commissioning Services Market revenue, By Building Optimization Technology, 2025 - 2034 (USD Billion) 
    17. Germany Building Optimization And Commissioning Services Market revenue, By Service, 2025 - 2034 (USD Billion) 
    18. France Building Optimization And Commissioning Services Market revenue, By Building Type, 2025 - 2034 (USD Billion) 
    19. France Building Optimization And Commissioning Services Market revenue, By Building Optimization Technology, 2025 - 2034 (USD Billion) 
    20. France Building Optimization And Commissioning Services Market revenue, By Service, 2025 - 2034 (USD Billion) 
    21. U.K. Building Optimization And Commissioning Services Market revenue, By Building Type, 2025 - 2034 (USD Billion) 
    22. U.K. Building Optimization And Commissioning Services Market revenue, By Building Optimization Technology, 2025 - 2034 (USD Billion) 
    23. U.K. Building Optimization And Commissioning Services Market revenue, By Service, 2025 - 2034 (USD Billion) 
    24. Italy Building Optimization And Commissioning Services Market revenue, By Building Type, 2025 - 2034 (USD Billion) 
    25. Italy Building Optimization And Commissioning Services Market revenue, By Building Optimization Technology, 2025 - 2034 (USD Billion) 
    26. Italy Building Optimization And Commissioning Services Market revenue, By Service, 2025 - 2034 (USD Billion) 
    27. Spain Building Optimization And Commissioning Services Market revenue, By Building Type, 2025 - 2034 (USD Billion) 
    28. Spain Building Optimization And Commissioning Services Market revenue, By Building Optimization Technology, 2025 - 2034 (USD Billion) 
    29. Spain Building Optimization And Commissioning Services Market revenue, By Service, 2025 - 2034 (USD Billion) 
    30. Rest of Europe Building Optimization And Commissioning Services Market revenue, By Building Type, 2025 - 2034 (USD Billion) 
    31. Rest of Europe Building Optimization And Commissioning Services Market revenue, By Building Optimization Technology, 2025 - 2034 (USD Billion) 
    32. Rest of Europe Building Optimization And Commissioning Services Market revenue, By Service, 2025 - 2034 (USD Billion) 
    33. Asia Pacific Building Optimization And Commissioning Services Market revenue, By Building Type, 2025 - 2034 (USD Billion) 
    34. Asia Pacific Building Optimization And Commissioning Services Market revenue, By Building Optimization Technology, 2025 - 2034 (USD Billion) 
    35. Asia Pacific Building Optimization And Commissioning Services Market revenue, By Service, 2025 - 2034 (USD Billion) 
    36. China Building Optimization And Commissioning Services Market revenue, By Building Type, 2025 - 2034 (USD Billion) 
    37. China Building Optimization And Commissioning Services Market revenue, By Building Optimization Technology, 2025 - 2034 (USD Billion) 
    38. China Building Optimization And Commissioning Services Market revenue, By Service, 2025 - 2034 (USD Billion) 
    39. Japan Building Optimization And Commissioning Services Market revenue, By Building Type, 2025 - 2034 (USD Billion) 
    40. Japan Building Optimization And Commissioning Services Market revenue, By Building Optimization Technology, 2025 - 2034 (USD Billion) 
    41. Japan Building Optimization And Commissioning Services Market revenue, By Service, 2025 - 2034 (USD Billion) 
    42. India Building Optimization And Commissioning Services Market revenue, By Building Type, 2025 - 2034 (USD Billion) 
    43. India Building Optimization And Commissioning Services Market revenue, By Building Optimization Technology, 2025 - 2034 (USD Billion) 
    44. India Building Optimization And Commissioning Services Market revenue, By Service, 2025 - 2034 (USD Billion) 
    45. South Korea Building Optimization And Commissioning Services Market revenue, By Building Type, 2025 - 2034 (USD Billion) 
    46. South Korea Building Optimization And Commissioning Services Market revenue, By Building Optimization Technology, 2025 - 2034 (USD Billion) 
    47. South Korea Building Optimization And Commissioning Services Market revenue, By Service, 2025 - 2034 (USD Billion) 
    48. South-East Asia Building Optimization And Commissioning Services Market revenue, By Building Type, 2025 - 2034 (USD Billion) 
    49. South-East Asia Building Optimization And Commissioning Services Market revenue, By Building Optimization Technology, 2025 - 2034 (USD Billion) 
    50. South-East Asia Building Optimization And Commissioning Services Market revenue, By Service, 2025 - 2034 (USD Billion) 
    51. Rest of Asia Pacific Building Optimization And Commissioning Services Market revenue, By Building Type, 2025 - 2034 (USD Billion) 
    52. Rest of Asia Pacific Building Optimization And Commissioning Services Market revenue, By Building Optimization Technology, 2025 - 2034 (USD Billion) 
    53. Rest of Asia Pacific Building Optimization And Commissioning Services Market revenue, By Service, 2025 - 2034 (USD Billion) 
    54. Latin America Building Optimization And Commissioning Services Market revenue, By Building Type, 2025 - 2034 (USD Billion) 
    55. Latin America Building Optimization And Commissioning Services Market revenue, By Building Optimization Technology, 2025 - 2034 (USD Billion) 
    56. Latin America Building Optimization And Commissioning Services Market revenue, By Service, 2025 - 2034 (USD Billion) 
    57. Brazil Building Optimization And Commissioning Services Market revenue, By Building Type, 2025 - 2034 (USD Billion) 
    58. Brazil Building Optimization And Commissioning Services Market revenue, By Building Optimization Technology, 2025 - 2034 (USD Billion) 
    59. Brazil Building Optimization And Commissioning Services Market revenue, By Service, 2025 - 2034 (USD Billion) 
    60. Mexico Building Optimization And Commissioning Services Market revenue, By Building Type, 2025 - 2034 (USD Billion) 
    61. Mexico Building Optimization And Commissioning Services Market revenue, By Building Optimization Technology, 2025 - 2034 (USD Billion) 
    62. Mexico Building Optimization And Commissioning Services Market revenue, By Service, 2025 - 2034 (USD Billion) 
    63. Rest of Latin America Building Optimization And Commissioning Services Market revenue, By Building Type, 2025 - 2034 (USD Billion) 
    64. Rest of Latin America Building Optimization And Commissioning Services Market revenue, By Building Optimization Technology, 2025 - 2034 (USD Billion) 
    65. Rest of Latin America Building Optimization And Commissioning Services Market revenue, By Service, 2025 - 2034 (USD Billion) 
    66. The Middle-East and Africa Building Optimization And Commissioning Services Market revenue, By Building Type, 2025 - 2034 (USD Billion) 
    67. The Middle-East and Africa Building Optimization And Commissioning Services Market revenue, By Building Optimization Technology, 2025 - 2034 (USD Billion) 
    68. The Middle-East and Africa Building Optimization And Commissioning Services Market revenue, By Service, 2025 - 2034 (USD Billion) 
    69. GCC Countries Building Optimization And Commissioning Services Market revenue, By Building Type, 2025 - 2034 (USD Billion) 
    70. GCC Countries Building Optimization And Commissioning Services Market revenue, By Building Optimization Technology, 2025 - 2034 (USD Billion) 
    71. GCC Countries Building Optimization And Commissioning Services Market revenue, By Service, 2025 - 2034 (USD Billion) 
    72. South Africa Building Optimization And Commissioning Services Market revenue, By Building Type, 2025 - 2034 (USD Billion) 
    73. South Africa Building Optimization And Commissioning Services Market revenue, By Building Optimization Technology, 2025 - 2034 (USD Billion) 
    74. South Africa Building Optimization And Commissioning Services Market revenue, By Service, 2025 - 2034 (USD Billion) 
    75. Rest of Middle-East Africa Building Optimization And Commissioning Services Market revenue, By Building Type, 2025 - 2034 (USD Billion) 
    76. Rest of Middle-East Africa Building Optimization And Commissioning Services Market revenue, By Building Optimization Technology, 2025 - 2034 (USD Billion) 
    77. Rest of Middle-East Africa Building Optimization And Commissioning Services Market revenue, By Service, 2025 - 2034 (USD Billion)  
    
  • Industry Major Market Players

    • WSP
    • Syska Hennessy Group
    • Sain Engineering Associates Inc.
    • Pinnacle Infotech
    • Johnson Controls Inc.
    • Hunton Group Inc.
    • Honeywell International Inc.
    • CIM ENVIRONMENTAL PTY LTD
    • Affiliated Engineers Inc.