Search Market Research Report

Discover Our Latest Reports
Discover Our Featured Reports
Discover Top Selling Reports

Building Information Modeling Market Size, Share Global Analysis Report, 2021 – 2026

report img

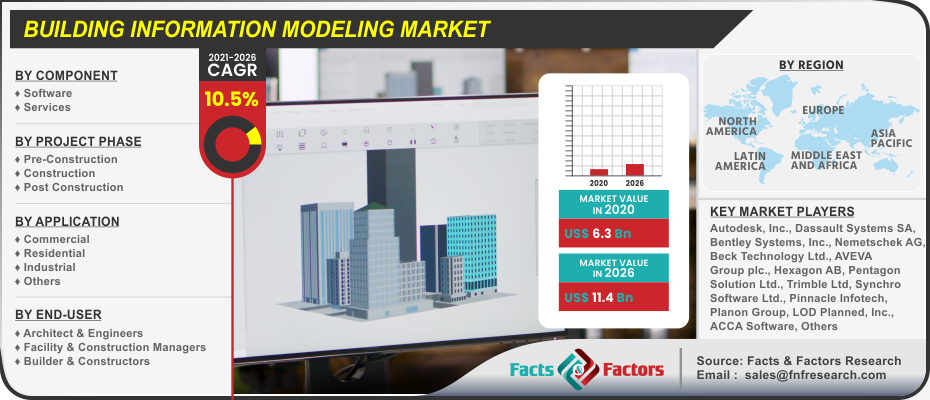
Building Information Modeling Market: By Component (Software & Services), By Project Phase (Pre-Construction, Construction, & Post Construction), By Application (Commercial, Residential, Industrial, & Others), By End-User (Architect & Engineers, Facility & Construction Managers, & Builder & Constructors), And By Regions ¬ Global & Regional Industry Perspective, Comprehensive Analysis, and Forecast 2021 – 2026

Industry Insights

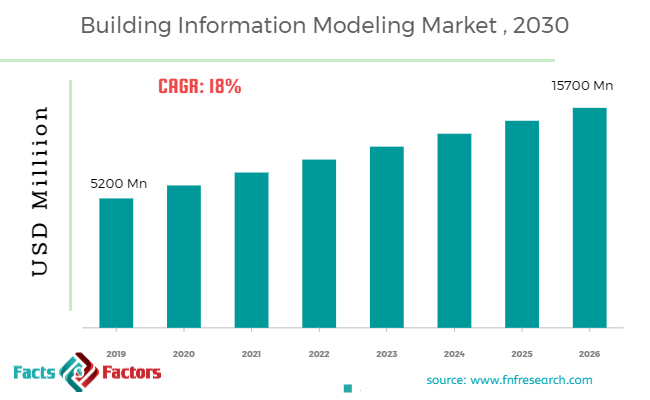
[110+ Pages Report] According to the report published by Facts Factors, the global building information modeling market size was worth around USD 5,200 million in 2019 and is predicted to grow to around USD 15,700 million by 2026 with a compound annual growth rate (CAGR) of roughly 18% between 2020 and 2026. The report analyzes the global building information modeling market drivers, restraints/challenges, and the effect they have on the demands during the projection period. In addition, the report explores emerging opportunities in the building information modeling market.

The latest finding surrounding the “Global Building Information Modeling Market” published by Facts & Factors offers a neatly packaged and comprehensive read. In the current study, the building information modeling market is anticipated to reach a projected value of USD 11.4 Billion by 2026 growing at a CAGR of 10.5% from an initial value of USD 6.3 Billion in the year 2020.

Building Information Modeling Market

To know more about this report | Request Free Sample Copy

Building information modeling or BIM is the holistic process of creating and managing information that goes towards building a structural asset. These software solutions are built towards creating an intelligent and smart outlook towards the former and are often accompanied by a cloud platform which represents the data in a multi-disciplinary representation of an asset from the planning and design state to the construction and operations stage.


logoKey Insights from Primary Research

  • As per our primary respondents, the Global Building Information Modeling Market is set to grow annually at a rate of around 20%
  • It was established through primary research that the Global Building Information Modeling Market  was valued at around USD 5,100 million in 2019
  • The “Software” category, on the basis of solution segmentation, was the leading revenue-generating category accounting for around 75% share, in 2019
  • On the basis of end-user segmentation, the “Architects” category held the leading share at more than 35%, in 2019
  • On the basis of vertical segmentation, the “Infrastructure” category held the leading share at more than 40%, in 2019
  • Based on the region, Europe is expected to dominate in the target market

logoKey Recommendations from Analysts

  • As per our analysts, Global Building Information Modeling Market is growing at high CAGR and various end-use industries are aware of this potential market and applications of cryo-electron microscopy.
  • Growing at a CAGR around 18 %, Global Building Information Modeling Market provides numerous opportunities for all of the involved stakeholders across the entire value chain.
  • Our analysts have identified software, architects, infrastructure are dominating segments for Global Building Information Modeling Market in terms of solution, end-user, and vertical segmentation respectively.

Building Information Modeling Market

To know more about this report | Request Free Sample Copy

The global building information modeling market is expected to occupy a larger market share than its previous iteration during the advent of the forecast owing to rising adoption of remote working solutions due to the ongoing pandemic coupled with rising urbanization measures to name a few. Additionally, increasing benefits of BIM by the AEC sector coupled with increasing government initiatives by various government bodies towards adopting the latter technology is expected to increase the footprint of the global building information modeling market during the advent of the forecast period. Moreover, a rising trend of increased adoption of IoT in the construction sector coupled with introduction of new standards such as ISO 19650 will increase the consumer base for the global building information modeling market during the advent of the forecast period.

The global building information modeling market is driven by the key market participants offering advanced building and designing solutions coupled with rising demands from the commercial sector to name a few. Additionally, factors pertaining to rising demand for energy effective solutions coupled with decreasing wastage measures will fuel the growth of the global building information modeling market during the advent of the forecast period. However, higher initial cost of BIM coupled with lack of a skilled workforce will hamper the growth of the global building information modeling market during the advent of the forecast period.

The global building information modeling market is divided into software & services on the basis of component. The segment pertaining to software is expected to witness the largest market share during the advent of the forecast period owing to rising demand of digital tools for the AEC sector coupled with rising flexibility combined with more operational use to name a few. Based on project phase, the global building information modeling market is classified into pre-construction, construction, and post construction. The segment pertaining to pre-construction phase is expected to witness the largest market share during the advent of the forecast period owing to increased benefits such as a clear operational scope, building cost and estimation, and added options in terms of designing and planning workflow to name a few. The global building information modeling market is fragmented into commercial, residential, industrial, and others on the basis of application.

The segment pertaining to commercial is expected to occupy the largest market share during the advent of the forecast period owing to rising cost of construction larger commercial buildings coupled with increased integration of software tools within the latter sector to name a few. On the basis of end-user, the global building information modeling market is categorized into architect & engineers, facility & construction managers, and builder & constructors. The architect & engineer segment is expected to witness the largest market share during the advent of the forecast period owing to the latter being of immense usage for designers and builders for exploring various insights coupled with rising opportunities for software based tools for large projects to name a few.

logoReport Scope

Report Attribute

Details

Market Size in 2019

USD 5,200 Million

Projected Market Size in 2026

USD 15,700 Million

CAGR Growth Rate

18% CAGR

Base Year

2019

Forecast Years

2020-2026

Key Market Players

Autodesk, Inc., Dassault Systems SA, Bentley Systems, Inc., Nemetschek AG, Beck Technology Ltd., AVEVA Group plc., Hexagon AB, Pentagon Solution Ltd., Trimble Ltd, Synchro Software Ltd., Pinnacle Infotech, Planon Group, LOD Planned, Inc., ACCA Software S.p.A., and Robert McNeel & Associates to name a few.

Key Segment

By Solution, End-user, Vertical, and Region

Major Regions Covered

North America, Europe, Asia Pacific, Latin America, and the Middle East & Africa

Purchase Options

Request customized purchase options to meet your research needs.Explore purchase options

North America is expected to witness the largest market share during the advent of the forecast period owing to an early adoption of advanced digital tools coupled with increasing number of government mandates for implementing BIM based tools to name a few. Additionally, increased spending on building structures coupled with rising compulsive nature for implementing BIM based tools will boost the growth of the building information modeling market in the region during the forecast period.

Asia-Pacific is expected to witness a substantial market share during the forecast period owing to a rapid urbanization overview coupled with rising number of planned infrastructure projects to name a few. Moreover, the region is home to India which is earmarked for the highest adoption of BIM based tools in the region which will further increase the market share for the building information modeling market in the region.

logoSome of the leading players in the global market include

  • Autodesk Inc.
  • Dassault Systems SA
  • Bentley Systems Inc.
  • Nemetschek AG
  • Beck Technology Ltd.
  • AVEVA Group plc.
  • Hexagon AB
  • Pentagon Solution Ltd.
  • Trimble Ltd
  • Synchro Software Ltd.
  • Pinnacle Infotech
  • Planon Group
  • LOD Planned Inc.
  • ACCA Software S.p.A.
  • Robert McNeel & Associates 

logoBy Component Segment Analysis

  • Software
  • Services

logoBy Project Phase Segment Analysis

  • Pre-Construction
  • Construction
  • Post Construction

logoBy Application Segment Analysis

  • Commercial
  • Residential
  • Industrial
  • Others

logoBy End-User Segment Analysis

  • Architect & Engineers
  • Facility & Construction Managers
  • Builder & Constructors

logoBy Regional Segment Analysis

  • North America
    • U.S.
    • Canada
  • Europe
    • UK
    • France
    • Germany
    • Italy
    • Spain
    • Rest of Europe
  • Asia Pacific
    • China
    • Japan
    • India
    • South Korea
    • Southeast Asia
    • Rest of Asia Pacific
  • Latin America
    • Brazil
    • Mexico
    • Rest of Latin America
  • Middle East and Africa
    • GCC Countries
    • South Africa
    • Rest of MEA

Table of Content

  1. Chapter 1 Executive Summary
    1. 1.1. Introduction of Building Information Modeling
    2. 1.2. Global Building Information Modeling Market, 2019 & 2026 (USD Billion)
    3. 1.3. Global Building Information Modeling Market, 2016 – 2026 (USD Billion)
    4. 1.4. Global Building Information Modeling Market Absolute Revenue Opportunity, 2016 – 2026 (USD Billion)
    5. 1.5. Global Building Information Modeling Market Incremental Revenue Opportunity, 2020 – 2026 (USD Billion)
  2. Chapter 2 Building Information Modeling Market – Component Analysis
    1. 2.1. Global Building Information Modeling Market – Component Overview
    2. 2.2. Global Building Information Modeling Market Share, by Component, 2019 & 2026 (USD Billion)
    3. 2.3. Software
      1. 2.3.1. Global Software Building Information Modeling Market, 2016 – 2026 (USD Billion)
    4. 2.4. Services
      1. 2.4.1. Global Services Building Information Modeling Market, 2016 – 2026 (USD Billion)
  3. Chapter 3 Building Information Modeling Market – Project Phase Analysis
    1. 3.1. Global Building Information Modeling Market – Project Phase Overview
    2. 3.2. Global Building Information Modeling Market Share, by Project Phase, 2019 & 2026 (USD Billion)
    3. 3.3. Pre-Construction
      1. 3.3.1. Global Pre-Construction Building Information Modeling Market, 2016 – 2026 (USD Billion)
    4. 3.4. Construction
      1. 3.4.1. Global Construction Building Information Modeling Market, 2016 – 2026 (USD Billion)
    5. 3.5. Post Construction
      1. 3.5.1. Global Post Construction Building Information Modeling Market, 2016 – 2026 (USD Billion)
  4. Chapter 4 Building Information Modeling Market – Application Analysis
    1. 4.1. Global Building Information Modeling Market – Application Overview
    2. 4.2. Global Building Information Modeling Market Share, by Application, 2019 & 2026 (USD Billion)
    3. 4.3. Commercial
      1. 4.3.1. Global Commercial Building Information Modeling Market, 2016 – 2026 (USD Billion)
    4. 4.4. Residential
      1. 4.4.1. Global Residential Building Information Modeling Market, 2016 – 2026 (USD Billion)
    5. 4.5. Industrial
      1. 4.5.1. Global Industrial Building Information Modeling Market, 2016 – 2026 (USD Billion)
    6. 4.6. Others
      1. 4.6.1. Global Others Building Information Modeling Market, 2016 – 2026 (USD Billion)
  5. Chapter 5 Building Information Modeling Market – End User Analysis
    1. 5.1. Global Building Information Modeling Market – End User Overview
    2. 5.2. Global Building Information Modeling Market Share, by End User, 2019 & 2026 (USD Billion)
    3. 5.3. Architect & Engineers
      1. 5.3.1. Global Architect & Engineers Building Information Modeling Market, 2016 – 2026 (USD Billion)
    4. 5.4. Facility Or Construction Managers
      1. 5.4.1. Global Facility Or Construction Managers Building Information Modeling Market, 2016 – 2026 (USD Billion)
    5. 5.5. Builder & Constructors
      1. 5.5.1. Global Builder & Constructors Building Information Modeling Market, 2016 – 2026 (USD Billion)
  6. Chapter 6 Building Information Modeling Market – Regional Analysis
    1. 6.1. Global Building Information Modeling Market Regional Overview
    2. 6.2. Global Building Information Modeling Market Share, by Region, 2019 & 2026 (USD Billion)
    3. 6.3. North America
      1. 6.3.1. North America Building Information Modeling Market, 2016 – 2026 (USD Billion)
        1. 6.3.1.1. North America Building Information Modeling Market, by Country, 2016 - 2026 (USD Billion)
      2. 6.3.2. North America Building Information Modeling Market, by Component, 2016 – 2026
        1. 6.3.2.1. North America Building Information Modeling Market, by Component, 2016 – 2026 (USD Billion)
      3. 6.3.3. North America Building Information Modeling Market, by Project Phase, 2016 – 2026
        1. 6.3.3.1. North America Building Information Modeling Market, by Project Phase, 2016 – 2026 (USD Billion)
      4. 6.3.4. North America Building Information Modeling Market, by Application, 2016 – 2026
        1. 6.3.4.1. North America Building Information Modeling Market, by Application, 2016 – 2026 (USD Billion)
      5. 6.3.5. North America Building Information Modeling Market, by End User, 2016 – 2026
        1. 6.3.5.1. North America Building Information Modeling Market, by End User, 2016 – 2026 (USD Billion)
      6. 6.3.6. U.S.
        1. 6.3.6.1. U.S. Building Information Modeling Market, 2016 – 2026 (USD Billion)
      7. 6.3.7. Canada
        1. 6.3.7.1. Canada Building Information Modeling Market, 2016 – 2026 (USD Billion)
    4. 6.4. Europe
      1. 6.4.1. Europe Building Information Modeling Market, 2016 – 2026 (USD Billion)
        1. 6.4.1.1. Europe Building Information Modeling Market, by Country, 2016 - 2026 (USD Billion)
      2. 6.4.2. Europe Building Information Modeling Market, by Component, 2016 – 2026
        1. 6.4.2.1. Europe Building Information Modeling Market, by Component, 2016 – 2026 (USD Billion)
      3. 6.4.3. Europe Building Information Modeling Market, by Project Phase, 2016 – 2026
        1. 6.4.3.1. Europe Building Information Modeling Market, by Project Phase, 2016 – 2026 (USD Billion)
      4. 6.4.4. Europe Building Information Modeling Market, by Application, 2016 – 2026
        1. 6.4.4.1. Europe Building Information Modeling Market, by Application, 2016 – 2026 (USD Billion)
      5. 6.4.5. Europe Building Information Modeling Market, by End User, 2016 – 2026
        1. 6.4.5.1. Europe Building Information Modeling Market, by End User, 2016 – 2026 (USD Billion)
      6. 6.4.6. Germany
        1. 6.4.6.1. Germany Building Information Modeling Market, 2016 – 2026 (USD Billion)
      7. 6.4.7. France
        1. 6.4.7.1. France Building Information Modeling Market, 2016 – 2026 (USD Billion)
      8. 6.4.8. U.K.
        1. 6.4.8.1. U.K. Building Information Modeling Market, 2016 – 2026 (USD Billion)
      9. 6.4.9. Italy
        1. 6.4.9.1. Italy Building Information Modeling Market, 2016 – 2026 (USD Billion)
      10. 6.4.10. Spain
        1. 6.4.10.1. Spain Building Information Modeling Market, 2016 – 2026 (USD Billion)
      11. 6.4.11. Rest of Europe
        1. 6.4.11.1. Rest of Europe Building Information Modeling Market, 2016 – 2026 (USD Billion)
    5. 6.5. Asia Pacific
      1. 6.5.1. Asia Pacific Building Information Modeling Market, 2016 – 2026 (USD Billion)
        1. 6.5.1.1. Asia Pacific Building Information Modeling Market, by Country, 2016 - 2026 (USD Billion)
      2. 6.5.2. Asia Pacific Building Information Modeling Market, by Component, 2016 – 2026
        1. 6.5.2.1. Asia Pacific Building Information Modeling Market, by Component, 2016 – 2026 (USD Billion)
      3. 6.5.3. Asia Pacific Building Information Modeling Market, by Project Phase, 2016 – 2026
        1. 6.5.3.1. Asia Pacific Building Information Modeling Market, by Project Phase, 2016 – 2026 (USD Billion)
      4. 6.5.4. Asia Pacific Building Information Modeling Market, by Application, 2016 – 2026
        1. 6.5.4.1. Asia Pacific Building Information Modeling Market, by Application, 2016 – 2026 (USD Billion)
      5. 6.5.5. Asia Pacific Building Information Modeling Market, by End User, 2016 – 2026
        1. 6.5.5.1. Asia Pacific Building Information Modeling Market, by End User, 2016 – 2026 (USD Billion)
      6. 6.5.6. China
        1. 6.5.6.1. China Building Information Modeling Market, 2016 – 2026 (USD Billion)
      7. 6.5.7. Japan
        1. 6.5.7.1. Japan Building Information Modeling Market, 2016 – 2026 (USD Billion)
      8. 6.5.8. India
        1. 6.5.8.1. India Building Information Modeling Market, 2016 – 2026 (USD Billion)
      9. 6.5.9. South Korea
        1. 6.5.9.1. South Korea Building Information Modeling Market, 2016 – 2026 (USD Billion)
      10. 6.5.10. South-East Asia
        1. 6.5.10.1. South-East Asia Building Information Modeling Market, 2016 – 2026 (USD Billion)
      11. 6.5.11. Rest of Asia Pacific
        1. 6.5.11.1. Rest of Asia Pacific Building Information Modeling Market, 2016 – 2026 (USD Billion)
    6. 6.6. Latin America
      1. 6.6.1. Latin America Building Information Modeling Market, 2016 – 2026 (USD Billion)
        1. 6.6.1.1. Latin America Building Information Modeling Market, by Country, 2016 - 2026 (USD Billion)
      2. 6.6.2. Latin America Building Information Modeling Market, by Component, 2016 – 2026
        1. 6.6.2.1. Latin America Building Information Modeling Market, by Component, 2016 – 2026 (USD Billion)
      3. 6.6.3. Latin America Building Information Modeling Market, by Project Phase, 2016 – 2026
        1. 6.6.3.1. Latin America Building Information Modeling Market, by Project Phase, 2016 – 2026 (USD Billion)
      4. 6.6.4. Latin America Building Information Modeling Market, by Application, 2016 – 2026
        1. 6.6.4.1. Latin America Building Information Modeling Market, by Application, 2016 – 2026 (USD Billion)
      5. 6.6.5. Latin America Building Information Modeling Market, by End User, 2016 – 2026
        1. 6.6.5.1. Latin America Building Information Modeling Market, by End User, 2016 – 2026 (USD Billion)
      6. 6.6.6. Brazil
        1. 6.6.6.1. Brazil Building Information Modeling Market, 2016 – 2026 (USD Billion)
      7. 6.6.7. Mexico
        1. 6.6.7.1. Mexico Building Information Modeling Market, 2016 – 2026 (USD Billion)
      8. 6.6.8. Rest of Latin America
        1. 6.6.8.1. Rest of Latin America Building Information Modeling Market, 2016 – 2026 (USD Billion)
    7. 6.7. The Middle-East and Africa
      1. 6.7.1. The Middle-East and Africa Building Information Modeling Market, 2016 – 2026 (USD Billion)
        1. 6.7.1.1. The Middle-East and Africa Building Information Modeling Market, by Country, 2016 - 2026 (USD Billion)
      2. 6.7.2. The Middle-East and Africa Building Information Modeling Market, by Component, 2016 – 2026
        1. 6.7.2.1. The Middle-East and Africa Building Information Modeling Market, by Component, 2016 – 2026 (USD Billion)
      3. 6.7.3. The Middle-East and Africa Building Information Modeling Market, by Project Phase, 2016 – 2026
        1. 6.7.3.1. The Middle-East and Africa Building Information Modeling Market, by Project Phase, 2016 – 2026 (USD Billion)
      4. 6.7.4. The Middle-East and Africa Building Information Modeling Market, by Application, 2016 – 2026
        1. 6.7.4.1. The Middle-East and Africa Building Information Modeling Market, by Application, 2016 – 2026 (USD Billion)
      5. 6.7.5. The Middle-East and Africa Building Information Modeling Market, by End User, 2016 – 2026
        1. 6.7.5.1. The Middle-East and Africa Building Information Modeling Market, by End User, 2016 – 2026 (USD Billion)
      6. 6.7.6. GCC Countries
        1. 6.7.6.1. GCC Countries Building Information Modeling Market, 2016 – 2026 (USD Billion)
      7. 6.7.7. South Africa
        1. 6.7.7.1. South Africa Building Information Modeling Market, 2016 – 2026 (USD Billion)
      8. 6.7.8. Rest of Middle-East Africa
        1. 6.7.8.1. Rest of Middle-East Africa Building Information Modeling Market, 2016 – 2026 (USD Billion)
  7. Chapter 7 Building Information Modeling Market – Competitive Landscape
    1. 7.1. Competitor Market Share – Revenue
    2. 7.2. Market Concentration Rate Analysis, Top 3 and Top 5 Players
    3. 7.3. Strategic Developments
      1. 7.3.1. Acquisitions and Mergers
      2. 7.3.2. New Products
      3. 7.3.3. Research & Development Activities
  8. Chapter 8 Company Profiles
    1. 8.1. Autodesk Inc
      1. 8.1.1. Company Overview
      2. 8.1.2. Product/Service Portfolio
      3. 8.1.3. Autodesk Inc Sales, Revenue, and Gross Margin
      4. 8.1.4. Autodesk Inc Revenue and Growth Rate
      5. 8.1.5. Autodesk Inc Market Share
      6. 8.1.6. Recent Initiatives, Funding/VC Activities, and Technological Innovations
    2. 8.2. Dassault Systems SA
      1. 8.2.1. Company Overview
      2. 8.2.2. Product/Service Portfolio
      3. 8.2.3. Dassault Systems SA Sales, Revenue, and Gross Margin
      4. 8.2.4. Dassault Systems SA Revenue and Growth Rate
      5. 8.2.5. Dassault Systems SA Market Share
      6. 8.2.6. Recent Initiatives, Funding/VC Activities, and Technological Innovations
    3. 8.3. Bentley Systems Inc
      1. 8.3.1. Company Overview
      2. 8.3.2. Product/Service Portfolio
      3. 8.3.3. Bentley Systems Inc Sales, Revenue, and Gross Margin
      4. 8.3.4. Bentley Systems Inc Revenue and Growth Rate
      5. 8.3.5. Bentley Systems Inc Market Share
      6. 8.3.6. Recent Initiatives, Funding/VC Activities, and Technological Innovations
    4. 8.4. Nemetschek AG
      1. 8.4.1. Company Overview
      2. 8.4.2. Product/Service Portfolio
      3. 8.4.3. Nemetschek AG Sales, Revenue, and Gross Margin
      4. 8.4.4. Nemetschek AG Revenue and Growth Rate
      5. 8.4.5. Nemetschek AG Market Share
      6. 8.4.6. Recent Initiatives, Funding/VC Activities, and Technological Innovations
    5. 8.5. Beck Technology Ltd
      1. 8.5.1. Company Overview
      2. 8.5.2. Product/Service Portfolio
      3. 8.5.3. Beck Technology Ltd Sales, Revenue, and Gross Margin
      4. 8.5.4. Beck Technology Ltd Revenue and Growth Rate
      5. 8.5.5. Beck Technology Ltd Market Share
      6. 8.5.6. Recent Initiatives, Funding/VC Activities, and Technological Innovations
    6. 8.6. AVEVA Group plc
      1. 8.6.1. Company Overview
      2. 8.6.2. Product/Service Portfolio
      3. 8.6.3. AVEVA Group plc Sales, Revenue, and Gross Margin
      4. 8.6.4. AVEVA Group plc Revenue and Growth Rate
      5. 8.6.5. AVEVA Group plc Market Share
      6. 8.6.6. Recent Initiatives, Funding/VC Activities, and Technological Innovations
    7. 8.7. Hexagon AB
      1. 8.7.1. Company Overview
      2. 8.7.2. Product/Service Portfolio
      3. 8.7.3. Hexagon AB Sales, Revenue, and Gross Margin
      4. 8.7.4. Hexagon AB Revenue and Growth Rate
      5. 8.7.5. Hexagon AB Market Share
      6. 8.7.6. Recent Initiatives, Funding/VC Activities, and Technological Innovations
    8. 8.8. Pentagon Solution Ltd
      1. 8.8.1. Company Overview
      2. 8.8.2. Product/Service Portfolio
      3. 8.8.3. Pentagon Solution Ltd Sales, Revenue, and Gross Margin
      4. 8.8.4. Pentagon Solution Ltd Revenue and Growth Rate
      5. 8.8.5. Pentagon Solution Ltd Market Share
      6. 8.8.6. Recent Initiatives, Funding/VC Activities, and Technological Innovations
    9. 8.9. Trimble Ltd
      1. 8.9.1. Company Overview
      2. 8.9.2. Product/Service Portfolio
      3. 8.9.3. Trimble Ltd Sales, Revenue, and Gross Margin
      4. 8.9.4. Trimble Ltd Revenue and Growth Rate
      5. 8.9.5. Trimble Ltd Market Share
      6. 8.9.6. Recent Initiatives, Funding/VC Activities, and Technological Innovations
    10. 8.10. Synchro Software Ltd
      1. 8.10.1. Company Overview
      2. 8.10.2. Product/Service Portfolio
      3. 8.10.3. Synchro Software Ltd Sales, Revenue, and Gross Margin
      4. 8.10.4. Synchro Software Ltd Revenue and Growth Rate
      5. 8.10.5. Synchro Software Ltd Market Share
      6. 8.10.6. Recent Initiatives, Funding/VC Activities, and Technological Innovations
    11. 8.11. Pinnacle Infotech
      1. 8.11.1. Company Overview
      2. 8.11.2. Product/Service Portfolio
      3. 8.11.3. Pinnacle Infotech Sales, Revenue, and Gross Margin
      4. 8.11.4. Pinnacle Infotech Revenue and Growth Rate
      5. 8.11.5. Pinnacle Infotech Market Share
      6. 8.11.6. Recent Initiatives, Funding/VC Activities, and Technological Innovations
    12. 8.12. Planon Group
      1. 8.12.1. Company Overview
      2. 8.12.2. Product/Service Portfolio
      3. 8.12.3. Planon Group Sales, Revenue, and Gross Margin
      4. 8.12.4. Planon Group Revenue and Growth Rate
      5. 8.12.5. Planon Group Market Share
      6. 8.12.6. Recent Initiatives, Funding/VC Activities, and Technological Innovations
    13. 8.13. LOD Planned Inc
      1. 8.13.1. Company Overview
      2. 8.13.2. Product/Service Portfolio
      3. 8.13.3. LOD Planned Inc Sales, Revenue, and Gross Margin
      4. 8.13.4. LOD Planned Inc Revenue and Growth Rate
      5. 8.13.5. LOD Planned Inc Market Share
      6. 8.13.6. Recent Initiatives, Funding/VC Activities, and Technological Innovations
    14. 8.14. ACCA Software S.p.A
      1. 8.14.1. Company Overview
      2. 8.14.2. Product/Service Portfolio
      3. 8.14.3. ACCA Software S.p.A Sales, Revenue, and Gross Margin
      4. 8.14.4. ACCA Software S.p.A Revenue and Growth Rate
      5. 8.14.5. ACCA Software S.p.A Market Share
      6. 8.14.6. Recent Initiatives, Funding/VC Activities, and Technological Innovations
    15. 8.15. Robert McNeel & Associates
      1. 8.15.1. Company Overview
      2. 8.15.2. Product/Service Portfolio
      3. 8.15.3. Robert McNeel & Associates Sales, Revenue, and Gross Margin
      4. 8.15.4. Robert McNeel & Associates Revenue and Growth Rate
      5. 8.15.5. Robert McNeel & Associates Market Share
      6. 8.15.6. Recent Initiatives, Funding/VC Activities, and Technological Innovations
  9. Chapter 9 Building Information Modeling — Industry Analysis
    1. 9.1. Introduction and Taxonomy
    2. 9.2. Building Information Modeling Market – Key Trends
      1. 9.2.1. Market Drivers
      2. 9.2.2. Market Restraints
      3. 9.2.3. Market Opportunities
    3. 9.3. Value Chain Analysis
    4. 9.4. Key Mandates and Regulations
    5. 9.5. Technology Roadmap and Timeline
    6. 9.6. Building Information Modeling Market – Attractiveness Analysis
      1. 9.6.1. By Component
      2. 9.6.2. By Project Phase
      3. 9.6.3. By Application
      4. 9.6.4. By End User
      5. 9.6.5. By Region
  10. Chapter 10 Industrial Chain, Sourcing Strategy, and Downstream Buyers
    1. 10.1. Building Information Modeling Industrial Chain Analysis
    2. 10.2. Downstream Buyers
    3. 10.3. Distributors/Traders List
  11. Chapter 11 Marketing Strategy Analysis
    1. 11.1. Marketing Channel
    2. 11.2. Direct Marketing
    3. 11.3. Indirect Marketing
    4. 11.4. Marketing Channel Development Trends
    5. 11.5. Economic/Political Environmental Change
  12. Chapter 12 Report Conclusion & Key Insights
    1. 12.1. Key Insights from Primary Interviews & Surveys Respondents
    2. 12.2. Key Takeaways from Analysts, Consultants, and Industry Leaders
  13. Chapter 13 Research Approach & Methodology
    1. 13.1. Report Description
    2. 13.2. Research Scope
    3. 13.3. Research Methodology
      1. 13.3.1. Secondary Research
      2. 13.3.2. Primary Research
      3. 13.3.3. Statistical Models
        1. 13.3.3.1. Company Share Analysis Model
        2. 13.3.3.2. Revenue Based Modeling
      4. 13.3.4. Research Limitations

      List of Figures

      Fig.1	Product Picture of Building Information Modeling
      Fig.2	Global Building Information Modeling Market, 2016 – 2026 (USD Billion)
      Fig.3	Global Building Information Modeling Market Absolute Revenue Opportunity, 2016 – 2026 (USD Billion)
      Fig.4	Global Building Information Modeling Market Incremental Revenue Opportunity, 2020 – 2026 (USD Billion)
      Fig.5	Global Building Information Modeling Market Share, by Component, 2019 & 2026 (USD Billion)
      Fig.6	Global Software  Building Information Modeling Market, 2016 – 2026 (USD Billion)
      Fig.7	Global Services Building Information Modeling Market, 2016 – 2026 (USD Billion)
      Fig.8	Global Building Information Modeling Market Share, by Project Phase, 2019 & 2026 (USD Billion)
      Fig.9	Global Pre-Construction Building Information Modeling Market, 2016 – 2026 (USD Billion)
      Fig.10	Global Construction  Building Information Modeling Market, 2016 – 2026 (USD Billion)
      Fig.11	Global Post Construction Building Information Modeling Market, 2016 – 2026 (USD Billion)
      Fig.12	Global Building Information Modeling Market Share, by Application, 2019 & 2026 (USD Billion)
      Fig.13	Global Commercial Building Information Modeling Market, 2016 – 2026 (USD Billion)
      Fig.14	Global Residential  Building Information Modeling Market, 2016 – 2026 (USD Billion)
      Fig.15	Global Industrial  Building Information Modeling Market, 2016 – 2026 (USD Billion)
      Fig.16	Global Others Building Information Modeling Market, 2016 – 2026 (USD Billion)
      Fig.17	Global Building Information Modeling Market Share, by End User, 2019 & 2026 (USD Billion)
      Fig.18	Global Architect & Engineers  Building Information Modeling Market, 2016 – 2026 (USD Billion)
      Fig.19	Global Facility Or Construction Managers  Building Information Modeling Market, 2016 – 2026 (USD Billion)
      Fig.20	Global Builder & Constructors Building Information Modeling Market, 2016 – 2026 (USD Billion)
      Fig.21	Global Building Information Modeling Market Share, by Region, 2019 & 2026 (USD Billion)
      Fig.22	North America Building Information Modeling Market, 2016 – 2026 (USD Billion)
      Fig.23	U.S. Building Information Modeling Market, 2016 – 2026 (USD Billion)
      Fig.24	Canada Building Information Modeling Market, 2016 – 2026 (USD Billion)
      Fig.25	Europe Building Information Modeling Market, 2016 – 2026 (USD Billion)
      Fig.26	Germany Building Information Modeling Market, 2016 – 2026 (USD Billion)
      Fig.27	France Building Information Modeling Market, 2016 – 2026 (USD Billion)
      Fig.28	U.K. Building Information Modeling Market, 2016 – 2026 (USD Billion)
      Fig.29	Italy Building Information Modeling Market, 2016 – 2026 (USD Billion)
      Fig.30	Spain Building Information Modeling Market, 2016 – 2026 (USD Billion)
      Fig.31	Rest of Europe Building Information Modeling Market, 2016 – 2026 (USD Billion)
      Fig.32	Asia Pacific Building Information Modeling Market, 2016 – 2026 (USD Billion)
      Fig.33	China Building Information Modeling Market, 2016 – 2026 (USD Billion)
      Fig.34	Japan Building Information Modeling Market, 2016 – 2026 (USD Billion)
      Fig.35	India Building Information Modeling Market, 2016 – 2026 (USD Billion)
      Fig.36	South  Korea Building Information Modeling Market, 2016 – 2026 (USD Billion)
      Fig.37	South-East Asia Building Information Modeling Market, 2016 – 2026 (USD Billion)
      Fig.38	Rest of Asia Pacific Building Information Modeling Market, 2016 – 2026 (USD Billion)
      Fig.39	Latin America Building Information Modeling Market, 2016 – 2026 (USD Billion)
      Fig.40	Brazil Building Information Modeling Market, 2016 – 2026 (USD Billion)
      Fig.41	Mexico Building Information Modeling Market, 2016 – 2026 (USD Billion)
      Fig.42	Rest of Latin America Building Information Modeling Market, 2016 – 2026 (USD Billion)
      Fig.43	The Middle-East and Africa Building Information Modeling Market, 2016 – 2026 (USD Billion)
      Fig.44	GCC Countries Building Information Modeling Market, 2016 – 2026 (USD Billion)
      Fig.45	South Africa Building Information Modeling Market, 2016 – 2026 (USD Billion)
      Fig.46	Rest of Middle-East Africa Building Information Modeling Market, 2016 – 2026 (USD Billion)
      Fig.47	Competitor Market Share – Revenue
      Fig.48	Autodesk Inc Revenue and Growth Rate
      Fig.49	Autodesk Inc Market Share
      Fig.50	Dassault Systems SA Revenue and Growth Rate
      Fig.51	Dassault Systems SA Market Share
      Fig.52	Bentley Systems Inc Revenue and Growth Rate
      Fig.53	Bentley Systems Inc Market Share
      Fig.54	Nemetschek AG Revenue and Growth Rate
      Fig.55	Nemetschek AG Market Share
      Fig.56	Beck Technology Ltd Revenue and Growth Rate
      Fig.57	Beck Technology Ltd Market Share
      Fig.58	AVEVA Group plc Revenue and Growth Rate
      Fig.59	AVEVA Group plc Market Share
      Fig.60	Hexagon AB Revenue and Growth Rate
      Fig.61	Hexagon AB Market Share
      Fig.62	Pentagon Solution Ltd Revenue and Growth Rate
      Fig.63	Pentagon Solution Ltd Market Share
      Fig.64	Trimble Ltd Revenue and Growth Rate
      Fig.65	Trimble Ltd Market Share
      Fig.66	Synchro Software Ltd Revenue and Growth Rate
      Fig.67	Synchro Software Ltd Market Share
      Fig.68	Pinnacle Infotech Revenue and Growth Rate
      Fig.69	Pinnacle Infotech Market Share
      Fig.70	Planon Group Revenue and Growth Rate
      Fig.71	Planon Group Market Share
      Fig.72	LOD Planned Inc Revenue and Growth Rate
      Fig.73	LOD Planned Inc Market Share
      Fig.74	ACCA Software S.p.A Revenue and Growth Rate
      Fig.75	ACCA Software S.p.A Market Share
      Fig.76	Robert McNeel & Associates Revenue and Growth Rate
      Fig.77	Robert McNeel & Associates Market Share
      Fig.78	Market Dynamics
      Fig.79	Global Building Information Modeling – Value Chain Analysis
      Fig.80	Key Mandates and Regulations
      Fig.81	Technology Roadmap and Timeline
      Fig.82	Market Attractiveness Analysis – By Component
      Fig.83	Market Attractiveness Analysis – By Project Phase
      Fig.84	Market Attractiveness Analysis – By Application
      Fig.85	Market Attractiveness Analysis – By End User
      Fig.86	Market Attractiveness Analysis – By Region
      Fig.87	Building Information Modeling Industrial Chain Analysis
      Fig.88	Market Channels
      Fig.89	Marketing Channel Development Trend
      Fig.90	Growth in World Gross Product, 2008-2018
      

      List of Tables

      Table 1	Global Building Information Modeling Market, 2019 & 2026 (USD Billion)
      Table 2	Global Building Information Modeling Market, by Component, 2016 – 2026 (USD Billion)
      Table 3	Global Building Information Modeling Market, by Project Phase, 2016 – 2026 (USD Billion)
      Table 4	Global Building Information Modeling Market, by Application, 2016 – 2026 (USD Billion)
      Table 5	Global Building Information Modeling Market, by End User, 2016 – 2026 (USD Billion)
      Table 6	Global Building Information Modeling Market, by Region, 2016 – 2026 (USD Billion)
      Table 7	North America Building Information Modeling Market, by Country, 2016 – 2026 (USD Billion)
      Table 8	North America Building Information Modeling Market, by Component, 2016 – 2026 (USD Billion)
      Table 9	North America Building Information Modeling Market, by Project Phase, 2016 – 2026 (USD Billion)
      Table 10 North America Building Information Modeling Market, by Application, 2016 – 2026 (USD Billion)
      Table 11 North America Building Information Modeling Market, by End User, 2016 – 2026 (USD Billion)
      Table 12 Europe Building Information Modeling Market, by Country, 2016 – 2026 (USD Billion)
      Table 13 Europe Building Information Modeling Market, by Component, 2016 – 2026 (USD Billion)
      Table 14 Europe Building Information Modeling Market, by Project Phase, 2016 – 2026 (USD Billion)
      Table 15 Europe Building Information Modeling Market, by Application, 2016 – 2026 (USD Billion)
      Table 16 Europe Building Information Modeling Market, by End User, 2016 – 2026 (USD Billion)
      Table 17 Asia Pacific Building Information Modeling Market, by Country, 2016 – 2026 (USD Billion)
      Table 18 Asia Pacific Building Information Modeling Market, by Component, 2016 – 2026 (USD Billion)
      Table 19 Asia Pacific Building Information Modeling Market, by Project Phase, 2016 – 2026 (USD Billion)
      Table 20 Asia Pacific Building Information Modeling Market, by Application, 2016 – 2026 (USD Billion)
      Table 21 Asia Pacific Building Information Modeling Market, by End User, 2016 – 2026 (USD Billion)
      Table 22 Latin America Building Information Modeling Market, by Country, 2016 – 2026 (USD Billion)
      Table 23 Latin America Building Information Modeling Market, by Component, 2016 – 2026 (USD Billion)
      Table 24 Latin America Building Information Modeling Market, by Project Phase, 2016 – 2026 (USD Billion)
      Table 25 Latin America Building Information Modeling Market, by Application, 2016 – 2026 (USD Billion)
      Table 26 Latin America Building Information Modeling Market, by End User, 2016 – 2026 (USD Billion)
      Table 27 The Middle-East and Africa Building Information Modeling Market, by Country, 2016 – 2026 (USD Billion)
      Table 28 The Middle-East and Africa Building Information Modeling Market, by Component, 2016 – 2026 (USD Billion)
      Table 29 The Middle-East and Africa Building Information Modeling Market, by Project Phase, 2016 – 2026 (USD Billion)
      Table 30 The Middle-East and Africa Building Information Modeling Market, by Application, 2016 – 2026 (USD Billion)
      Table 31 The Middle-East and Africa Building Information Modeling Market, by End User, 2016 – 2026 (USD Billion)
      Table 32 Global Building Information Modeling Market - Company Revenue Analysis, 2016 – 2019 (USD Billion)
      Table 33 Global Building Information Modeling Market - Company Revenue Share Analysis, 2016 – 2019 (%)
      Table 34 Acquisitions and Mergers
      Table 35 Market Drivers – Impact Analysis
      Table 36 Market Restraints
      Table 37 Market Opportunities
      Table 38 Major Buyers of Building Information Modeling
      Table 39 Distributors/Traders of Building Information Modeling by Region
      

Industry Major Market Players

  • Autodesk Inc.
  • Dassault Systems SA
  • Bentley Systems Inc.
  • Nemetschek AG
  • Beck Technology Ltd.
  • AVEVA Group plc.
  • Hexagon AB
  • Pentagon Solution Ltd.
  • Trimble Ltd
  • Synchro Software Ltd.
  • Pinnacle Infotech
  • Planon Group
  • LOD Planned Inc.
  • ACCA Software S.p.A.
  • Robert McNeel & Associates