![]()
Search Market Research Report
Bubble Tea Market Size, Share Global Analysis Report, 2024 – 2032

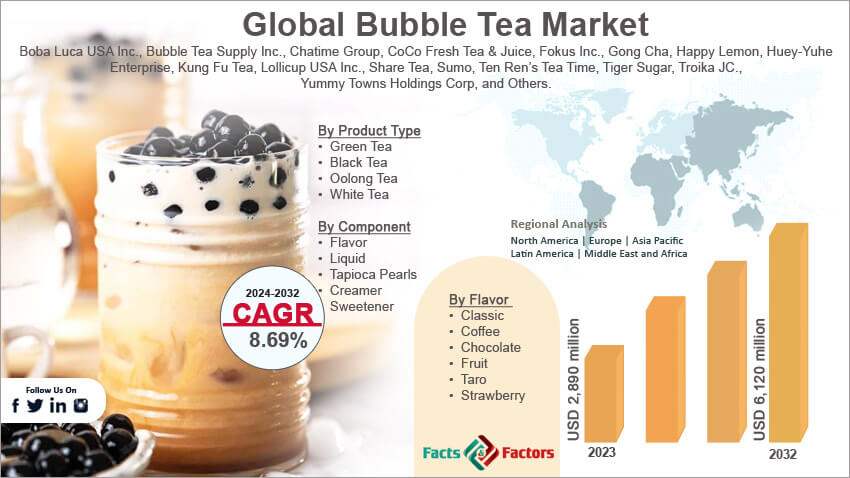
Bubble Tea Market Size, Share, Growth Analysis Report By Product Type (Green Tea, Black Tea, Oolong Tea, and White Tea), By Component (Flavor, Liquid, Tapioca Pearls, Creamer, Sweetener, and Others), By Flavor (Classic, Coffee, Chocolate, Fruit, Taro, Strawberry, and By Region - Global and Regional Industry Insights, Overview, Comprehensive Analysis, Trends, Statistical Research, Market Intelligence, Historical Data and Forecast 2024 – 2032
Industry Insights
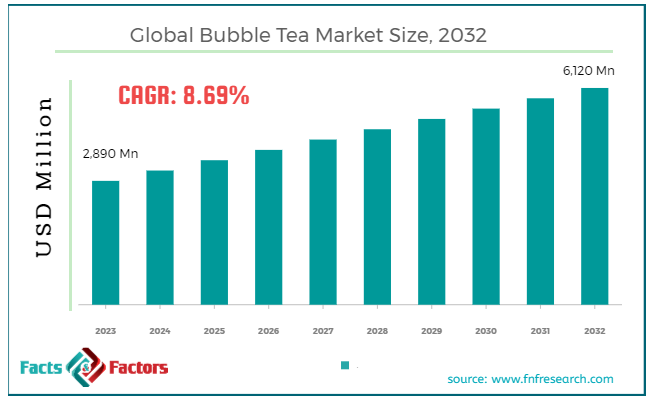
[224+ Pages Report] According to Facts & Factors, the global bubble tea market size in terms of revenue was valued at around USD 2,890 million in 2023 and is expected to reach a value of USD 6,120 million by 2032, growing at a CAGR of roughly 8.69% from 2024 to 2032. The global bubble tea market is projected to grow at a significant growth rate due to several driving factors.
 Market Overview
Bubble tea, also known as boba tea or pearl milk tea, is a popular Taiwanese drink that has gained international popularity since its invention in the 1980s. The drink combines tea (black, green, or oolong) with milk or fruit flavors and features distinctive chewy tapioca pearls at the bottom, which are made from tapioca starch. This combination of sweet flavors and textures along with the option to customize ingredients, sugar levels, and ice has made bubble tea a favorite among diverse audiences, especially among young people.
The bubble tea market has seen significant growth globally, driven by its popularity in Asia and increasing adoption in North America, Europe, and other regions. Market expansion is supported by the novelty of the drink and the cultural cachet associated with Asian culinary trends.
Innovations such as a variety of new flavors, toppings like fruit jellies and popping boba, and even dairy-free or healthier versions are continuously emerging, catering to a broader audience. Despite potential challenges such as health concerns over sugar content and competition from other beverages, the bubble tea market is expected to continue growing, with new shops opening worldwide and existing chains expanding their reach.
Key Highlights
- The bubble tea market has registered a CAGR of 8.69% during the forecast period.
- In terms of revenue, the global bubble tea market was estimated at roughly USD 2,890 million in 2023 and is predicted to attain a value of USD 6,120 million by 2032.
- The global bubble tea market is experiencing dynamic growth across various regions, driven by cultural preferences, innovative flavors, and increasing health consciousness.
- Based on the product type, the black tea segment is growing at a high rate and is projected to dominate the global market.
- By component, the flavor segment is projected to swipe the largest market share.
- Based on the flavor, the fruit segment is expected to dominate the global market.
- By region, the Asia Pacific region is growing at a high rate and is projected to dominate the global market.
Bubble Tea Market: Growth Drivers
- Unique Flavor & Texture Combination: Bubble tea's refreshing taste and delightful chewiness from the tapioca pearls create a unique and enjoyable experience. This combination caters to a wide range of palates, attracting a large consumer base.
- Rising Popularity Among Millennials and Gen Z: Bubble tea appeals strongly to younger generations who are drawn to its customizable nature and the experiential aspect of its unique textures and variety of flavors.
- Endless Customization: Bubble tea offers a vast array of customization options. Consumers can choose from various tea bases, milk or cream varieties, a spectrum of flavors and syrups, and an assortment of toppings like jellies and puddings. This personalization allows for a highly individualized and satisfying drink experience.
- Social Media Influence: The visually appealing nature of bubble tea has made it a social media darling. Eye-catching photos and videos fuel online trends, driving consumer interest and promoting brand awareness.
Restraints:
- Health Concerns Over High Sugar Content: Bubble tea often contains high levels of sugar and calories, raising health concerns among some consumers. This can limit market growth, especially with a growing focus on healthy lifestyles.
- Competition from Other Beverages: The bubble tea market is becoming increasingly saturated, with numerous established and emerging brands vying for market share. This fierce competition can lead to price pressures and erode profit margins.
Opportunities:
- Health-Oriented Innovations: Introducing new and exciting flavors, toppings, and healthier alternatives can attract new customers and expand the market reach. Exploring low-sugar or sugar-free options can cater to health-conscious consumers.
- Technological Advancements: Utilizing delivery apps and online ordering platforms can improve accessibility and convenience for customers. Additionally, exploring eco-friendly packaging solutions can appeal to environmentally conscious consumers.
- Geographic Expansion: Bubble tea's popularity is concentrated in some regions. Expanding into new markets, particularly in developing economies with a growing middle class, holds significant potential for future growth.
Challenges:
- Supply Chain Disruptions: The global market relies on a complex network of suppliers. Any disruptions impacting the supply chain for ingredients or packaging can cause price fluctuations and product shortages.
- Rising Ingredient Costs: Fluctuations in the cost of key ingredients, like tea leaves and tapioca pearls, can squeeze profit margins and potentially lead to price increases for consumers.
- Cultural Adaptation: While bubble tea is widely accepted in Asia, adapting the product to suit the tastes and dietary preferences of consumers in different regions requires careful consideration.
Bubble Tea Market: Segmentation Analysis
The global bubble tea market is segmented based on product type, component, flavor, and region.
By Product Type Insights
Based on Product Type, the global bubble tea market is divided into green tea, black tea, oolong tea, and white tea. Green tea-based bubble tea is popular due to its lighter, refreshing taste and numerous health benefits. Green tea is rich in antioxidants, particularly catechins, which are known for their health-promoting properties, including weight loss, improved brain function, and reduced risk of certain cancers.
The rising health consciousness among consumers and the preference for beverages with perceived health benefits drive the demand for green tea bubble tea. Innovations in flavor combinations, such as matcha and jasmine green tea, further boost its popularity. The green tea segment is expected to register the highest CAGR due to its health benefits and growing consumer preference for healthier beverage options??.
Black tea is projected to maintain its dominance with steady growth and captured a market share of around 44.6% in 2023??. Black tea is the most traditional base for bubble tea, known for its robust flavor and higher caffeine content. It is often paired with milk to create the classic milk tea variant, which remains a staple in bubble tea shops. The authenticity and rich taste of black tea make it a favorite among traditional bubble tea consumers. It also offers health benefits such as improved gut health and reduced blood sugar levels, which appeal to health-conscious consumers. Black tea holds the largest market share due to its established popularity and wide acceptance across different regions.
Oolong tea, known for its unique flavor that lies between green and black tea, offers a distinctive taste profile. It is semi-oxidized, providing a rich, aromatic flavor that is both refreshing and complex. The unique taste of oolong tea attracts consumers looking for variety and a different flavor experience in their bubble tea. It also offers health benefits such as improved metabolism and heart health. The oolong tea segment is gaining traction as consumers become more adventurous with their flavor choices, although it currently holds a smaller market share compared to green and black tea??.
White tea is the least processed among the tea types, known for its delicate flavor and high antioxidant content. It provides a subtle, sweet taste that appeals to consumers looking for a milder beverage. The health benefits of white tea, including its high antioxidant levels and lower caffeine content, attract health-conscious consumers. Its gentle flavor profile makes it a versatile base for various bubble tea flavors. While white tea is less common in bubble tea shops compared to other types, its health benefits and unique taste offer growth potential as consumers seek healthier and novel options.
By Component Insights
On the basis of Component, the global bubble tea market is bifurcated into flavor, liquid, tapioca pearls, creamer, sweetener, and others. The flavor segment is projected to register growth at a CAGR of 9.3% between 2024 to 2032. Flavor is a critical component that defines the taste profile of bubble tea. Common flavors include fruit-based options like mango, strawberry, and passion fruit, as well as traditional tea flavors like matcha, taro, and jasmine.
The diversity of flavors available in bubble tea attracts a wide range of consumers, from those preferring classic tastes to those seeking exotic and novel experiences. Continuous innovation in flavor combinations keeps the market dynamic and exciting. Flavors are expected to drive market growth as consumers' preferences evolve, with a particular trend towards natural and health-oriented flavorings??.
The liquid component forms the base of bubble tea, typically consisting of tea (black, green, oolong, white) mixed with water, milk, or dairy alternatives like almond or soy milk. The choice of liquid affects the drink's texture and taste. The rise in lactose intolerance and veganism has led to an increase in the use of non-dairy alternatives. The liquid segment holds significant market share and is expected to grow as more consumers opt for customized and health-conscious base options??.
Tapioca pearls are the hallmark of bubble tea, providing the distinctive chewy texture that defines the drink. Made from tapioca starch, these pearls are typically sweetened and sometimes flavored. The texture and novelty of tapioca pearls are major selling points. However, there are challenges related to consistency in quality and preparation time. Innovations like flavored or healthier tapioca pearls (e.g., low-sugar versions) are expanding the market, catering to a broader consumer base?.
Creamer is added to bubble tea to enhance its richness and creaminess. This can be in the form of dairy creamers or non-dairy alternatives such as coconut milk, almond milk, or soy milk. With increasing health awareness, there's a shift towards using non-dairy creamers, which cater to lactose-intolerant and vegan consumers. The creamer segment is expected to grow, driven by the demand for diverse and health-conscious options in bubble tea formulations??.
Sweeteners are used to adjust the sweetness level of bubble tea. Options range from traditional sugar and syrups to healthier alternatives like honey, stevia, and agave. Health trends influence the choice of sweeteners, with many consumers opting for natural or low-calorie alternatives to reduce sugar intake. The sweetener segment is evolving with a focus on healthier options, which is likely to drive market growth as consumers become more health-conscious??.
By Flavor Insights
Based on Flavor, the global bubble tea market is categorized into classic, coffee, chocolate, fruit, taro, strawberry, and others. Classic bubble tea typically features a black tea base with milk and tapioca pearls. It’s the traditional version of bubble tea, known for its rich and balanced flavor.
The classic flavor remains a staple due to its authentic taste and strong association with the origins of bubble tea. It appeals to traditionalists and new consumers alike. The classic flavor continues to enjoy steady demand, driven by its timeless appeal and the growing global popularity of bubble tea??.
Coffee-flavored bubble tea combines the robust taste of coffee with the chewy texture of tapioca pearls. It’s popular among coffee enthusiasts who enjoy a twist on their favorite beverage. This flavor benefits from the universal appeal of coffee and the trend towards hybrid beverages that combine familiar tastes with new experiences. The coffee segment is expected to grow as consumers look for innovative ways to enjoy coffee, and bubble tea shops experiment with various coffee-based drinks??.
Chocolate bubble tea offers a sweet, indulgent option, often made with cocoa powder or chocolate syrup mixed with tea and milk. Its popularity spans all age groups, making it a versatile flavor that appeals to a broad audience. The comfort and familiarity of chocolate drive its demand. The chocolate flavor is anticipated to have rapid growth due to its widespread appeal and the ongoing introduction of new variations and combinations??.
The fruit flavor segment has held a market share of around 38.7% in 2023. Fruit-flavored bubble tea includes a wide range of options such as mango, strawberry, passion fruit, and lychee. These flavors are typically blended with tea and sometimes milk. The health benefits associated with fruit flavors, including vitamins and antioxidants, attract health-conscious consumers. The refreshing taste makes it a popular choice, especially in warmer climates. The fruit segment is one of the fastest-growing, driven by its health appeal and the endless possibilities for new and exciting flavor combinations?.
Taro bubble tea is made from taro root, giving it a distinct purple color and a creamy, nutty flavor. It’s one of the unique and beloved flavors in the bubble tea repertoire. Its unique taste and visual appeal make taro bubble tea a favorite among consumers looking for something different from traditional flavors. The taro flavor is gaining traction, with a growing number of consumers appreciating its unique taste and health benefits, such as fiber content??.
Strawberry bubble tea is typically made with fresh or syrup-based strawberry flavor mixed with tea and milk. It’s popular for its sweet and fruity taste. The strawberry flavor appeals particularly to younger consumers and those with a preference for fruity, refreshing beverages. This flavor segment is expected to grow steadily as it remains a popular choice in the fruit flavor category, often featured in seasonal specials and new product launches??.
Recent Developments:
- In February 2024, Gong Cha, a leading bubble tea chain, strengthened its alliance with European franchisee Mad Vision Group by announcing the opening of 15 new stores in a North African country. This strategic expansion aims to tap into the growing popularity of bubble tea in the region.
- In January 2024, the MIXUE Group, a prominent Chinese bubble tea and beverage company, revealed its ambitious plans to raise nearly USD 1 billion through an upcoming IPO in Hong Kong. The funds will be used to enhance its business operations and fuel further growth.
- In January 2023, Gong Cha, a global leader in the bubble tea market originating from Taiwan, celebrated a significant milestone by opening its first store in Portugal. This expansion into Portugal, managed by franchisee Amelle Morisot, marks Gong Cha's continued growth in Europe since its debut in the continent in 2019.
- In April 2022, New York-based start-up BUBLUV, Inc. introduced its innovative BUBLUV Bubble Tea, a Ready-To-Drink (RTD) boba tea with fewer than 50 calories per bottle and no added sugar or chemical components. These healthier alternative aims to cater to health-conscious consumers looking for a guilt-free bubble tea experience.
Report Scope
Report Attribute |
Details |
Market Size in 2023 |
USD 2,890 Million |
Projected Market Size in 2032 |
USD 6,120 Million |
CAGR Growth Rate |
8.69% CAGR |
Base Year |
2023 |
Forecast Years |
2024-2032 |
Key Market Players |
Boba Luca USA Inc., Bubble Tea Supply Inc., Chatime Group, CoCo Fresh Tea & Juice, Fokus Inc., Gong Cha, Happy Lemon, Huey-Yuhe Enterprise, Kung Fu Tea, Lollicup USA Inc., Share Tea, Sumo, Ten Ren’s Tea Time, Tiger Sugar, Troika JC., Yummy Towns Holdings Corp, and Others. |
Key Segment |
By Product Type, By Component, By Flavor, and By Region |
Major Regions Covered |
North America, Europe, Asia Pacific, Latin America, and the Middle East &, Africa |
Purchase Options |
Request customized purchase options to meet your research needs. Explore purchase options |
Bubble Tea Market: Regional Analysis
- Asia Pacific is expected to dominate the global market at a CAGR of 9.2% during the forecast period
Asia Pacific dominates the bubble tea market due to its origins in Taiwan and widespread popularity across the region. Countries like Taiwan, China, Japan, and Thailand are key players, with a well-established culture of tea consumption and innovative flavor profiles.
The region's deep-rooted cultural affinity for tea and the rapid urbanization contributing to the proliferation of bubble tea shops play significant roles. The Asia Pacific market is expected to exhibit a robust CAGR, contributing significantly to the global market growth. Estimates suggest a CAGR of approximately 9.2% during the forecast period??.
North America holds the second-largest market share. The United States and Canada are leading markets within this region, driven by increasing consumer preference for diverse and innovative beverages. The trend towards healthier, low-alcohol drinks and the rising number of specialty tea shops are key growth drivers. The North American market is projected to grow at a substantial CAGR of around 9.5% from 2024 to 2032, reflecting increasing consumer interest and market expansion??.
Europe has seen significant growth in the bubble tea market, particularly in countries like the UK, Germany, and France. The introduction of bubble tea in major European cities and the establishment of large chain outlets have boosted market visibility. European consumers’ growing interest in novel and exotic flavors supports market expansion.
The bubble tea market in Latin America is emerging, with Brazil and Mexico being key markets. The region's market growth is influenced by increasing urbanization and a shift in consumer preferences towards novel beverages. Although tea consumption is less prevalent than coffee, bubble tea is gaining popularity among younger demographics.
The market in the Middle East & Africa is growing slowly but steadily. The increasing cross-cultural food trends and a rising health-conscious approach among consumers are driving factors. The market potential is being tapped through innovative offerings and the gradual introduction of bubble tea shops in urban centers. The Middle East & Africa region is expected to see a lower growth rate compared to other regions??.
Bubble Tea Market: List of Key Players
Some of the main competitors dominating the global bubble tea market include;
- Boba Luca USA Inc.
- Bubble Tea Supply Inc.
- Chatime Group
- CoCo Fresh Tea & Juice
- Fokus Inc.
- Gong Cha
- Happy Lemon
- Huey-Yuhe Enterprise
- Kung Fu Tea
- Lollicup USA Inc.
- Share Tea
- Sumo
- Ten Ren’s Tea Time
- Tiger Sugar
- Troika JC.
- Yummy Towns Holdings Corp
The global bubble tea market is segmented as follows:
By Product Type Segment Analysis
- Green Tea
- Black Tea
- Oolong Tea
- White Tea
By Component Segment Analysis
- Flavor
- Liquid
- Tapioca Pearls
- Creamer
- Sweetener
- Others
By Flavor Segment Analysis
- Classic
- Coffee
- Chocolate
- Fruit
- Taro
- Strawberry
- Others
By Regional Segment Analysis
- North America
- The U.S.
- Canada
- Mexico
- Europe
- France
- The UK
- Spain
- Germany
- Italy
- Rest of Europe
- Asia Pacific
- China
- Japan
- India
- Australia
- Southeast Asia
- Rest of Asia Pacific
- The Middle East & Africa
- Saudi Arabia
- UAE
- Egypt
- Kuwait
- South Africa
- Rest of the Middle East & Africa
- Latin America
- Brazil
- Argentina
- Rest of Latin America
Table of Content
Industry Major Market Players
- Boba Luca USA Inc.
- Bubble Tea Supply Inc.
- Chatime Group
- CoCo Fresh Tea & Juice
- Fokus Inc.
- Gong Cha
- Happy Lemon
- Huey-Yuhe Enterprise
- Kung Fu Tea
- Lollicup USA Inc.
- Share Tea
- Sumo
- Ten Ren’s Tea Time
- Tiger Sugar
- Troika JC.
- Yummy Towns Holdings Corp


Copyright © 2025 - 2026, All Rights Reserved, Facts and Factors