Search Market Research Report

Discover Our Latest Reports
Discover Our Featured Reports
Discover Top Selling Reports

Bromine Derivatives Market Size, Share Global Analysis Report, 2020–2026

report img

Bromine Derivatives Market By Type (Brominated Polystyrene, Tetrabromobisphenol A, Calcium Bromide, Sodium Bromide, Zinc Bromide, Hydrobromic Acid, Decabromodiphenyl Ethane, and Others), and By Application (Flame Retardants, Organic Intermediates, Oil & Gas, Biocides, PTA Synthesis, and Others): Global Industry Outlook, Market Size, Business Intelligence, Consumer Preferences, Statistical Surveys, Comprehensive Analysis, Historical Developments, Current Trends, and Forecast 2020–2026

Industry Insights

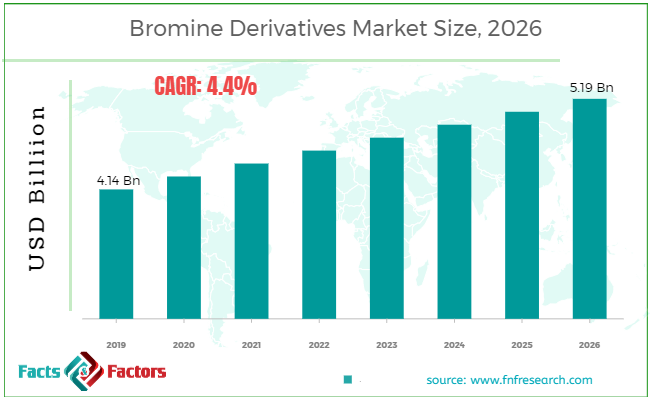
[175+ Pages Report] According to the report published by Facts Factors, the global bromine derivatives market size was worth around USD 4.14 billion in 2019 and is predicted to grow to around USD 5.59 billion by 2026 with a compound annual growth rate (CAGR) of roughly 4.4% between 2020 and 2026. The report analyzes the global bromine derivatives market drivers, restraints/challenges, and the effect they have on the demands during the projection period. In addition, the report explores emerging opportunities in the bromine derivatives market.

Bromine Derivatives Market

To know more about this report | Request Free Sample Copy

The bromine derivatives market report analyzes and notifies the industry statistics at the global as well as regional and country levels in order to acquire a thorough perspective of the entire bromine derivatives market. The historical and past insights are provided for FY 2016 to FY 2019 whereas projected trends are delivered for FY 2020 to FY 2026. The quantitative and numerical data is represented in terms of both volume (Kilo Tons) and value (USD Million) from FY 2016 – 2026.


logoKey Insights from Primary Research

  • As per our primary respondents, the bromine derivatives market is set to grow annually at a rate of around 4.4%
  • It was established through primary research that the bromine derivatives market was valued at around USD 4.14 billion in 2019
  • North America held the largest market share of bromine derivatives in terms of revenue in 2019
  • The “Tetrabromobisphenol A” category, on the basis of type segmentation, was the leading revenue-generating category in 2019
  • The “Flame Retardants” category, on the basis of application segmentation, was the leading revenue-generating category in 2019

logoKey Recommendations from Analysts

  • As per our analysts, the rise in the utilization of bromine in controlling mercury emissions and an upsurge in demand for halogenated flame retardants have spurred the growth of the market
  • NaBr is chemically stable and is, thus, used with other solutions of bromides and chlorides
  • Pharmaceutical is one of the promising applications of bromine derivatives owing to the increasing consumption of NaBr for making medicinal intermediates and as anti-epileptic drugs (AEDs) because of its anti-seizure properties
  • Biocides are substances that kill microorganisms and are used to extend shelf life and maintain the quality of different products
  • The Asia Pacific is expected to be the fastest-growing region in terms of value as well as volume during the forecast

The quantitative data is further underlined and reinforced by comprehensive qualitative data which comprises various across-the-board market dynamics. The rationales which directly or indirectly impact the bromine derivatives industry are exemplified through parameters such as growth drivers, restraints, challenges, and opportunities among other impacting factors.

Throughout our research report, we have encompassed all the proven models and tools of industry analysis and extensively illustrated all the key business strategies and business models adopted in the bromine derivatives industry. The report provides an all-inclusive and detailed competitive landscape prevalent in the bromine derivatives market.

The report utilizes established industry analysis tools and models such as Porter’s Five Forces framework to analyze and recognize critical business strategies adopted by various stakeholders involved in the entire value chain of the bromine derivatives industry. The bromine derivatives market report additionally employs SWOT analysis and PESTLE analysis models for further in-depth analysis.

The report study further includes an in-depth analysis of industry players' market shares and provides an overview of leading players' market position in the bromine derivatives sector. Key strategic developments in the bromine derivatives market competitive landscape such as acquisitions & mergers, inaugurations of different products and services, partnerships & joint ventures, MoU agreements, VC & funding activities, R&D activities, and geographic expansion among other noteworthy activities by key players of the bromine derivatives market are appropriately highlighted in the report.

Brominated polystyrene is manufactured by the catalysis of polystyrene with bromine. It is majorly used in the manufacturing of flame retardants. It has high thermal stability and is employed in high-temperature applications. Production of these chemicals is mainly restricted to developing countries, given the implementation of stricter regulations regarding bromine-based flame retardants in developed regions such as the U.S. and Europe. China and other Southeast Asian countries are the leading countries involved in the production of these chemicals.

The bromine derivatives market research report delivers an acute valuation and taxonomy of the bromine derivatives industry by practically splitting the market on the basis of different types, applications, and regions. Through the analysis of the historical and projected trends, all the segments and sub-segments were evaluated through the bottom-up approach, and different market sizes have been projected for FY 2020 to FY 2026.

logoReport Scope

Report Attribute

Details

Market Size in 2019

USD 4.14 Billion

Projected Market Size in 2026

USD 5.59 Billion

CAGR Growth Rate

4.4% CAGR

Base Year

2019

Forecast Years

2020-2026

Key Market Players

Tata Chemicals Ltd., Honeywell International Inc., Israel Chemicals Limited, Hindustan Salts Ltd., Morre-Tec Industries, Inc., JK Chemicals, ICC Industries, Agrocel Industries Ltd., Sontara Organo Industries, Neogen Chemicals Limited, Albemarle Corporation, Lanxess Corporation, Tosoh Corporation, Tetra Technologies Inc., Jordan Bromine Company Ltd., Beacon Organosys, Parad Chem Corporation, Gulf Resources Inc., Kingboard Chemical Holdings Limited, Nirma Limited, and Others

Key Segment

By Type, Application, and Region

Major Regions Covered

North America, Europe, Asia Pacific, Latin America, and the Middle East & Africa

Purchase Options

Request customized purchase options to meet your research needs. Explore purchase options

The regional segmentation of the bromine derivatives industry includes the complete classification of all the major continents including North America, Latin America, Europe, Asia Pacific, and the Middle East & Africa. Further, country-wise data for the bromine derivatives industry is provided for the leading economies of the world.

The bromine derivatives market is segmented based on type and application. On the basis of type segmentation, the market is classified into brominated polystyrene, tetrabromobisphenol a, calcium bromide, sodium bromide, zinc bromide, hydrobromic acid, decabromodiphenyl ethane, and others. In terms of application segmentation, the market is bifurcated into flame retardants, organic intermediates, oil & gas, biocides, pta synthesis, and others.

logoSome of the essential players operating in the bromine derivatives market, but not restricted to include:

  • Tata Chemicals Ltd.
  •  Honeywell International Inc.
  •  Israel Chemicals Limited
  •  Hindustan Salts Ltd.
  •  Morre-Tec Industries  Inc.
  •  JK Chemicals
  •  ICC Industries
  •  Agrocel Industries Ltd.
  •  Sontara Organo Industries
  •  Neogen Chemicals Limited
  •  Albemarle Corporation
  •  Lanxess Corporation
  •  Tosoh Corporation
  •  Tetra Technologies Inc.
  •  Jordan Bromine Company Ltd.
  •  Beacon Organosys
  •  Parad Chem Corporation
  •  Gulf Resources Inc.
  •  Kingboard Chemical Holdings Limited
  •  Nirma Limited

The taxonomy of the bromine derivatives industry by its scope and segmentation is as follows:

logo By Type Segmentation Analysis (Customizable)

  • Brominated Polystyrene
  • Tetrabromobisphenol A
  • Calcium Bromide
  • Sodium Bromide
  • Zinc Bromide
  • Hydrobromic Acid
  • Decabromodiphenyl Ethane
  • Others

logo By Application Segmentation Analysis (Customizable)

  • Flame Retardants
  • Organic Intermediates
  • Oil & Gas
  • Biocides
  • PTA Synthesis
  • Others

logo By Regional Segmentation Analysis (Customizable)

  • North America
    • The U.S.
    • Canada
  • Europe
    • Germany
    • The UK
    • France
    • Spain
    • Italy
    • Rest of Europe
  • Asia Pacific
    • China
    • Japan
    • India
    • South Korea
    • Southeast Asia
    • Rest of Asia Pacific
  • Latin America
    • Brazil
    • Mexico
    • Rest of Latin America
  • Middle East & Africa
    • GCC
    • South Africa
    • Rest of Middle East & Africa

Table of Content

  1. CHAPTER 1. Executive Summary
  2. CHAPTER 2. Bromine Derivatives market – Type Analysis
    1. 2.1. Global Bromine Derivatives Market – Type Overview
    2. 2.2. Global Bromine Derivatives Market Share, by Type, 2019 & 2026 (USD Million)
    3. 2.3. Global Bromine Derivatives Market share, by Type, 2019 & 2026 (Kilo Tons)
    4. 2.4. Brominated Polystyrene
      1. 2.4.1. Global Brominated Polystyrene Bromine Derivatives Market, 2016-2026 (USD Million)
      2. 2.4.2. Global Brominated Polystyrene Bromine Derivatives Market, 2016-2026 (Kilo Tons)
    5. 2.5. Tetrabromobisphenol A
      1. 2.5.1. Global Tetrabromobisphenol A Bromine Derivatives Market, 2016-2026 (USD Million)
      2. 2.5.2. Global Tetrabromobisphenol A Bromine Derivatives Market, 2016-2026 (Kilo Tons)
    6. 2.6. Calcium Bromide
      1. 2.6.1. Global Calcium Bromide Bromine Derivatives Market, 2016-2026 (USD Million)
      2. 2.6.2. Global Calcium Bromide Bromine Derivatives Market, 2016-2026 (Kilo Tons)
    7. 2.7. Sodium Bromide
      1. 2.7.1. Global Sodium Bromide Bromine Derivatives Market, 2016-2026 (USD Million)
      2. 2.7.2. Global Sodium Bromide Bromine Derivatives Market, 2016-2026 (Kilo Tons)
    8. 2.8. Zinc Bromide
      1. 2.8.1. Global Zinc Bromide Bromine Derivatives Market, 2016-2026 (USD Million)
      2. 2.8.2. Global Zinc Bromide Bromine Derivatives Market, 2016-2026 (Kilo Tons)
    9. 2.9. Hydrobromic Acid
      1. 2.9.1. Global Hydrobromic Acid Bromine Derivatives Market, 2016-2026 (USD Million)
      2. 2.9.2. Global Hydrobromic Acid Bromine Derivatives Market, 2016-2026 (Kilo Tons)
    10. 2.10. Decabromodiphenyl Ethane
      1. 2.10.1. Global Decabromodiphenyl Ethane Bromine Derivatives Market, 2016-2026 (USD Million)
      2. 2.10.2. Global Decabromodiphenyl Ethane Bromine Derivatives Market, 2016-2026 (Kilo Tons)
    11. 2.11. Others
      1. 2.11.1. Global Others Bromine Derivatives Market, 2016-2026 (USD Million)
      2. 2.11.2. Global Others Bromine Derivatives Market, 2016-2026 (Kilo Tons)
  3. CHAPTER 3. Bromine Derivatives market – Application Analysis
    1. 3.1. Global Bromine Derivatives Market – Application Overview
    2. 3.2. Global Bromine Derivatives Market Share, by Application, 2019 & 2026 (USD Million)
    3. 3.3. Global Bromine Derivatives Market share, by Application, 2019 & 2026 (Kilo Tons)
    4. 3.4. Flame Retardants
      1. 3.4.1. Global Flame Retardants Bromine Derivatives Market, 2016-2026 (USD Million)
      2. 3.4.2. Global Flame Retardants Bromine Derivatives Market, 2016-2026 (Kilo Tons)
    5. 3.5. Organic Intermediates
      1. 3.5.1. Global Organic Intermediates Bromine Derivatives Market, 2016-2026 (USD Million)
      2. 3.5.2. Global Organic Intermediates Bromine Derivatives Market, 2016-2026 (Kilo Tons)
    6. 3.6. Oil & Gas
      1. 3.6.1. Global Oil & Gas Bromine Derivatives Market, 2016-2026 (USD Million)
      2. 3.6.2. Global Oil & Gas Bromine Derivatives Market, 2016-2026 (Kilo Tons)
    7. 3.7. Biocides
      1. 3.7.1. Global Biocides Bromine Derivatives Market, 2016-2026 (USD Million)
      2. 3.7.2. Global Biocides Bromine Derivatives Market, 2016-2026 (Kilo Tons)
    8. 3.8. PTA Synthesis
      1. 3.8.1. Global PTA Synthesis Bromine Derivatives Market, 2016-2026 (USD Million)
      2. 3.8.2. Global PTA Synthesis Bromine Derivatives Market, 2016-2026 (Kilo Tons)
    9. 3.9. Others
      1. 3.9.1. Global Others Bromine Derivatives Market, 2016-2026 (USD Million)
      2. 3.9.2. Global Others Bromine Derivatives Market, 2016-2026 (Kilo Tons)
  4. CHAPTER 4. Bromine Derivatives market – Regional Analysis
    1. 4.1. Global Bromine Derivatives Market Regional Overview
    2. 4.2. Global Bromine Derivatives Market Share, by Region, 2019 & 2026 (Value)
    3. 4.3. Global Bromine Derivatives Market Share, by Region, 2019 & 2026 (Volume)
    4. 4.4. North America
      1. 4.4.1. North America Bromine Derivatives Market size and forecast, 2016-2026
      2. 4.4.2. North America Bromine Derivatives Market, by Country, 2019 - 2026 (USD Million)
      3. 4.4.3. North America Market size and forecast, 2016-2026 (Kilo Tons)
      4. 4.4.4. North America Bromine Derivatives Market, by Country, 2019 - 2026 (Kilo Tons)
      5. 4.4.5. North America Bromine Derivatives Market, by Type, 2016-2026
        1. 4.4.5.1. North America Bromine Derivatives Market, by Type, 2016-2026 (USD Million)
        2. 4.4.5.2. North America Bromine Derivatives Market, by Type, 2016-2026 (Kilo Tons)
      6. 4.4.6. North America Bromine Derivatives Market, by Application, 2016-2026
        1. 4.4.6.1. North America Bromine Derivatives Market, by Application, 2016-2026 (USD Million)
        2. 4.4.6.2. North America Bromine Derivatives Market, by Application, 2016-2026 (Kilo Tons)
      7. 4.4.7. U.S.
        1. 4.4.7.1. U.S. Market size and forecast, 2016-2026 (USD Million)
        2. 4.4.7.2. U.S. Market size and forecast, 2016-2026 (Kilo Tons)
      8. 4.4.8. Canada
        1. 4.4.8.1. Canada Market size and forecast, 2016-2026 (USD Million)
        2. 4.4.8.2. Canada Market size and forecast, 2016-2026 (Kilo Tons)
    5. 4.5. Europe
      1. 4.5.1. Europe Bromine Derivatives Market size and forecast, 2016-2026
      2. 4.5.2. Europe Bromine Derivatives Market, by Country, 2019 - 2026 (USD Million)
      3. 4.5.3. Europe Market size and forecast, 2016-2026 (Kilo Tons)
      4. 4.5.4. Europe Bromine Derivatives Market, by Country, 2019 - 2026 (Kilo Tons)
      5. 4.5.5. Europe Bromine Derivatives Market, by Type, 2016-2026
        1. 4.5.5.1. Europe Bromine Derivatives Market, by Type, 2016-2026 (USD Million)
        2. 4.5.5.2. Europe Bromine Derivatives Market, by Type, 2016-2026 (Kilo Tons)
      6. 4.5.6. Europe Bromine Derivatives Market, by Application, 2016-2026
        1. 4.5.6.1. Europe Bromine Derivatives Market, by Application, 2016-2026 (USD Million)
        2. 4.5.6.2. Europe Bromine Derivatives Market, by Application, 2016-2026 (Kilo Tons)
      7. 4.5.7. Germany
        1. 4.5.7.1. Germany Market size and forecast, 2016-2026 (USD Million)
        2. 4.5.7.2. Germany Market size and forecast, 2016-2026 (Kilo Tons)
      8. 4.5.8. France
        1. 4.5.8.1. France Market size and forecast, 2016-2026 (USD Million)
        2. 4.5.8.2. France Market size and forecast, 2016-2026 (Kilo Tons)
      9. 4.5.9. U.K.
        1. 4.5.9.1. U.K. Market size and forecast, 2016-2026 (USD Million)
        2. 4.5.9.2. U.K. Market size and forecast, 2016-2026 (Kilo Tons)
      10. 4.5.10. Italy
        1. 4.5.10.1. Italy Market size and forecast, 2016-2026 (USD Million)
        2. 4.5.10.2. Italy Market size and forecast, 2016-2026 (Kilo Tons)
      11. 4.5.11. Spain
        1. 4.5.11.1. Spain Market size and forecast, 2016-2026 (USD Million)
        2. 4.5.11.2. Spain Market size and forecast, 2016-2026 (Kilo Tons)
      12. 4.5.12. Rest of Europe
        1. 4.5.12.1. Rest of Europe Market size and forecast, 2016-2026 (USD Million)
        2. 4.5.12.2. Rest of Europe Market size and forecast, 2016-2026 (Kilo Tons)
    6. 4.6. Asia Pacific
      1. 4.6.1. Asia Pacific Bromine Derivatives Market size and forecast, 2016-2026
      2. 4.6.2. Asia Pacific Bromine Derivatives Market, by Country, 2019 - 2026 (USD Million)
      3. 4.6.3. Asia Pacific Market size and forecast, 2016-2026 (Kilo Tons)
      4. 4.6.4. Asia Pacific Bromine Derivatives Market, by Country, 2019 - 2026 (Kilo Tons)
      5. 4.6.5. Asia Pacific Bromine Derivatives Market, by Type, 2016-2026
        1. 4.6.5.1. Asia Pacific Bromine Derivatives Market, by Type, 2016-2026 (USD Million)
        2. 4.6.5.2. Asia Pacific Bromine Derivatives Market, by Type, 2016-2026 (Kilo Tons)
      6. 4.6.6. Asia Pacific Bromine Derivatives Market, by Application, 2016-2026
        1. 4.6.6.1. Asia Pacific Bromine Derivatives Market, by Application, 2016-2026 (USD Million)
        2. 4.6.6.2. Asia Pacific Bromine Derivatives Market, by Application, 2016-2026 (Kilo Tons)
      7. 4.6.7. China
        1. 4.6.7.1. China Market size and forecast, 2016-2026 (USD Million)
        2. 4.6.7.2. China Market size and forecast, 2016-2026 (Kilo Tons)
      8. 4.6.8. Japan
        1. 4.6.8.1. Japan Market size and forecast, 2016-2026 (USD Million)
        2. 4.6.8.2. Japan Market size and forecast, 2016-2026 (Kilo Tons)
      9. 4.6.9. India
        1. 4.6.9.1. India Market size and forecast, 2016-2026 (USD Million)
        2. 4.6.9.2. India Market size and forecast, 2016-2026 (Kilo Tons)
      10. 4.6.10. South Korea
        1. 4.6.10.1. South Korea Market size and forecast, 2016-2026 (USD Million)
        2. 4.6.10.2. South Korea Market size and forecast, 2016-2026 (Kilo Tons)
      11. 4.6.11. South-East Asia
        1. 4.6.11.1. South-East Asia Market size and forecast, 2016-2026 (USD Million)
        2. 4.6.11.2. South-East Asia Market size and forecast, 2016-2026 (Kilo Tons)
      12. 4.6.12. Rest of Asia Pacific
        1. 4.6.12.1. Rest of Asia Pacific Market size and forecast, 2016-2026 (USD Million)
        2. 4.6.12.2. Rest of Asia Pacific Market size and forecast, 2016-2026 (Kilo Tons)
    7. 4.7. Latin America
      1. 4.7.1. Latin America Bromine Derivatives Market size and forecast, 2016-2026
      2. 4.7.2. Latin America Bromine Derivatives Market, by Country, 2019 - 2026 (USD Million)
      3. 4.7.3. Latin America Market size and forecast, 2016-2026 (Kilo Tons)
      4. 4.7.4. Latin America Bromine Derivatives Market, by Country, 2019 - 2026 (Kilo Tons)
      5. 4.7.5. Latin America Bromine Derivatives Market, by Type, 2016-2026
        1. 4.7.5.1. Latin America Bromine Derivatives Market, by Type, 2016-2026 (USD Million)
        2. 4.7.5.2. Latin America Bromine Derivatives Market, by Type, 2016-2026 (Kilo Tons)
      6. 4.7.6. Latin America Bromine Derivatives Market, by Application, 2016-2026
        1. 4.7.6.1. Latin America Bromine Derivatives Market, by Application, 2016-2026 (USD Million)
        2. 4.7.6.2. Latin America Bromine Derivatives Market, by Application, 2016-2026 (Kilo Tons)
      7. 4.7.7. Brazil
        1. 4.7.7.1. Brazil Market size and forecast, 2016-2026 (USD Million)
        2. 4.7.7.2. Brazil Market size and forecast, 2016-2026 (Kilo Tons)
      8. 4.7.8. Mexico
        1. 4.7.8.1. Mexico Market size and forecast, 2016-2026 (USD Million)
        2. 4.7.8.2. Mexico Market size and forecast, 2016-2026 (Kilo Tons)
      9. 4.7.9. Rest of Latin America
        1. 4.7.9.1. Rest of Latin America Market size and forecast, 2016-2026 (USD Million)
        2. 4.7.9.2. Rest of Latin America Market size and forecast, 2016-2026 (Kilo Tons)
    8. 4.8. The Middle-East and Africa
      1. 4.8.1. The Middle-East and Africa Bromine Derivatives Market size and forecast, 2016-2026
      2. 4.8.2. The Middle-East and Africa Bromine Derivatives Market, by Country, 2019 - 2026 (USD Million)
      3. 4.8.3. The Middle-East and Africa Market size and forecast, 2016-2026 (Kilo Tons)
      4. 4.8.4. The Middle-East and Africa Bromine Derivatives Market, by Country, 2019 - 2026 (Kilo Tons)
      5. 4.8.5. The Middle-East and Africa Bromine Derivatives Market, by Type, 2016-2026
        1. 4.8.5.1. The Middle-East and Africa Bromine Derivatives Market, by Type, 2016-2026 (USD Million)
        2. 4.8.5.2. The Middle-East and Africa Bromine Derivatives Market, by Type, 2016-2026 (Kilo Tons)
      6. 4.8.6. The Middle-East and Africa Bromine Derivatives Market, by Application, 2016-2026
        1. 4.8.6.1. The Middle-East and Africa Bromine Derivatives Market, by Application, 2016-2026 (USD Million)
        2. 4.8.6.2. The Middle-East and Africa Bromine Derivatives Market, by Application, 2016-2026 (Kilo Tons)
      7. 4.8.7. GCC Countries
        1. 4.8.7.1. GCC Countries Market size and forecast, 2016-2026 (USD Million)
        2. 4.8.7.2. GCC Countries Market size and forecast, 2016-2026 (Kilo Tons)
      8. 4.8.8. South Africa
        1. 4.8.8.1. South Africa Market size and forecast, 2016-2026 (USD Million)
        2. 4.8.8.2. South Africa Market size and forecast, 2016-2026 (Kilo Tons)
      9. 4.8.9. Rest of Middle-East Africa
        1. 4.8.9.1. Rest of Middle-East Africa Market size and forecast, 2016-2026 (USD Million)
        2. 4.8.9.2. Rest of Middle-East Africa Market size and forecast, 2016-2026 (Kilo Tons)
  5. CHAPTER 5. Bromine Derivatives Production, Consumption, Export, Import by Regions
    1. 5.1. Global Bromine Derivatives production and revenue, 2016-2026 (USD Million) (Kilo Tons)
    2. 5.2. Global Import and Export Analysis, by Region
  6. CHAPTER 6. Bromine Derivatives market – Competitive Landscape
    1. 6.1. Competitor Market Share – Revenue
    2. 6.2. Market Concentration Rate Analysis, Top 3 and Top 5 Players
    3. 6.3. Competitor Market Share – Volume
    4. 6.4. Strategic Development
      1. 6.4.1. Acquisitions and Mergers
      2. 6.4.2. New Products
      3. 6.4.3. Research & Development Activities
  7. CHAPTER 7. Company Profiles
    1. 7.1. Tata Chemicals Ltd.
      1. 7.1.1. Company Overview
      2. 7.1.2. Tata Chemicals Ltd. Sales, Revenue, Price, and Gross Margin
      3. 7.1.3. Product portfolio
      4. 7.1.4. Recent initiatives
    2. 7.2. Honeywell International Inc.
      1. 7.2.1. Company Overview
      2. 7.2.2. Honeywell International Inc. Sales, Revenue, Price, and Gross Margin
      3. 7.2.3. Product portfolio
      4. 7.2.4. Recent initiatives
    3. 7.3. Israel Chemicals Limited
      1. 7.3.1. Company Overview
      2. 7.3.2. Israel Chemicals Limited Sales, Revenue, Price, and Gross Margin
      3. 7.3.3. Product portfolio
      4. 7.3.4. Recent initiatives
    4. 7.4. Hindustan Salts Ltd.
      1. 7.4.1. Company Overview
      2. 7.4.2. Hindustan Salts Ltd. Sales, Revenue, Price, and Gross Margin
      3. 7.4.3. Product portfolio
      4. 7.4.4. Recent initiatives
    5. 7.5. Morre-Tec Industries, Inc.
      1. 7.5.1. Company Overview
      2. 7.5.2. Morre-Tec Industries, Inc. Sales, Revenue, Price, and Gross Margin
      3. 7.5.3. Product portfolio
      4. 7.5.4. Recent initiatives
    6. 7.6. JK Chemicals
      1. 7.6.1. Company Overview
      2. 7.6.2. JK Chemicals Sales, Revenue, Price, and Gross Margin
      3. 7.6.3. Product portfolio
      4. 7.6.4. Recent initiatives
    7. 7.7. ICC Industries
      1. 7.7.1. Company Overview
      2. 7.7.2. ICC Industries Sales, Revenue, Price, and Gross Margin
      3. 7.7.3. Product portfolio
      4. 7.7.4. Recent initiatives
    8. 7.8. Agrocel Industries Ltd.
      1. 7.8.1. Company Overview
      2. 7.8.2. Agrocel Industries Ltd. Sales, Revenue, Price, and Gross Margin
      3. 7.8.3. Product portfolio
      4. 7.8.4. Recent initiatives
    9. 7.9. Sontara Organo Industries
      1. 7.9.1. Company Overview
      2. 7.9.2. Sontara Organo Industries Sales, Revenue, Price, and Gross Margin
      3. 7.9.3. Product portfolio
      4. 7.9.4. Recent initiatives
    10. 7.10. Neogen Chemicals Limited
      1. 7.10.1. Company Overview
      2. 7.10.2. Neogen Chemicals Limited Sales, Revenue, Price, and Gross Margin
      3. 7.10.3. Product portfolio
      4. 7.10.4. Recent initiatives
    11. 7.11. Albemarle Corporation
      1. 7.11.1. Company Overview
      2. 7.11.2. Albemarle Corporation Sales, Revenue, Price, and Gross Margin
      3. 7.11.3. Product portfolio
      4. 7.11.4. Recent initiatives
    12. 7.12. Lanxess Corporation
      1. 7.12.1. Company Overview
      2. 7.12.2. Lanxess Corporation Sales, Revenue, Price, and Gross Margin
      3. 7.12.3. Product portfolio
      4. 7.12.4. Recent initiatives
    13. 7.13. Tosoh Corporation
      1. 7.13.1. Company Overview
      2. 7.13.2. Tosoh Corporation Sales, Revenue, Price, and Gross Margin
      3. 7.13.3. Product portfolio
      4. 7.13.4. Recent initiatives
    14. 7.14. Tetra Technologies Inc.
      1. 7.14.1. Company Overview
      2. 7.14.2. Tetra Technologies Inc. Sales, Revenue, Price, and Gross Margin
      3. 7.14.3. Product portfolio
      4. 7.14.4. Recent initiatives
    15. 7.15. Jordan Bromine Company Ltd.
      1. 7.15.1. Company Overview
      2. 7.15.2. Jordan Bromine Company Ltd. Sales, Revenue, Price, and Gross Margin
      3. 7.15.3. Product portfolio
      4. 7.15.4. Recent initiatives
    16. 7.16. Beacon Organosys
      1. 7.16.1. Company Overview
      2. 7.16.2. Beacon Organosys Sales, Revenue, Price, and Gross Margin
      3. 7.16.3. Product portfolio
      4. 7.16.4. Recent initiatives
    17. 7.17. Parad Chem Corporation
      1. 7.17.1. Company Overview
      2. 7.17.2. Parad Chem Corporation Sales, Revenue, Price, and Gross Margin
      3. 7.17.3. Product portfolio
      4. 7.17.4. Recent initiatives
    18. 7.18. Gulf Resources Inc.
      1. 7.18.1. Company Overview
      2. 7.18.2. Gulf Resources Inc. Sales, Revenue, Price, and Gross Margin
      3. 7.18.3. Product portfolio
      4. 7.18.4. Recent initiatives
    19. 7.19. Kingboard Chemical Holdings Limited
      1. 7.19.1. Company Overview
      2. 7.19.2. Kingboard Chemical Holdings Limited Sales, Revenue, Price, and Gross Margin
      3. 7.19.3. Product portfolio
      4. 7.19.4. Recent initiatives
    20. 7.20. Nirma Limited
      1. 7.20.1. Company Overview
      2. 7.20.2. Nirma Limited Sales, Revenue, Price, and Gross Margin
      3. 7.20.3. Product portfolio
      4. 7.20.4. Recent initiatives
  8. CHAPTER 8. Bromine Derivatives — Industry Analysis
    1. 8.1. Introduction and Taxonomy
    2. 8.2. Bromine Derivatives Market – Key Trends
      1. 8.2.1. Market Drivers
      2. 8.2.2. Market Restraints
      3. 8.2.3. Market Opportunities
    3. 8.3. Value Chain Analysis
    4. 8.4. Key Mandates and Regulations
    5. 8.5. Technology Roadmap and Timeline
    6. 8.6. Bromine Derivatives market – Attractiveness Analysis
      1. 8.6.1. By Type
      2. 8.6.2. By Application
      3. 8.6.3. By Region
  9. CHAPTER 9. Raw Material analysis
    1. 9.1. Bromine Derivatives Key Raw Material Analysis
      1. 9.1.1. Key Raw Materials
      2. 9.1.2. Price Trend of Key Raw Materials
    2. 9.2. Key Suppliers of Raw Materials
    3. 9.3. Proportion of Manufacturing Cost Structure
      1. 9.3.1. Raw Materials
      2. 9.3.2. Labor Cost
    4. 9.4. Manufacturing Expenses Analysis of Bromine Derivatives
  10. CHAPTER 10. Industrial Chain, Sourcing Strategy and Downstream Buyers
    1. 10.1. Bromine Derivatives Industrial Chain Analysis
    2. 10.2. Upstream Raw Materials Sourcing
      1. 10.2.1. Risk Mitigation:
      2. 10.2.2. Supplier Relationships:
      3. 10.2.3. Business Processes:
      4. 10.2.4. Securing the Product:
    3. 10.3. Raw Materials Sources of Bromine Derivatives Major Manufacturers in 2016
    4. 10.4. Downstream Buyers
    5. 10.5. Distributors/Traders List
  11. CHAPTER 11. Marketing Strategy Analysis, Distributors
    1. 11.1. Marketing Channel
    2. 11.2. Direct Marketing
    3. 11.3. Indirect Marketing
    4. 11.4. Marketing Channel Development Trend
    5. 11.5. Economic/Political Environmental Change
  12. CHAPTER 12. Report Conclusion
  13. CHAPTER 13. Research Approach & Methodology
    1. 13.1. Report Description
    2. 13.2. Research Scope
    3. 13.3. Research Methodology
      1. 13.3.1. Secondary Research
      2. 13.3.2. Primary Research
      3. 13.3.3. Models
        1. 13.3.3.1. Company Share Analysis Model
        2. 13.3.3.2. Revenue Based Modeling
        3. 13.3.3.3. Research Limitations

        List of Figures

        FIG. 1 Global Bromine Derivatives Market, 2016-2026 (USD Million)
        FIG. 2 Global Bromine Derivatives Market Share, by Type, 2019 & 2026 (USD Million)
        FIG. 3 Global Bromine Derivatives Market share, by Type, 2019 & 2026 (Kilo Tons)
        FIG. 4 Global Brominated Polystyrene Bromine Derivatives Market, 2016-2026 (USD Million)
        FIG. 5 Global Brominated Polystyrene Bromine Derivatives  Market, 2016-2026 (Kilo Tons)
        FIG. 6 Global Tetrabromobisphenol A  Bromine Derivatives Market, 2016-2026 (USD Million)
        FIG. 7 Global Tetrabromobisphenol A  Bromine Derivatives  Market, 2016-2026 (Kilo Tons)
        FIG. 8 Global Calcium Bromide Bromine Derivatives Market, 2016-2026 (USD Million)
        FIG. 9 Global Calcium Bromide Bromine Derivatives  Market, 2016-2026 (Kilo Tons)
        FIG. 10 Global Sodium Bromide Bromine Derivatives Market, 2016-2026 (USD Million)
        FIG. 11 Global Sodium Bromide Bromine Derivatives  Market, 2016-2026 (Kilo Tons)
        FIG. 12 Global Zinc Bromide Bromine Derivatives Market, 2016-2026 (USD Million)
        FIG. 13 Global Zinc Bromide Bromine Derivatives  Market, 2016-2026 (Kilo Tons)
        FIG. 14 Global Hydrobromic Acid Bromine Derivatives Market, 2016-2026 (USD Million)
        FIG. 15 Global Hydrobromic Acid Bromine Derivatives  Market, 2016-2026 (Kilo Tons)
        FIG. 16 Global Decabromodiphenyl Ethane Bromine Derivatives Market, 2016-2026 (USD Million)
        FIG. 17 Global Decabromodiphenyl Ethane Bromine Derivatives  Market, 2016-2026 (Kilo Tons)
        FIG. 18 Global Others Bromine Derivatives Market, 2016-2026 (USD Million)
        FIG. 19 Global Others Bromine Derivatives  Market, 2016-2026 (Kilo Tons)
        FIG. 20 Global Bromine Derivatives Market Share, by Application, 2019 & 2026 (USD Million)
        FIG. 21 Global Bromine Derivatives Market share, by Application, 2019 & 2026 (Kilo Tons)
        FIG. 22 Global Flame Retardants Bromine Derivatives Market, 2016-2026 (USD Million)
        FIG. 23 Global Flame Retardants Bromine Derivatives  Market, 2016-2026 (Kilo Tons)
        FIG. 24 Global Organic Intermediates Bromine Derivatives Market, 2016-2026 (USD Million)
        FIG. 25 Global Organic Intermediates Bromine Derivatives  Market, 2016-2026 (Kilo Tons)
        FIG. 26 Global Oil & Gas Bromine Derivatives Market, 2016-2026 (USD Million)
        FIG. 27 Global Oil & Gas Bromine Derivatives  Market, 2016-2026 (Kilo Tons)
        FIG. 28 Global Biocides Bromine Derivatives Market, 2016-2026 (USD Million)
        FIG. 29 Global Biocides Bromine Derivatives  Market, 2016-2026 (Kilo Tons)
        FIG. 30 Global PTA Synthesis Bromine Derivatives Market, 2016-2026 (USD Million)
        FIG. 31 Global PTA Synthesis Bromine Derivatives  Market, 2016-2026 (Kilo Tons)
        FIG. 32 Global Others Bromine Derivatives Market, 2016-2026 (USD Million)
        FIG. 33 Global Others Bromine Derivatives  Market, 2016-2026 (Kilo Tons)
        FIG. 34 Global Bromine Derivatives Market Share, by Region, 2019 & 2026
        FIG. 35 Global Bromine Derivatives Market Share, by Region, 2019 & 2026
        FIG. 36 North America Bromine Derivatives Market, 2016-2026
        FIG. 37 North America Bromine Derivatives  Market, 2016-2026 (Kilo Tons)
        FIG. 38 U.S. Bromine Derivatives Market, 2016-2026
        FIG. 39 U.S. Bromine Derivatives  Market, 2016-2026 (Kilo Tons)
        FIG. 40 Canada Bromine Derivatives Market, 2016-2026
        FIG. 41 Canada Bromine Derivatives  Market, 2016-2026 (Kilo Tons)
        FIG. 42 Europe Bromine Derivatives Market, 2016-2026
        FIG. 43 Europe Bromine Derivatives  Market, 2016-2026 (Kilo Tons)
        FIG. 44 Germany Bromine Derivatives Market, 2016-2026
        FIG. 45 Germany Bromine Derivatives  Market, 2016-2026 (Kilo Tons)
        FIG. 46 France Bromine Derivatives Market, 2016-2026
        FIG. 47 France Bromine Derivatives  Market, 2016-2026 (Kilo Tons)
        FIG. 48 U.K. Bromine Derivatives Market, 2016-2026
        FIG. 49 U.K. Bromine Derivatives  Market, 2016-2026 (Kilo Tons)
        FIG. 50 Italy Bromine Derivatives Market, 2016-2026
        FIG. 51 Italy Bromine Derivatives  Market, 2016-2026 (Kilo Tons)
        FIG. 52 Spain Bromine Derivatives Market, 2016-2026
        FIG. 53 Spain Bromine Derivatives  Market, 2016-2026 (Kilo Tons)
        FIG. 54 Rest of Europe Bromine Derivatives Market, 2016-2026
        FIG. 55 Rest of Europe Bromine Derivatives  Market, 2016-2026 (Kilo Tons)
        FIG. 56 Asia Pacific Bromine Derivatives Market, 2016-2026
        FIG. 57 Asia Pacific Bromine Derivatives  Market, 2016-2026 (Kilo Tons)
        FIG. 58 China Bromine Derivatives Market, 2016-2026
        FIG. 59 China Bromine Derivatives  Market, 2016-2026 (Kilo Tons)
        FIG. 60 Japan Bromine Derivatives Market, 2016-2026
        FIG. 61 Japan Bromine Derivatives  Market, 2016-2026 (Kilo Tons)
        FIG. 62 India Bromine Derivatives Market, 2016-2026
        FIG. 63 India Bromine Derivatives  Market, 2016-2026 (Kilo Tons)
        FIG. 64 South  Korea Bromine Derivatives Market, 2016-2026
        FIG. 65 South  Korea Bromine Derivatives  Market, 2016-2026 (Kilo Tons)
        FIG. 66 South-East Asia Bromine Derivatives Market, 2016-2026
        FIG. 67 South-East Asia Bromine Derivatives  Market, 2016-2026 (Kilo Tons)
        FIG. 68 Rest of Asia Pacific Bromine Derivatives Market, 2016-2026
        FIG. 69 Rest of Asia Pacific Bromine Derivatives  Market, 2016-2026 (Kilo Tons)
        FIG. 70 Latin America Bromine Derivatives Market, 2016-2026
        FIG. 71 Latin America Bromine Derivatives  Market, 2016-2026 (Kilo Tons)
        FIG. 72 Brazil Bromine Derivatives Market, 2016-2026
        FIG. 73 Brazil Bromine Derivatives  Market, 2016-2026 (Kilo Tons)
        FIG. 74 Mexico Bromine Derivatives Market, 2016-2026
        FIG. 75 Mexico Bromine Derivatives  Market, 2016-2026 (Kilo Tons)
        FIG. 76 Rest of Latin America Bromine Derivatives Market, 2016-2026
        FIG. 77 Rest of Latin America Bromine Derivatives  Market, 2016-2026 (Kilo Tons)
        FIG. 78 The Middle-East and Africa Bromine Derivatives Market, 2016-2026
        FIG. 79 The Middle-East and Africa Bromine Derivatives  Market, 2016-2026 (Kilo Tons)
        FIG. 80 GCC Countries Bromine Derivatives Market, 2016-2026
        FIG. 81 GCC Countries Bromine Derivatives  Market, 2016-2026 (Kilo Tons)
        FIG. 82 South Africa Bromine Derivatives Market, 2016-2026
        FIG. 83 South Africa Bromine Derivatives  Market, 2016-2026 (Kilo Tons)
        FIG. 84 Rest of Middle-East Africa Bromine Derivatives Market, 2016-2026
        FIG. 85 Rest of Middle-East Africa Bromine Derivatives  Market, 2016-2026 (Kilo Tons)
        FIG. 86 Global Bromine Derivatives production and revenue, 2016-2026 (USD Million) (Kilo Tons)
        FIG. 87 North America Bromine Derivatives production and revenue, 2016-2026 (USD Million) (Kilo Tons)
        FIG. 88 Europe Bromine Derivatives production and revenue, 2016-2026 (USD Million) (Kilo Tons)
        FIG. 89 Asia Pacific Bromine Derivatives production and revenue, 2016-2026 (USD Million) (Kilo Tons)
        FIG. 90 Latin America Bromine Derivatives production and revenue, 2016-2026 (USD Million) (Kilo Tons)
        FIG. 91 Middle East and Africa Bromine Derivatives production and revenue, 2016-2026 (USD Million) (Kilo Tons)
        FIG. 92 Competitor Market Share – Revenue
        FIG. 93 Competitor Market Share – Volume
        FIG. 94 Tata Chemicals Ltd. Revenue and Growth Rate
        FIG. 95 Tata Chemicals Ltd. Market Share
        FIG. 96 Honeywell International Inc. Revenue and Growth Rate
        FIG. 97 Honeywell International Inc. Market Share
        FIG. 98 Israel Chemicals Limited Revenue and Growth Rate
        FIG. 99 Israel Chemicals Limited Market Share
        FIG. 100 Hindustan Salts Ltd. Revenue and Growth Rate
        FIG. 101 Hindustan Salts Ltd. Market Share
        FIG. 102 Morre-Tec Industries, Inc. Revenue and Growth Rate
        FIG. 103 Morre-Tec Industries, Inc. Market Share
        FIG. 104 JK Chemicals Revenue and Growth Rate
        FIG. 105 JK Chemicals Market Share
        FIG. 106 ICC Industries Revenue and Growth Rate
        FIG. 107 ICC Industries Market Share
        FIG. 108 Agrocel Industries Ltd. Revenue and Growth Rate
        FIG. 109 Agrocel Industries Ltd. Market Share
        FIG. 110 Sontara Organo Industries Revenue and Growth Rate
        FIG. 111 Sontara Organo Industries Market Share
        FIG. 112 Neogen Chemicals Limited Revenue and Growth Rate
        FIG. 113 Neogen Chemicals Limited Market Share
        FIG. 114 Albemarle Corporation Revenue and Growth Rate
        FIG. 115 Albemarle Corporation Market Share
        FIG. 116 Lanxess Corporation Revenue and Growth Rate
        FIG. 117 Lanxess Corporation Market Share
        FIG. 118 Tosoh Corporation Revenue and Growth Rate
        FIG. 119 Tosoh Corporation Market Share
        FIG. 120 Tetra Technologies Inc. Revenue and Growth Rate
        FIG. 121 Tetra Technologies Inc. Market Share
        FIG. 122 Jordan Bromine Company Ltd. Revenue and Growth Rate
        FIG. 123 Jordan Bromine Company Ltd. Market Share
        FIG. 124 Beacon Organosys Revenue and Growth Rate
        FIG. 125 Beacon Organosys Market Share
        FIG. 126 Parad Chem Corporation Revenue and Growth Rate
        FIG. 127 Parad Chem Corporation Market Share
        FIG. 128 Gulf Resources Inc. Revenue and Growth Rate
        FIG. 129 Gulf Resources Inc. Market Share
        FIG. 130 Kingboard Chemical Holdings Limited Revenue and Growth Rate
        FIG. 131 Kingboard Chemical Holdings Limited Market Share
        FIG. 132 Nirma Limited Revenue and Growth Rate
        FIG. 133 Nirma Limited Market Share
        FIG. 134 Market Dynamics
        FIG. 135 Global Bromine Derivatives – Value Chain Analysis
        FIG. 136 Key Mandates and Regulations
        FIG. 137 Technology Roadmap and Timeline
        FIG. 138 Market Attractiveness Analysis – By Type
        FIG. 139 Market Attractiveness Analysis – By Application
        FIG. 140 Market Attractiveness Analysis – By Region
        FIG. 141 Manufacturing Cost Structure of Bromine Derivatives
        FIG. 142 Bromine Derivatives Industrial Chain Analysis
        FIG. 143 Market Channel
        FIG. 144 Marketing Channel Development Trend
        FIG. 145 Growth in World Gross Product, 2008-2019

        List of Tables

        TABLE 1 Global Bromine Derivatives market, 2019 & 2026 (USD Million)
        TABLE 2 Global Bromine Derivatives market, by Type, 2016-2026 (USD Million)
        TABLE 3 Global Bromine Derivatives market, by Type, 2016-2026 (Kilo Tons)
        TABLE 4 Global Bromine Derivatives market, by Application, 2016-2026 (USD Million)
        TABLE 5 Global Bromine Derivatives market, by Application, 2016-2026 (Kilo Tons)
        TABLE 6 Global Bromine Derivatives market, by region, 2016-2026 (USD Million)
        TABLE 7 Global Bromine Derivatives market, by region, 2016-2026 (Kilo Tons)
        TABLE 8 North America Bromine Derivatives Market, by Type, 2016-2026 (USD Million)
        TABLE 9 North America Bromine Derivatives Market, by Type, 2016-2026 (Kilo Tons)
        TABLE 10 North America Bromine Derivatives Market, by Application, 2016-2026 (USD Million)
        TABLE 11 North America Bromine Derivatives Market, by Application, 2016-2026 (Kilo Tons)
        TABLE 12 Europe Bromine Derivatives Market, by Type, 2016-2026 (USD Million)
        TABLE 13 Europe Bromine Derivatives Market, by Type, 2016-2026 (Kilo Tons)
        TABLE 14 Europe Bromine Derivatives Market, by Application, 2016-2026 (USD Million)
        TABLE 15 Europe Bromine Derivatives Market, by Application, 2016-2026 (Kilo Tons)
        TABLE 16 Asia Pacific Bromine Derivatives Market, by Type, 2016-2026 (USD Million)
        TABLE 17 Asia Pacific Bromine Derivatives Market, by Type, 2016-2026 (Kilo Tons)
        TABLE 18 Asia Pacific Bromine Derivatives Market, by Application, 2016-2026 (USD Million)
        TABLE 19 Asia Pacific Bromine Derivatives Market, by Application, 2016-2026 (Kilo Tons)
        TABLE 20 Latin America Bromine Derivatives Market, by Type, 2016-2026 (USD Million)
        TABLE 21 Latin America Bromine Derivatives Market, by Type, 2016-2026 (Kilo Tons)
        TABLE 22 Latin America Bromine Derivatives Market, by Application, 2016-2026 (USD Million)
        TABLE 23 Latin America Bromine Derivatives Market, by Application, 2016-2026 (Kilo Tons)
        TABLE 24 The Middle-East and Africa Bromine Derivatives Market, by Type, 2016-2026 (USD Million)
        TABLE 25 The Middle-East and Africa Bromine Derivatives Market, by Type, 2016-2026 (Kilo Tons)
        TABLE 26 The Middle-East and Africa Bromine Derivatives Market, by Application, 2016-2026 (USD Million)
        TABLE 27 The Middle-East and Africa Bromine Derivatives Market, by Application, 2016-2026 (Kilo Tons)
        TABLE 28 North America Bromine Derivatives Production, Consumption, Export, Import, 2016-2019
        TABLE 29 Europe Bromine Derivatives Production, Consumption, Export, Import, 2016-2019
        TABLE 30 Asia Pacific Bromine Derivatives Production, Consumption, Export, Import, 2016-2019
        TABLE 31 Latin America Bromine Derivatives Production, Consumption, Export, Import, 2016-2019
        TABLE 32 Middle East & Africa Bromine Derivatives Production, Consumption, Export, Import, 2016-2019
        TABLE 33 Global Bromine Derivatives Market - Company Revenue Analysis 2016-2019 (USD Million)
        TABLE 34 Global Bromine Derivatives Market - Company Revenue Share Analysis 2016-2019(%)
        TABLE 35 Global Bromine Derivatives Market - Company Volume Analysis 2016-2019 (Kilo Tons)
        TABLE 36 Global Bromine Derivatives Market - Company Volume Share Analysis 2016-2019(%)
        TABLE 37 Acquisitions and Mergers
        TABLE 38 New Product/Service Launch
        TABLE 39 Research & Development Activities
        TABLE 40 Market Drivers
        TABLE 41 Market Restraints
        TABLE 42 Market Opportunities
        TABLE 43 Production Base and Market Concentration Rate of Raw Material
        TABLE 44 Key Suppliers of Raw Materials
        TABLE 45 Raw Materials Sources of Bromine Derivatives Major Manufacturers in 2016
        TABLE 46 Major Buyers of Bromine Derivatives
        TABLE 47 Distributors/Traders of Bromine Derivatives by Region

Industry Major Market Players

  • Tata Chemicals Ltd.
  •  Honeywell International Inc.
  •  Israel Chemicals Limited
  •  Hindustan Salts Ltd.
  •  Morre-Tec Industries  Inc.
  •  JK Chemicals
  •  ICC Industries
  •  Agrocel Industries Ltd.
  •  Sontara Organo Industries
  •  Neogen Chemicals Limited
  •  Albemarle Corporation
  •  Lanxess Corporation
  •  Tosoh Corporation
  •  Tetra Technologies Inc.
  •  Jordan Bromine Company Ltd.
  •  Beacon Organosys
  •  Parad Chem Corporation
  •  Gulf Resources Inc.
  •  Kingboard Chemical Holdings Limited
  •  Nirma Limited