Search Market Research Report

Discover Our Latest Reports
Discover Our Featured Reports
Discover Top Selling Reports

Breast Cancer Treatment Market Size, Share Global Analysis Report, 2020 – 2026

report img

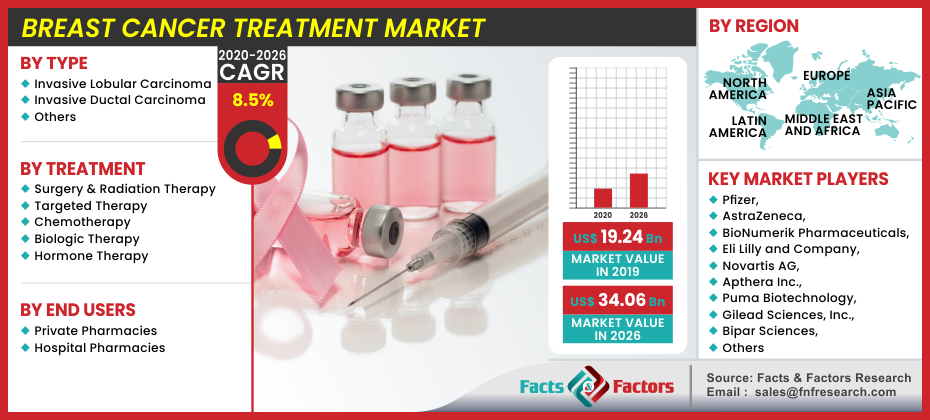
Breast Cancer Treatment Market By Types (Invasive Lobular Carcinoma, Invasive Ductal Carcinoma, and Others), by Treatment (Surgery & Radiation Therapy, Targeted Therapy, Chemotherapy, Biologic Therapy, and Hormone Therapy), End Users (Private Pharmacies, and Hospital Pharmacies): Global and Regional Industry Perspectives, Comprehensive Analysis, and Forecast 2020 – 2026

Industry Insights

[225+ Pages Report] The recent research report issued by Facts and Factors states that the global breast cancer treatment market was registered at about USD 19.24 Billion in 2019, and is expected to generate revenues worth around USD 34.06 Billion by end of 2026, effectively growing at a CAGR of around 8.5% between 2020 and 2026.

logoMarket Overview       

Breast cancer is cancer that develops in the breast tissue. Breast cancer signs include the formation of a lump in the breast and red patches on the skin. Obesity, lack of physical activity, excessive radiation exposure, and alcohol use are all risk factors for breast cancer. Breast cancer is more prevalent in developed countries than it is in developing countries.

logoIndustry Growth Factors

The rising number of females diagnosed with breast cancer is a major driver of market development. Aside from this, the demand has grown due to the acceptance of unhealthy lifestyles, an increase in the women geriatric population, exposure to toxic radiation, and increased government initiatives. Since no absolute cure exists, there is room for the industry to develop globally. On the other hand, the market's growth is being stifled by the high cost of medication, side effects associated with therapy, and the long time it takes for medications to be approved.

Breast Cancer Treatment Market

To know more about this report | Request Free Sample Copy

logoSegmentation Analysis

Invasive lobular carcinoma, invasive ductal carcinoma, and others are the three types of breast cancer that make up the global market. Surgery & radiation therapy, targeted therapy, chemotherapy, hormone therapy, biologic therapy, and others are the medication categories. Alkylating agents, antimetabolites, taxanes, and anthracyclines, are the different types of chemotherapy. Tyrosine kinase inhibitors and monoclonal antibodies are two types of target therapy, aromatase inhibitors, selective estrogen-receptor modulators and other types of hormone therapy are available. The industry is divided into three categories based on end-users: hospital pharmacies, private pharmacies, and others.

logo Regional Analysis

The global breast cancer treatment market is driven by America on a regional basis. The demand has grown as a result of changing lifestyles and the increased incidence of breast cancer in the United States. Europe is the market leader in breast cancer. The development of this market in America and Europe is due to technological advancements, increased life expectancy, and increased healthcare spending by people. The market is expected to expand at the fastest rate in the Asia Pacific. Various organizations' efforts to raise awareness, educate the masses, and raise the funds for the disease are expected to propel regional development.

logoReport Scope

Report Attribute

Details

Market Size in 2019

USD 19.24 Billion

Projected Market Size in 2026

USD 34.06 Billion

CAGR Growth Rate

8.5% CAGR

Base Year

2019

Forecast Years

2020-2026

Key Market Players

Pfizer, AstraZeneca, BioNumerik Pharmaceuticals, Eli Lilly and Company, Novartis AG, Apthera Inc., Puma Biotechnology, Gilead Sciences, Inc., Bipar Sciences, Oncogenex, Astellas, Teva Pharmaceutical Industries, Sanofi S.A., Genentech, and others.

Key Segment

By Types, By Treatment, and By Region

Major Regions Covered

North America, Europe, Asia Pacific, Latin America, and the Middle East & Africa

Purchase Options

Request customized purchase options to meet your research needs. Explore purchase options

logo Competitive Players

Key participants in breast cancer treatment market are :

  • Pfizer
  • AstraZeneca
  • BioNumerik Pharmaceuticals
  • Eli Lilly and Company
  • Novartis AG
  • Apthera Inc.
  • Puma Biotechnology
  • Gilead Sciences Inc.
  • Bipar Sciences
  • Oncogenex
  • Astellas
  • Teva Pharmaceutical Industries
  • Sanofi S.A.
  • Genentech

logo Type Segment Analysis

  • Invasive Lobular Carcinoma
  • Invasive Ductal Carcinoma
  • Others

logo Treatment Segment Analysis

  • Surgery & Radiation Therapy
  • Targeted Therapy
  • Chemotherapy
  • Biologic Therapy
  • Hormone Therapy

logo End Users Segment Analysis

  • Private Pharmacies
  • Hospital Pharmacies

logo Regional Segment Analysis

  • North America
    • U.S.
    • Canada
  • Europe
    • UK
    • France
    • Germany
    • Italy
    • Spain
    • Rest of Europe
  • Asia Pacific
    • China
    • Japan
    • India
    • South Korea
    • Southeast Asia
    • Rest of Asia Pacific
  • Latin America
    • Brazil
    • Mexico
    • Rest of Latin America
  • Middle East and Africa
    • GCC Countries
    • South Africa
    • Rest of MEA

Table of Content

  1. Chapter 1 Executive Summary
    1. 1.1. Introduction of Breast Cancer
    2. 1.2. Global Breast Cancer Treatment Market, 2019 & 2026 (USD Million)
    3. 1.3. Global Breast Cancer Treatment Market, 2016 – 2026 (USD Million)
    4. 1.4. Global Breast Cancer Treatment Market Absolute Revenue Opportunity, 2016 – 2026 (USD Million)
    5. 1.5. Global Breast Cancer Treatment Market Incremental Revenue Opportunity, 2020 – 2026 (USD Million)
  2. Chapter 2 Breast Cancer Treatment Market – Types Analysis
    1. 2.1. Global Breast Cancer Treatment Market – Types Overview
    2. 2.2. Global Breast Cancer Treatment Market Share, by Types, 2019 & 2026 (USD Million)
    3. 2.3. Invasive Lobular Carcinoma
      1. 2.3.1. Global Invasive Lobular Carcinoma Breast Cancer Treatment Market, 2016 – 2026 (USD Million)
    4. 2.4. Invasive Ductal Carcinoma
      1. 2.4.1. Global Invasive Ductal Carcinoma Breast Cancer Treatment Market, 2016 – 2026 (USD Million)
    5. 2.5. Others
      1. 2.5.1. Global Others Breast Cancer Treatment Market, 2016 – 2026 (USD Million)
  3. Chapter 3 Breast Cancer Treatment Market – Treatment Analysis
    1. 3.1. Global Breast Cancer Treatment Market – Treatment Overview
    2. 3.2. Global Breast Cancer Treatment Market Share, by Treatment, 2019 & 2026 (USD Million)
    3. 3.3. Surgery & Radiation Therapy
      1. 3.3.1. Global Surgery & Radiation Therapy Breast Cancer Treatment Market, 2016 – 2026 (USD Million)
    4. 3.4. Targeted Therapy
      1. 3.4.1. Global Targeted Therapy Breast Cancer Treatment Market, 2016 – 2026 (USD Million)
    5. 3.5. Chemotherapy
      1. 3.5.1. Global Chemotherapy Breast Cancer Treatment Market, 2016 – 2026 (USD Million)
    6. 3.6. Biologic Therapy
      1. 3.6.1. Global Biologic Therapy Breast Cancer Treatment Market, 2016 – 2026 (USD Million)
    7. 3.7. Hormone Therapy
      1. 3.7.1. Global Hormone Therapy Breast Cancer Treatment Market, 2016 – 2026 (USD Million)
  4. Chapter 4 Breast Cancer Treatment Market – End Users Analysis
    1. 4.1. Global Breast Cancer Treatment Market – End Users Overview
    2. 4.2. Global Breast Cancer Treatment Market Share, by End Users, 2019 & 2026 (USD Million)
    3. 4.3. Private Pharmacies
      1. 4.3.1. Global Private Pharmacies Breast Cancer Treatment Market, 2016 – 2026 (USD Million)
    4. 4.4. Hospital Pharmacies
      1. 4.4.1. Global Hospital Pharmacies Breast Cancer Treatment Market, 2016 – 2026 (USD Million)
  5. Chapter 5 Breast Cancer Treatment Market – Regional Analysis
    1. 5.1. Global Breast Cancer Treatment Market Regional Overview
    2. 5.2. Global Breast Cancer Treatment Market Share, by Region, 2019 & 2026 (USD Million)
    3. 5.3. North America
      1. 5.3.1. North America Breast Cancer Treatment Market, 2016 – 2026 (USD Million)
        1. 5.3.1.1. North America Breast Cancer Treatment Market, by Country, 2016 - 2026 (USD Million)
      2. 5.3.2. North America Breast Cancer Treatment Market, by Types, 2016 – 2026
        1. 5.3.2.1. North America Breast Cancer Treatment Market, by Types, 2016 – 2026 (USD Million)
      3. 5.3.3. North America Breast Cancer Treatment Market, by Treatment, 2016 – 2026
        1. 5.3.3.1. North America Breast Cancer Treatment Market, by Treatment, 2016 – 2026 (USD Million)
      4. 5.3.4. North America Breast Cancer Treatment Market, by End Users, 2016 – 2026
        1. 5.3.4.1. North America Breast Cancer Treatment Market, by End Users, 2016 – 2026 (USD Million)
      5. 5.3.5. U.S.
        1. 5.3.5.1. U.S. Breast Cancer Treatment Market, 2016 – 2026 (USD Million)
      6. 5.3.6. Canada
        1. 5.3.6.1. Canada Breast Cancer Treatment Market, 2016 – 2026 (USD Million)
    4. 5.4. Europe
      1. 5.4.1. Europe Breast Cancer Treatment Market, 2016 – 2026 (USD Million)
        1. 5.4.1.1. Europe Breast Cancer Treatment Market, by Country, 2016 - 2026 (USD Million)
      2. 5.4.2. Europe Breast Cancer Treatment Market, by Types, 2016 – 2026
        1. 5.4.2.1. Europe Breast Cancer Treatment Market, by Types, 2016 – 2026 (USD Million)
      3. 5.4.3. Europe Breast Cancer Treatment Market, by Treatment, 2016 – 2026
        1. 5.4.3.1. Europe Breast Cancer Treatment Market, by Treatment, 2016 – 2026 (USD Million)
      4. 5.4.4. Europe Breast Cancer Treatment Market, by End Users, 2016 – 2026
        1. 5.4.4.1. Europe Breast Cancer Treatment Market, by End Users, 2016 – 2026 (USD Million)
      5. 5.4.5. Germany
        1. 5.4.5.1. Germany Breast Cancer Treatment Market, 2016 – 2026 (USD Million)
      6. 5.4.6. France
        1. 5.4.6.1. France Breast Cancer Treatment Market, 2016 – 2026 (USD Million)
      7. 5.4.7. U.K.
        1. 5.4.7.1. U.K. Breast Cancer Treatment Market, 2016 – 2026 (USD Million)
      8. 5.4.8. Italy
        1. 5.4.8.1. Italy Breast Cancer Treatment Market, 2016 – 2026 (USD Million)
      9. 5.4.9. Spain
        1. 5.4.9.1. Spain Breast Cancer Treatment Market, 2016 – 2026 (USD Million)
      10. 5.4.10. Rest of Europe
        1. 5.4.10.1. Rest of Europe Breast Cancer Treatment Market, 2016 – 2026 (USD Million)
    5. 5.5. Asia Pacific
      1. 5.5.1. Asia Pacific Breast Cancer Treatment Market, 2016 – 2026 (USD Million)
        1. 5.5.1.1. Asia Pacific Breast Cancer Treatment Market, by Country, 2016 - 2026 (USD Million)
      2. 5.5.2. Asia Pacific Breast Cancer Treatment Market, by Types, 2016 – 2026
        1. 5.5.2.1. Asia Pacific Breast Cancer Treatment Market, by Types, 2016 – 2026 (USD Million)
      3. 5.5.3. Asia Pacific Breast Cancer Treatment Market, by Treatment, 2016 – 2026
        1. 5.5.3.1. Asia Pacific Breast Cancer Treatment Market, by Treatment, 2016 – 2026 (USD Million)
      4. 5.5.4. Asia Pacific Breast Cancer Treatment Market, by End Users, 2016 – 2026
        1. 5.5.4.1. Asia Pacific Breast Cancer Treatment Market, by End Users, 2016 – 2026 (USD Million)
      5. 5.5.5. China
        1. 5.5.5.1. China Breast Cancer Treatment Market, 2016 – 2026 (USD Million)
      6. 5.5.6. Japan
        1. 5.5.6.1. Japan Breast Cancer Treatment Market, 2016 – 2026 (USD Million)
      7. 5.5.7. India
        1. 5.5.7.1. India Breast Cancer Treatment Market, 2016 – 2026 (USD Million)
      8. 5.5.8. South Korea
        1. 5.5.8.1. South Korea Breast Cancer Treatment Market, 2016 – 2026 (USD Million)
      9. 5.5.9. South-East Asia
        1. 5.5.9.1. South-East Asia Breast Cancer Treatment Market, 2016 – 2026 (USD Million)
      10. 5.5.10. Rest of Asia Pacific
        1. 5.5.10.1. Rest of Asia Pacific Breast Cancer Treatment Market, 2016 – 2026 (USD Million)
    6. 5.6. Latin America
      1. 5.6.1. Latin America Breast Cancer Treatment Market, 2016 – 2026 (USD Million)
        1. 5.6.1.1. Latin America Breast Cancer Treatment Market, by Country, 2016 - 2026 (USD Million)
      2. 5.6.2. Latin America Breast Cancer Treatment Market, by Types, 2016 – 2026
        1. 5.6.2.1. Latin America Breast Cancer Treatment Market, by Types, 2016 – 2026 (USD Million)
      3. 5.6.3. Latin America Breast Cancer Treatment Market, by Treatment, 2016 – 2026
        1. 5.6.3.1. Latin America Breast Cancer Treatment Market, by Treatment, 2016 – 2026 (USD Million)
      4. 5.6.4. Latin America Breast Cancer Treatment Market, by End Users, 2016 – 2026
        1. 5.6.4.1. Latin America Breast Cancer Treatment Market, by End Users, 2016 – 2026 (USD Million)
      5. 5.6.5. Brazil
        1. 5.6.5.1. Brazil Breast Cancer Treatment Market, 2016 – 2026 (USD Million)
      6. 5.6.6. Mexico
        1. 5.6.6.1. Mexico Breast Cancer Treatment Market, 2016 – 2026 (USD Million)
      7. 5.6.7. Rest of Latin America
        1. 5.6.7.1. Rest of Latin America Breast Cancer Treatment Market, 2016 – 2026 (USD Million)
    7. 5.7. The Middle-East and Africa
      1. 5.7.1. The Middle-East and Africa Breast Cancer Treatment Market, 2016 – 2026 (USD Million)
        1. 5.7.1.1. The Middle-East and Africa Breast Cancer Treatment Market, by Country, 2016 - 2026 (USD Million)
      2. 5.7.2. The Middle-East and Africa Breast Cancer Treatment Market, by Types, 2016 – 2026
        1. 5.7.2.1. The Middle-East and Africa Breast Cancer Treatment Market, by Types, 2016 – 2026 (USD Million)
      3. 5.7.3. The Middle-East and Africa Breast Cancer Treatment Market, by Treatment, 2016 – 2026
        1. 5.7.3.1. The Middle-East and Africa Breast Cancer Treatment Market, by Treatment, 2016 – 2026 (USD Million)
      4. 5.7.4. The Middle-East and Africa Breast Cancer Treatment Market, by End Users, 2016 – 2026
        1. 5.7.4.1. The Middle-East and Africa Breast Cancer Treatment Market, by End Users, 2016 – 2026 (USD Million)
      5. 5.7.5. GCC Countries
        1. 5.7.5.1. GCC Countries Breast Cancer Treatment Market, 2016 – 2026 (USD Million)
      6. 5.7.6. South Africa
        1. 5.7.6.1. South Africa Breast Cancer Treatment Market, 2016 – 2026 (USD Million)
      7. 5.7.7. Rest of Middle-East Africa
        1. 5.7.7.1. Rest of Middle-East Africa Breast Cancer Treatment Market, 2016 – 2026 (USD Million)
  6. Chapter 6 Breast Cancer Treatment Market – Competitive Landscape
    1. 6.1. Competitor Market Share – Revenue
    2. 6.2. Market Concentration Rate Analysis, Top 3 and Top 5 Players
    3. 6.3. Strategic Developments
      1. 6.3.1. Acquisitions and Mergers
      2. 6.3.2. New Products
      3. 6.3.3. Research & Development Activities
  7. Chapter 7 Company Profiles
    1. 7.1. Pfizer
      1. 7.1.1. Company Overview
      2. 7.1.2. Product/Service Portfolio
      3. 7.1.3. Pfizer Sales, Revenue, and Gross Margin
      4. 7.1.4. Pfizer Revenue and Growth Rate
      5. 7.1.5. Pfizer Market Share
      6. 7.1.6. Recent Initiatives, Funding/VC Activities, and Technological Innovations
    2. 7.2. AstraZeneca
      1. 7.2.1. Company Overview
      2. 7.2.2. Product/Service Portfolio
      3. 7.2.3. AstraZeneca Sales, Revenue, and Gross Margin
      4. 7.2.4. AstraZeneca Revenue and Growth Rate
      5. 7.2.5. AstraZeneca Market Share
      6. 7.2.6. Recent Initiatives, Funding/VC Activities, and Technological Innovations
    3. 7.3. BioNumerik Pharmaceuticals
      1. 7.3.1. Company Overview
      2. 7.3.2. Product/Service Portfolio
      3. 7.3.3. BioNumerik Pharmaceuticals Sales, Revenue, and Gross Margin
      4. 7.3.4. BioNumerik Pharmaceuticals Revenue and Growth Rate
      5. 7.3.5. BioNumerik Pharmaceuticals Market Share
      6. 7.3.6. Recent Initiatives, Funding/VC Activities, and Technological Innovations
    4. 7.4. Eli Lilly and Company
      1. 7.4.1. Company Overview
      2. 7.4.2. Product/Service Portfolio
      3. 7.4.3. Eli Lilly and Company Sales, Revenue, and Gross Margin
      4. 7.4.4. Eli Lilly and Company Revenue and Growth Rate
      5. 7.4.5. Eli Lilly and Company Market Share
      6. 7.4.6. Recent Initiatives, Funding/VC Activities, and Technological Innovations
    5. 7.5. Novartis AG
      1. 7.5.1. Company Overview
      2. 7.5.2. Product/Service Portfolio
      3. 7.5.3. Novartis AG Sales, Revenue, and Gross Margin
      4. 7.5.4. Novartis AG Revenue and Growth Rate
      5. 7.5.5. Novartis AG Market Share
      6. 7.5.6. Recent Initiatives, Funding/VC Activities, and Technological Innovations
    6. 7.6. Apthera Inc.
      1. 7.6.1. Company Overview
      2. 7.6.2. Product/Service Portfolio
      3. 7.6.3. Apthera Inc. Sales, Revenue, and Gross Margin
      4. 7.6.4. Apthera Inc. Revenue and Growth Rate
      5. 7.6.5. Apthera Inc. Market Share
      6. 7.6.6. Recent Initiatives, Funding/VC Activities, and Technological Innovations
    7. 7.7. Puma Biotechnology
      1. 7.7.1. Company Overview
      2. 7.7.2. Product/Service Portfolio
      3. 7.7.3. Puma Biotechnology Sales, Revenue, and Gross Margin
      4. 7.7.4. Puma Biotechnology Revenue and Growth Rate
      5. 7.7.5. Puma Biotechnology Market Share
      6. 7.7.6. Recent Initiatives, Funding/VC Activities, and Technological Innovations
    8. 7.8. Gilead Sciences
      1. 7.8.1. Company Overview
      2. 7.8.2. Product/Service Portfolio
      3. 7.8.3. Gilead Sciences Sales, Revenue, and Gross Margin
      4. 7.8.4. Gilead Sciences Revenue and Growth Rate
      5. 7.8.5. Gilead Sciences Market Share
      6. 7.8.6. Recent Initiatives, Funding/VC Activities, and Technological Innovations
      7. 7.9. Inc.
      8. 7.9.1. Company Overview
      9. 7.9.2. Product/Service Portfolio
        1. 7.9.3. Inc. Sales, Revenue, and Gross Margin
        2. 7.9.4. Inc. Revenue and Growth Rate
        3. 7.9.5. Inc. Market Share
      10. 7.9.6. Recent Initiatives, Funding/VC Activities, and Technological Innovations
    9. 7.10. Bipar Sciences
      1. 7.10.1. Company Overview
      2. 7.10.2. Product/Service Portfolio
      3. 7.10.3. Bipar Sciences Sales, Revenue, and Gross Margin
      4. 7.10.4. Bipar Sciences Revenue and Growth Rate
      5. 7.10.5. Bipar Sciences Market Share
      6. 7.10.6. Recent Initiatives, Funding/VC Activities, and Technological Innovations
    10. 7.11. Oncogenex
      1. 7.11.1. Company Overview
      2. 7.11.2. Product/Service Portfolio
      3. 7.11.3. Oncogenex Sales, Revenue, and Gross Margin
      4. 7.11.4. Oncogenex Revenue and Growth Rate
      5. 7.11.5. Oncogenex Market Share
      6. 7.11.6. Recent Initiatives, Funding/VC Activities, and Technological Innovations
    11. 7.12. Astellas
      1. 7.12.1. Company Overview
      2. 7.12.2. Product/Service Portfolio
      3. 7.12.3. Astellas Sales, Revenue, and Gross Margin
      4. 7.12.4. Astellas Revenue and Growth Rate
      5. 7.12.5. Astellas Market Share
      6. 7.12.6. Recent Initiatives, Funding/VC Activities, and Technological Innovations
    12. 7.13. Teva Pharmaceutical Industries
      1. 7.13.1. Company Overview
      2. 7.13.2. Product/Service Portfolio
      3. 7.13.3. Teva Pharmaceutical Industries Sales, Revenue, and Gross Margin
      4. 7.13.4. Teva Pharmaceutical Industries Revenue and Growth Rate
      5. 7.13.5. Teva Pharmaceutical Industries Market Share
      6. 7.13.6. Recent Initiatives, Funding/VC Activities, and Technological Innovations
    13. 7.14. Sanofi S.A.
      1. 7.14.1. Company Overview
      2. 7.14.2. Product/Service Portfolio
      3. 7.14.3. Sanofi S.A. Sales, Revenue, and Gross Margin
      4. 7.14.4. Sanofi S.A. Revenue and Growth Rate
      5. 7.14.5. Sanofi S.A. Market Share
      6. 7.14.6. Recent Initiatives, Funding/VC Activities, and Technological Innovations
    14. 7.15. Genentech
      1. 7.15.1. Company Overview
      2. 7.15.2. Product/Service Portfolio
      3. 7.15.3. Genentech Sales, Revenue, and Gross Margin
      4. 7.15.4. Genentech Revenue and Growth Rate
      5. 7.15.5. Genentech Market Share
      6. 7.15.6. Recent Initiatives, Funding/VC Activities, and Technological Innovations
  8. Chapter 8 Breast Cancer — Industry Analysis
    1. 8.1. Introduction and Taxonomy
    2. 8.2. Breast Cancer Treatment Market – Key Trends
      1. 8.2.1. Market Drivers
      2. 8.2.2. Market Restraints
      3. 8.2.3. Market Opportunities
    3. 8.3. Value Chain Analysis
    4. 8.4. Key Mandates and Regulations
    5. 8.5. Technology Roadmap and Timeline
    6. 8.6. Breast Cancer Treatment Market – Attractiveness Analysis
      1. 8.6.1. By Types
      2. 8.6.2. By Treatment
      3. 8.6.3. By End Users
      4. 8.6.4. By Region
  9. Chapter 9 Industrial Chain, Sourcing Strategy, and Downstream Buyers
    1. 9.1. Breast Cancer Industrial Chain Analysis
    2. 9.2. Downstream Buyers
    3. 9.3. Distributors/Traders List
  10. Chapter 10 Marketing Strategy Analysis
    1. 10.1. Marketing Channel
    2. 10.2. Direct Marketing
    3. 10.3. Indirect Marketing
    4. 10.4. Marketing Channel Development Trends
    5. 10.5. Economic/Political Environmental Change
  11. Chapter 11 Report Conclusion & Key Insights
    1. 11.1. Key Insights from Primary Interviews & Surveys Respondents
    2. 11.2. Key Takeaways from Analysts, Consultants, and Industry Leaders
  12. Chapter 12 Research Approach & Methodology
    1. 12.1. Report Description
    2. 12.2. Research Scope
    3. 12.3. Research Methodology
      1. 12.3.1. Secondary Research
      2. 12.3.2. Primary Research
      3. 12.3.3. Statistical Models
        1. 12.3.3.1. Company Share Analysis Model
        2. 12.3.3.2. Revenue Based Modeling
      4. 12.3.4. Research Limitations

      List of Figures

      Fig.1	Product Picture of Breast Cancer
      Fig.2	Global Breast Cancer Treatment Market, 2016 – 2026 (USD Million)
      Fig.3	Global Breast Cancer Treatment Market Absolute Revenue Opportunity, 2016 – 2026 (USD Million)
      Fig.4	Global Breast Cancer Treatment Market Incremental Revenue Opportunity, 2020 – 2026 (USD Million)
      Fig.5	Global Breast Cancer Treatment Market Share, by Types, 2019 & 2026 (USD Million)
      Fig.6	Global Invasive Lobular Carcinoma Breast Cancer Treatment Market, 2016 – 2026 (USD Million)
      Fig.7	Global Invasive Ductal Carcinoma Breast Cancer Treatment Market, 2016 – 2026 (USD Million)
      Fig.8	Global Others Breast Cancer Treatment Market, 2016 – 2026 (USD Million)
      Fig.9	Global Breast Cancer Treatment Market Share, by  Treatment, 2019 & 2026 (USD Million)
      Fig.10	Global Surgery & Radiation Therapy Breast Cancer Treatment Market, 2016 – 2026 (USD Million)
      Fig.11	Global Targeted Therapy Breast Cancer Treatment Market, 2016 – 2026 (USD Million)
      Fig.12	Global Chemotherapy Breast Cancer Treatment Market, 2016 – 2026 (USD Million)
      Fig.13	Global Biologic Therapy Breast Cancer Treatment Market, 2016 – 2026 (USD Million)
      Fig.14	Global Hormone Therapy Breast Cancer Treatment Market, 2016 – 2026 (USD Million)
      Fig.15	Global Breast Cancer Treatment Market Share, by End Users, 2019 & 2026 (USD Million)
      Fig.16	Global Private Pharmacies Breast Cancer Treatment Market, 2016 – 2026 (USD Million)
      Fig.17	Global Hospital Pharmacies Breast Cancer Treatment Market, 2016 – 2026 (USD Million)
      Fig.18	Global Breast Cancer Treatment Market Share, by Region, 2019 & 2026 (USD Million)
      Fig.19	North America Breast Cancer Treatment Market, 2016 – 2026 (USD Million)
      Fig.20	U.S. Breast Cancer Treatment Market, 2016 – 2026 (USD Million)
      Fig.21	Canada Breast Cancer Treatment Market, 2016 – 2026 (USD Million)
      Fig.22	Europe Breast Cancer Treatment Market, 2016 – 2026 (USD Million)
      Fig.23	Germany Breast Cancer Treatment Market, 2016 – 2026 (USD Million)
      Fig.24	France Breast Cancer Treatment Market, 2016 – 2026 (USD Million)
      Fig.25	U.K. Breast Cancer Treatment Market, 2016 – 2026 (USD Million)
      Fig.26	Italy Breast Cancer Treatment Market, 2016 – 2026 (USD Million)
      Fig.27	Spain Breast Cancer Treatment Market, 2016 – 2026 (USD Million)
      Fig.28	Rest of Europe Breast Cancer Treatment Market, 2016 – 2026 (USD Million)
      Fig.29	Asia Pacific Breast Cancer Treatment Market, 2016 – 2026 (USD Million)
      Fig.30	China Breast Cancer Treatment Market, 2016 – 2026 (USD Million)
      Fig.31	Japan Breast Cancer Treatment Market, 2016 – 2026 (USD Million)
      Fig.32	India Breast Cancer Treatment Market, 2016 – 2026 (USD Million)
      Fig.33	South  Korea Breast Cancer Treatment Market, 2016 – 2026 (USD Million)
      Fig.34	South-East Asia Breast Cancer Treatment Market, 2016 – 2026 (USD Million)
      Fig.35	Rest of Asia Pacific Breast Cancer Treatment Market, 2016 – 2026 (USD Million)
      Fig.36	Latin America Breast Cancer Treatment Market, 2016 – 2026 (USD Million)
      Fig.37	Brazil Breast Cancer Treatment Market, 2016 – 2026 (USD Million)
      Fig.38	Mexico Breast Cancer Treatment Market, 2016 – 2026 (USD Million)
      Fig.39	Rest of Latin America Breast Cancer Treatment Market, 2016 – 2026 (USD Million)
      Fig.40	The Middle-East and Africa Breast Cancer Treatment Market, 2016 – 2026 (USD Million)
      Fig.41	GCC Countries Breast Cancer Treatment Market, 2016 – 2026 (USD Million)
      Fig.42	South Africa Breast Cancer Treatment Market, 2016 – 2026 (USD Million)
      Fig.43	Rest of Middle-East Africa Breast Cancer Treatment Market, 2016 – 2026 (USD Million)
      Fig.44	Competitor Market Share – Revenue
      Fig.45	Pfizer Revenue and Growth Rate
      Fig.46	Pfizer Market Share
      Fig.47	AstraZeneca Revenue and Growth Rate
      Fig.48	AstraZeneca Market Share
      Fig.49	BioNumerik Pharmaceuticals Revenue and Growth Rate
      Fig.50	BioNumerik Pharmaceuticals Market Share
      Fig.51	Eli Lilly and Company Revenue and Growth Rate
      Fig.52	Eli Lilly and Company Market Share
      Fig.53	Novartis AG Revenue and Growth Rate
      Fig.54	Novartis AG Market Share
      Fig.55	Apthera Inc. Revenue and Growth Rate
      Fig.56	Apthera Inc. Market Share
      Fig.57	Puma Biotechnology Revenue and Growth Rate
      Fig.58	Puma Biotechnology Market Share
      Fig.59	Gilead Sciences Revenue and Growth Rate
      Fig.60	Gilead Sciences Market Share
      Fig.61	Inc. Revenue and Growth Rate
      Fig.62	Inc. Market Share
      Fig.63	Bipar Sciences Revenue and Growth Rate
      Fig.64	Bipar Sciences Market Share
      Fig.65	Oncogenex Revenue and Growth Rate
      Fig.66	Oncogenex Market Share
      Fig.67	Astellas Revenue and Growth Rate
      Fig.68	Astellas Market Share
      Fig.69	Teva Pharmaceutical Industries Revenue and Growth Rate
      Fig.70	Teva Pharmaceutical Industries Market Share
      Fig.71	Sanofi S.A. Revenue and Growth Rate
      Fig.72	Sanofi S.A. Market Share
      Fig.73	Genentech Revenue and Growth Rate
      Fig.74	Genentech Market Share
      Fig.75	Market Dynamics
      Fig.76	Global Breast Cancer – Value Chain Analysis
      Fig.77	Key Mandates and Regulations
      Fig.78	Technology Roadmap and Timeline
      Fig.79	Market Attractiveness Analysis – By Types
      Fig.80	Market Attractiveness Analysis – By  Treatment
      Fig.81	Market Attractiveness Analysis – By End Users
      Fig.82	Market Attractiveness Analysis – By Region
      Fig.83	Breast Cancer Industrial Chain Analysis
      Fig.84	Market Channels
      Fig.85	Marketing Channel Development Trend
      Fig.86	Growth in World Gross Product, 2008-2018
      

      List of Tables

      Table 1	Global Breast Cancer Treatment Market, 2019 & 2026 (USD Million)
      Table 2	Global Breast Cancer Treatment Market, by Types, 2016 – 2026 (USD Million)
      Table 3	Global Breast Cancer Treatment Market, by  Treatment, 2016 – 2026 (USD Million)
      Table 4	Global Breast Cancer Treatment Market, by End Users, 2016 – 2026 (USD Million)
      Table 5	Global Breast Cancer Treatment Market, by Region, 2016 – 2026 (USD Million)
      Table 6	North America Breast Cancer Treatment Market, by Country, 2016 – 2026 (USD Million)
      Table 7	North America Breast Cancer Treatment Market, by Types, 2016 – 2026 (USD Million)
      Table 8	North America Breast Cancer Treatment Market, by  Treatment, 2016 – 2026 (USD Million)
      Table 9 North America Breast Cancer Treatment Market, by End Users, 2016 – 2026 (USD Million)
      Table 10 Europe Breast Cancer Treatment Market, by Country, 2016 – 2026 (USD Million)
      Table 11 Europe Breast Cancer Treatment Market, by Types, 2016 – 2026 (USD Million)
      Table 12 Europe Breast Cancer Treatment Market, by  Treatment, 2016 – 2026 (USD Million)
      Table 13 Europe Breast Cancer Treatment Market, by End Users, 2016 – 2026 (USD Million)
      Table 14 Asia Pacific Breast Cancer Treatment Market, by Country, 2016 – 2026 (USD Million)
      Table 15 Asia Pacific Breast Cancer Treatment Market, by Types, 2016 – 2026 (USD Million)
      Table 16 Asia Pacific Breast Cancer Treatment Market, by  Treatment, 2016 – 2026 (USD Million)
      Table 17 Asia Pacific Breast Cancer Treatment Market, by End Users, 2016 – 2026 (USD Million)
      Table 18 Latin America Breast Cancer Treatment Market, by Country, 2016 – 2026 (USD Million)
      Table 19 Latin America Breast Cancer Treatment Market, by Types, 2016 – 2026 (USD Million)
      Table 20 Latin America Breast Cancer Treatment Market, by  Treatment, 2016 – 2026 (USD Million)
      Table 21 Latin America Breast Cancer Treatment Market, by End Users, 2016 – 2026 (USD Million)
      Table 22 The Middle-East and Africa Breast Cancer Treatment Market, by Country, 2016 – 2026 (USD Million)
      Table 23 The Middle-East and Africa Breast Cancer Treatment Market, by Types, 2016 – 2026 (USD Million)
      Table 24 The Middle-East and Africa Breast Cancer Treatment Market, by  Treatment, 2016 – 2026 (USD Million)
      Table 25 The Middle-East and Africa Breast Cancer Treatment Market, by End Users, 2016 – 2026 (USD Million)
      Table 26 Global Breast Cancer Treatment Market - Company Revenue Analysis, 2016 – 2019 (USD Million)
      Table 27 Global Breast Cancer Treatment Market - Company Revenue Share Analysis, 2016 – 2019 (%)
      Table 28 Acquisitions and Mergers
      Table 29 Market Drivers – Impact Analysis
      Table 30 Market Restraints
      Table 31 Market Opportunities
      Table 32 Major Buyers of Breast Cancer
      Table 33 Distributors/Traders of Breast Cancer by Region
      

Industry Major Market Players

  • Pfizer
  • AstraZeneca
  • BioNumerik Pharmaceuticals
  • Eli Lilly and Company
  • Novartis AG
  • Apthera Inc.
  • Puma Biotechnology
  • Gilead Sciences Inc.
  • Bipar Sciences
  • Oncogenex
  • Astellas
  • Teva Pharmaceutical Industries
  • Sanofi S.A.
  • Genentech