Search Market Research Report

Discover Our Latest Reports
Discover Our Featured Reports
Discover Top Selling Reports

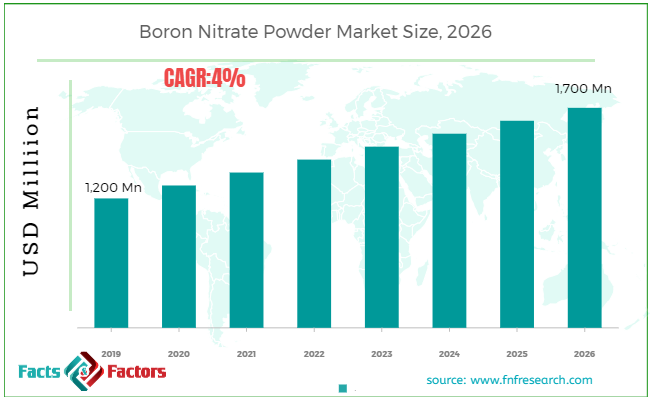
Boron Nitrate Powder Market Size, Share Global Analysis Report, 2020–2026

report img

Boron Nitrate Powder Market By Form (Amorphous Form, Hexagonal Form, Cubic Form, Wurtzite Form) And By Application (Coatings & Mold Release, Composites, Electrical Insulation, Lubrication, Mechanical Tools, Paints, Personal Care, Thermal Spray, Others): Global Industry Outlook, Market Size, Business Intelligence, Consumer Preferences, Statistical Surveys, Comprehensive Analysis, Historical Developments, Current Trends, and Forecast 2020–2026

Industry Insights

[185+ Pages Report] According to the report published by Facts Factors, the global boron nitrate powder market size was worth around USD 1,200 million in 2019 and is predicted to grow to around USD 1,700 million by 2026 with a compound annual growth rate (CAGR) of roughly 4% between 2020 and 2026. The report analyzes the global boron nitrate powder market drivers, restraints/challenges, and the effect they have on the demands during the projection period. In addition, the report explores emerging opportunities in the boron nitrate powder market.

The boron nitrate powder market report analyzes and notifies the industry statistics at the global as well as regional and country levels in order to acquire a thorough perspective of the entire Boron Nitrate Powder market. The historical and past insights are provided for FY 2016 to FY 2019 whereas projected trends are delivered for FY 2020 to FY 2026. The quantitative and numerical data is represented in terms of both volume (Tons) and value (USD Million) from FY 2016 – 2026.

Boron Nitrate Powder Market Size

To know more about this report | Request Free Sample Copy


logoKey Insights from Primary Research

  • As per the analysis shared by our primary respondents, the Boron Powder Nitrate is expected to grow annually at a CAGR of around 4%.
  • Through the primary research, it was established that the Boron Powder Nitrate market is valued at around USD 1200 Million in 2019.
  • Based on form segmentation, the Hexagonal Form was predicted to show maximum market share in the year 2019.
  • The coating category, based on application segmentation, was the leading revenue-generating 2019.
  • On the basis of region, the “Asia Pacific” region was the leading revenue generator in 2019.

logoKey Recommendations from Analysts

  • As per our analysts, the boron nitrate powder market demand is accelerating owing to its numerous benefits such as corrosion and temperature resistance along with high oxidation resistance.
  • The availability of boron nitrate in various forms makes it useful for various appliances.
  • Growing at a CAGR around 4%, the boron nitrate powder market provides numerous growth possibilities for all of the involved stockholders across the entire value chain.
  • The growing use of ceramic in various industries such as construction, home appliances, interior design makes it an ideal choice for most key players of the industry.
  • Our analysts have identified the “mechanical tools” category as the leading investment pocket for the boron nitrate powder market in terms of application segmentation respectively.

The quantitative data is further underlined and reinforced by comprehensive qualitative data which comprises various across-the-board market dynamics. The rationales which directly or indirectly impact the Boron Nitrate Powder industry are exemplified through parameters such as growth drivers, restraints, challenges, and opportunities among other impacting factors.

Throughout our research report, we have encompassed all the proven models and tools of industry analysis and extensively illustrated all the key business strategies and business models adopted in the Boron Nitrate Powder industry. The report provides an all-inclusive and detailed competitive landscape prevalent in the Boron Nitrate Powder market.

The report utilizes established industry analysis tools and models such as Porter’s Five Forces framework to analyze and recognize critical business strategies adopted by various stakeholders involved in the entire value chain of the Boron Nitrate Powder industry. The Boron Nitrate Powder market report additionally employs SWOT analysis and PESTLE analysis models for further in-depth analysis.

The report study further includes an in-depth analysis of industry players' market shares and provides an overview of leading players' market position in the Boron Nitrate Powder sector. Key strategic developments in the Boron Nitrate Powder market competitive landscape such as acquisitions & mergers, inaugurations of different products and services, partnerships & joint ventures, MoU agreements, VC & funding activities, R&D activities, and geographic expansion among other noteworthy activities by key players of the Boron Nitrate Powder market are appropriately highlighted in the report.

Boron Nitrate is an inorganic compound that is available in various forms and it is considered to be an excellent substitute for lubricants. Boron Nitrate powder is used in metal processing as it is resistive against corrosion and high temperature. It is also used in the ceramic and cosmetic industry. Several technological advancements for introducing more innovative and developed products in the market for various applications has provided several beneficial prospects for the market. The region of Asia Pacific is considered to be most profitable for the market owing to the growing demand for various electronics devices along with the easy availability of raw materials and low labor costs.

The Boron Nitrate Powder market research report delivers an acute valuation and taxonomy of the Boron Nitrate Powder industry by practically splitting the market on the basis of different types, applications, and regions. Through the analysis of the historical and projected trends, all the segments and sub-segments were evaluated through the bottom-up approach, and different market sizes have been projected for FY 2020 to FY 2026.

logoReport Scope

Report Attribute

Details

Market Size in 2019

USD 1,200 Million

Projected Market Size in 2026

USD 1,700 Million

CAGR Growth Rate

4% CAGR

Base Year

2019

Forecast Years

2020-2026

Key Market Players

Saint-Gobain, Henze BNP AG, The 3M Company, Kennametal, Mizushima Ferroalloy Co., Ltd., Denka Company Ltd, ZYP Coatings Inc., Showa Denko K.K., H.C.Starck GmbH, Momentive Performance Materials Inc., and Others

Key Segment

By Form, Application, and Region

Major Regions Covered

North America, Europe, Asia Pacific, Latin America, and the Middle East & Africa

Purchase Options

Request customized purchase options to meet your research needs. Explore purchase options

The regional segmentation of the Boron Nitrate Powder industry includes the complete classification of all the major continents including North America, Latin America, Europe, Asia Pacific, and the Middle East & Africa. Further, country-wise data for the Boron Nitrate Powder industry is provided for the leading economies of the world.

The Boron Nitrate Powder market is segmented based on Form and Application. On the basis of form segmentation, the market is classified into Amorphous Form, Hexagonal Form, Cubic Form, Wurtzite Form. In terms of application, the market is bifurcated into Coatings & Mold Release, Composites, Electrical Insulation, Lubrication, Mechanical Tools, Paints, Personal Care, Thermal Spray, Others.

logoSome of the essential players operating in the Boron Nitrate Powder market, but not restricted to include

  •  Saint-Gobain
  •  Henze BNP AG
  •  The 3M Company
  •  Kennametal
  •  Mizushima Ferroalloy Co. Ltd.
  •  Denka Company Ltd
  •  ZYP Coatings Inc.
  •  Showa Denko K.K.
  •  H.C.Starck GmbH
  •  Momentive Performance Materials Inc.

The taxonomy of the Boron Nitrate Powder industry by its scope and segmentation is as follows:

logo By Form Segmentation Analysis (Customizable)

  • Amorphous Form
  • Hexagonal Form
  • Cubic Form
  • Wurtzite Form

logo By Application Segmentation Analysis (Customizable)

  • Coatings & Mold Release
  • Composites
  • Electrical Insulation
  • Lubrication
  • Mechanical Tools
  • Paints
  • Personal Care
  • Thermal Spray
  • Others

logo Regional Segmentation Analysis (Customizable)

  • North America
    • The U.S.
    • Canada
  • Europe
    • Germany
    • The UK
    • France
    • Spain
    • Italy
    • Rest of Europe
  • Asia Pacific
    • China
    • Japan
    • India
    • South Korea
    • Southeast Asia
    • Rest of Asia Pacific
  • Latin America
    • Brazil
    • Mexico
    • Rest of Latin America
  • Middle East & Africa
    • GCC
    • South Africa
    • Rest of Middle East & Africa

Table of Content

  1. Chapter 1 Executive Summary
    1. 1.1. Introduction of Boron Nitrate Powder
    2. 1.2. Global Boron Nitrate Powder Market, 2019 & 2026 (USD Million)
    3. 1.3. Global Boron Nitrate Powder Market, 2016 – 2026 (USD Million) (Tons)
    4. 1.4. Global Boron Nitrate Powder Market Absolute Revenue Opportunity, 2016 – 2026 (USD Million)
    5. 1.5. Global Boron Nitrate Powder Market Incremental Revenue Opportunity, 2020 – 2026 (USD Million)
  2. Chapter 2 Boron Nitrate Powder Market – Form Analysis
    1. 2.1. Global Boron Nitrate Powder Market – Form Overview
    2. 2.2. Global Boron Nitrate Powder Market Share, by Form, 2019 & 2026 (USD Million)
    3. 2.3. Global Boron Nitrate Powder Market share, by Form, 2019 & 2026 (Tons)
    4. 2.4. Amorphous Form
      1. 2.4.1. Global Amorphous Form Boron Nitrate Powder Market, 2016 – 2026 (USD Million)
      2. 2.4.2. Global Amorphous Form Boron Nitrate Powder Market, 2016 – 2026 (Tons)
    5. 2.5. Hexagonal Form
      1. 2.5.1. Global Hexagonal Form Boron Nitrate Powder Market, 2016 – 2026 (USD Million)
      2. 2.5.2. Global Hexagonal Form Boron Nitrate Powder Market, 2016 – 2026 (Tons)
    6. 2.6. Cubic Form
      1. 2.6.1. Global Cubic Form Boron Nitrate Powder Market, 2016 – 2026 (USD Million)
      2. 2.6.2. Global Cubic Form Boron Nitrate Powder Market, 2016 – 2026 (Tons)
    7. 2.7. Wurtzite Form
      1. 2.7.1. Global Wurtzite Form Boron Nitrate Powder Market, 2016 – 2026 (USD Million)
      2. 2.7.2. Global Wurtzite Form Boron Nitrate Powder Market, 2016 – 2026 (Tons)
  3. Chapter 3 Boron Nitrate Powder Market – Application Analysis
    1. 3.1. Global Boron Nitrate Powder Market – Application Overview
    2. 3.2. Global Boron Nitrate Powder Market Share, by Application, 2019 & 2026 (USD Million)
    3. 3.3. Global Boron Nitrate Powder Market share, by Application, 2019 & 2026 (Tons)
    4. 3.4. Coatings & Mold Release
      1. 3.4.1. Global Coatings & Mold Release Boron Nitrate Powder Market, 2016 – 2026 (USD Million)
      2. 3.4.2. Global Coatings & Mold Release Boron Nitrate Powder Market, 2016 – 2026 (Tons)
    5. 3.5. Composites
      1. 3.5.1. Global Composites Boron Nitrate Powder Market, 2016 – 2026 (USD Million)
      2. 3.5.2. Global Composites Boron Nitrate Powder Market, 2016 – 2026 (Tons)
    6. 3.6. Electrical Insulation
      1. 3.6.1. Global Electrical Insulation Boron Nitrate Powder Market, 2016 – 2026 (USD Million)
      2. 3.6.2. Global Electrical Insulation Boron Nitrate Powder Market, 2016 – 2026 (Tons)
    7. 3.7. Lubrication
      1. 3.7.1. Global Lubrication Boron Nitrate Powder Market, 2016 – 2026 (USD Million)
      2. 3.7.2. Global Lubrication Boron Nitrate Powder Market, 2016 – 2026 (Tons)
    8. 3.8. Mechanical Tools
      1. 3.8.1. Global Mechanical Tools Boron Nitrate Powder Market, 2016 – 2026 (USD Million)
      2. 3.8.2. Global Mechanical Tools Boron Nitrate Powder Market, 2016 – 2026 (Tons)
    9. 3.9. Paints
      1. 3.9.1. Global Paints Boron Nitrate Powder Market, 2016 – 2026 (USD Million)
      2. 3.9.2. Global Paints Boron Nitrate Powder Market, 2016 – 2026 (Tons)
    10. 3.10. Personal Care
      1. 3.10.1. Global Personal Care Boron Nitrate Powder Market, 2016 – 2026 (USD Million)
      2. 3.10.2. Global Personal Care Boron Nitrate Powder Market, 2016 – 2026 (Tons)
    11. 3.11. Thermal Spray
      1. 3.11.1. Global Thermal Spray Boron Nitrate Powder Market, 2016 – 2026 (USD Million)
      2. 3.11.2. Global Thermal Spray Boron Nitrate Powder Market, 2016 – 2026 (Tons)
    12. 3.12. Others
      1. 3.12.1. Global Others Boron Nitrate Powder Market, 2016 – 2026 (USD Million)
      2. 3.12.2. Global Others Boron Nitrate Powder Market, 2016 – 2026 (Tons)
  4. Chapter 4 Boron Nitrate Powder Market – Regional Analysis
    1. 4.1. Global Boron Nitrate Powder Market Regional Overview
    2. 4.2. Global Boron Nitrate Powder Market Share, by Region, 2019 & 2026 (USD Million)
    3. 4.3. Global Boron Nitrate Powder Market Share, by Region, 2019 & 2026 (Tons)
    4. 4.4. North America
      1. 4.4.1. North America Boron Nitrate Powder Market, 2016 – 2026 (USD Million)
      2. 4.4.2. North America Market, 2016 – 2026 (Tons)
      3. 4.4.3. North America Boron Nitrate Powder Market, by Form, 2016 – 2026
      4. 4.4.4. North America Boron Nitrate Powder Market, by Application, 2016 – 2026
      5. 4.4.5. U.S.
      6. 4.4.6. Canada
    5. 4.5. Europe
      1. 4.5.1. Europe Boron Nitrate Powder Market, 2016 – 2026 (USD Million)
      2. 4.5.2. Europe Market, 2016 – 2026 (Tons)
      3. 4.5.3. Europe Boron Nitrate Powder Market, by Form, 2016 – 2026
      4. 4.5.4. Europe Boron Nitrate Powder Market, by Application, 2016 – 2026
      5. 4.5.5. Germany
      6. 4.5.6. France
      7. 4.5.7. U.K.
      8. 4.5.8. Italy
      9. 4.5.9. Spain
      10. 4.5.10. Rest of Europe
    6. 4.6. Asia Pacific
      1. 4.6.1. Asia Pacific Boron Nitrate Powder Market, 2016 – 2026 (USD Million)
      2. 4.6.2. Asia Pacific Market, 2016 – 2026 (Tons)
      3. 4.6.3. Asia Pacific Boron Nitrate Powder Market, by Form, 2016 – 2026
      4. 4.6.4. Asia Pacific Boron Nitrate Powder Market, by Application, 2016 – 2026
      5. 4.6.5. China
      6. 4.6.6. Japan
      7. 4.6.7. India
      8. 4.6.8. South Korea
      9. 4.6.9. South-East Asia
      10. 4.6.10. Rest of Asia Pacific
    7. 4.7. Latin America
      1. 4.7.1. Latin America Boron Nitrate Powder Market, 2016 – 2026 (USD Million)
      2. 4.7.2. Latin America Market, 2016 – 2026 (Tons)
      3. 4.7.3. Latin America Boron Nitrate Powder Market, by Form, 2016 – 2026
      4. 4.7.4. Latin America Boron Nitrate Powder Market, by Application, 2016 – 2026
      5. 4.7.5. Brazil
      6. 4.7.6. Mexico
      7. 4.7.7. Rest of Latin America
    8. 4.8. The Middle-East and Africa
      1. 4.8.1. The Middle-East and Africa Boron Nitrate Powder Market, 2016 – 2026 (USD Million)
      2. 4.8.2. The Middle-East and Africa Market, 2016 – 2026 (Tons)
      3. 4.8.3. The Middle-East and Africa Boron Nitrate Powder Market, by Form, 2016 – 2026
      4. 4.8.4. The Middle-East and Africa Boron Nitrate Powder Market, by Application, 2016 – 2026
      5. 4.8.5. GCC Countries
      6. 4.8.6. South Africa
      7. 4.8.7. Rest of Middle-East Africa
  5. Chapter 5 Boron Nitrate Powder Production, Consumption, Export, Import by Regions
    1. 5.1. Global Boron Nitrate Powder Production and Consumption, 2016 – 2026 (Tons)
    2. 5.2. Global Import and Export Analysis, by Region
  6. Chapter 6 Boron Nitrate Powder Market – Competitive Landscape
    1. 6.1. Competitor Market Share – Revenue
    2. 6.2. Market Concentration Rate Analysis, Top 3 and Top 5 Players
    3. 6.3. Competitor Market Share – Volume
    4. 6.4. Strategic Developments
      1. 6.4.1. Acquisitions and Mergers
      2. 6.4.2. New Products
      3. 6.4.3. Research & Development Activities
  7. Chapter 7 Company Profiles
    1. 7.1. Saint-Gobain
      1. 7.1.1. Company Overview
      2. 7.1.2. Product/Service Portfolio
      3. 7.1.3. Saint-Gobain Sales, Revenue, Price, and Gross Margin
      4. 7.1.4. Saint-Gobain Revenue and Growth Rate
      5. 7.1.5. Saint-Gobain Market Share
      6. 7.1.6. Recent Initiatives, Funding/VC Activities, and Technological Innovations
    2. 7.2. Henze BNP AG
      1. 7.2.1. Company Overview
      2. 7.2.2. Product/Service Portfolio
      3. 7.2.3. Henze BNP AG Sales, Revenue, Price, and Gross Margin
      4. 7.2.4. Henze BNP AG Revenue and Growth Rate
      5. 7.2.5. Henze BNP AG Market Share
      6. 7.2.6. Recent Initiatives, Funding/VC Activities, and Technological Innovations
    3. 7.3. The 3M Company
      1. 7.3.1. Company Overview
      2. 7.3.2. Product/Service Portfolio
      3. 7.3.3. The 3M Company Sales, Revenue, Price, and Gross Margin
      4. 7.3.4. The 3M Company Revenue and Growth Rate
      5. 7.3.5. The 3M Company Market Share
      6. 7.3.6. Recent Initiatives, Funding/VC Activities, and Technological Innovations
    4. 7.4. Kennametal
      1. 7.4.1. Company Overview
      2. 7.4.2. Product/Service Portfolio
      3. 7.4.3. Kennametal Sales, Revenue, Price, and Gross Margin
      4. 7.4.4. Kennametal Revenue and Growth Rate
      5. 7.4.5. Kennametal Market Share
      6. 7.4.6. Recent Initiatives, Funding/VC Activities, and Technological Innovations
    5. 7.5. Mizushima Ferroalloy Co., Ltd.
      1. 7.5.1. Company Overview
      2. 7.5.2. Product/Service Portfolio
      3. 7.5.3. Mizushima Ferroalloy Co., Ltd. Sales, Revenue, Price, and Gross Margin
      4. 7.5.4. Mizushima Ferroalloy Co., Ltd. Revenue and Growth Rate
      5. 7.5.5. Mizushima Ferroalloy Co., Ltd. Market Share
      6. 7.5.6. Recent Initiatives, Funding/VC Activities, and Technological Innovations
    6. 7.6. Denka Company Ltd
      1. 7.6.1. Company Overview
      2. 7.6.2. Product/Service Portfolio
      3. 7.6.3. Denka Company Ltd Sales, Revenue, Price, and Gross Margin
      4. 7.6.4. Denka Company Ltd Revenue and Growth Rate
      5. 7.6.5. Denka Company Ltd Market Share
      6. 7.6.6. Recent Initiatives, Funding/VC Activities, and Technological Innovations
    7. 7.7. ZYP Coatings Inc.
      1. 7.7.1. Company Overview
      2. 7.7.2. Product/Service Portfolio
      3. 7.7.3. ZYP Coatings Inc. Sales, Revenue, Price, and Gross Margin
      4. 7.7.4. ZYP Coatings Inc. Revenue and Growth Rate
      5. 7.7.5. ZYP Coatings Inc. Market Share
      6. 7.7.6. Recent Initiatives, Funding/VC Activities, and Technological Innovations
    8. 7.8. Showa Denko K.K.
      1. 7.8.1. Company Overview
      2. 7.8.2. Product/Service Portfolio
      3. 7.8.3. Showa Denko K.K. Sales, Revenue, Price, and Gross Margin
      4. 7.8.4. Showa Denko K.K. Revenue and Growth Rate
      5. 7.8.5. Showa Denko K.K. Market Share
      6. 7.8.6. Recent Initiatives, Funding/VC Activities, and Technological Innovations
    9. 7.9. H.C.Starck GmbH
      1. 7.9.1. Company Overview
      2. 7.9.2. Product/Service Portfolio
      3. 7.9.3. H.C.Starck GmbH Sales, Revenue, Price, and Gross Margin
      4. 7.9.4. H.C.Starck GmbH Revenue and Growth Rate
      5. 7.9.5. H.C.Starck GmbH Market Share
      6. 7.9.6. Recent Initiatives, Funding/VC Activities, and Technological Innovations
    10. 7.10. Momentive Performance Materials Inc.
      1. 7.10.1. Company Overview
      2. 7.10.2. Product/Service Portfolio
      3. 7.10.3. Momentive Performance Materials Inc. Sales, Revenue, Price, and Gross Margin
      4. 7.10.4. Momentive Performance Materials Inc. Revenue and Growth Rate
      5. 7.10.5. Momentive Performance Materials Inc. Market Share
      6. 7.10.6. Recent Initiatives, Funding/VC Activities, and Technological Innovations
    11. 7.11. Others
      1. 7.11.1. Company Overview
      2. 7.11.2. Product/Service Portfolio
      3. 7.11.3. Others Sales, Revenue, Price, and Gross Margin
      4. 7.11.4. Others Revenue and Growth Rate
      5. 7.11.5. Others Market Share
      6. 7.11.6. Recent Initiatives, Funding/VC Activities, and Technological Innovations
  8. Chapter 8 Boron Nitrate Powder — Industry Analysis
    1. 8.1. Introduction and Taxonomy
    2. 8.2. Boron Nitrate Powder Market – Key Trends
      1. 8.2.1. Market Drivers
      2. 8.2.2. Market Restraints
      3. 8.2.3. Market Opportunities
    3. 8.3. Value Chain Analysis
    4. 8.4. Key Mandates and Regulations
    5. 8.5. Technology Roadmap and Timeline
    6. 8.6. Boron Nitrate Powder Market – Attractiveness Analysis
      1. 8.6.1. By Form
      2. 8.6.2. By Application
      3. 8.6.3. By Region
  9. Chapter 9 Raw Material Analysis
    1. 9.1. Boron Nitrate Powder Key Raw Material Analysis
      1. 9.1.1. Key Raw Materials
      2. 9.1.2. Price Trend of Key Raw Materials
    2. 9.2. Key Suppliers of Raw Materials
    3. 9.3. Proportion of Manufacturing Cost Structure
      1. 9.3.1. Raw Materials Cost
      2. 9.3.2. Labor Cost
      3. 9.3.3. Manufacturing Expenses
      4. 9.3.4. Miscellaneous Expenses
    4. 9.4. Manufacturing Cost Analysis of Boron Nitrate Powder
  10. Chapter 10 Industrial Chain, Sourcing Strategy, and Downstream Buyers
    1. 10.1. Boron Nitrate Powder Industrial Chain Analysis
    2. 10.2. Upstream Raw Materials Sourcing
      1. 10.2.1. Risk Mitigation:
      2. 10.2.2. Supplier Relationships:
      3. 10.2.3. Business Processes:
      4. 10.2.4. Securing the Product:
    3. 10.3. Raw Materials Sources of Boron Nitrate Powder Major Manufacturers
    4. 10.4. Downstream Buyers
    5. 10.5. Distributors/Traders List
  11. Chapter 11 Marketing Strategy Analysis, Distributors
    1. 11.1. Marketing Channel
    2. 11.2. Direct Marketing
    3. 11.3. Indirect Marketing
    4. 11.4. Marketing Channel Development Trends
    5. 11.5. Economic/Political Environmental Change
  12. Chapter 12 Report Conclusion & Key Insights
    1. 12.1. Key Insights from Primary Interviews & Surveys Respondents
    2. 12.2. Key Takeaways from Analysts, Consultants, and Industry Leaders
  13. Chapter 13 Research Approach & Methodology
    1. 13.1. Report Description
    2. 13.2. Research Scope
    3. 13.3. Research Methodology
      1. 13.3.1. Secondary Research
      2. 13.3.2. Primary Research
      3. 13.3.3. Statistical Models
      4. 13.3.4. Research Limitations

  • List of Figures

    Fig.1 Product Picture of Boron Nitrate Powder
    Fig.2 Global Boron Nitrate Powder Market, 2016 – 2026 (USD Million)
    Fig.3 Global Boron Nitrate Powder Market, 2016 – 2026 (Tons)
    Fig.4 Global Boron Nitrate Powder Market Absolute Revenue Opportunity, 2016 – 2026 (USD Million)
    Fig.5 Global Boron Nitrate Powder Market Incremental Revenue Opportunity, 2020 – 2026 (USD Million)
    Fig.6 Global Boron Nitrate Powder Market Share, by Form, 2019 & 2026 (USD Million)
    Fig.7 Global Boron Nitrate Powder Market Share, by Form, 2019 & 2026 (Tons)
    Fig.8 Global Amorphous Form Boron Nitrate Powder Market, 2016 – 2026 (USD Million)
    Fig.9 Global Amorphous Form Boron Nitrate Powder Market, 2016 – 2026 (Tons)
    Fig.10 Global Hexagonal Form Boron Nitrate Powder Market, 2016 – 2026 (USD Million)
    Fig.11 Global Hexagonal Form Boron Nitrate Powder Market, 2016 – 2026 (Tons)
    Fig.12 Global Cubic Form Boron Nitrate Powder Market, 2016 – 2026 (USD Million)
    Fig.13 Global Cubic Form Boron Nitrate Powder Market, 2016 – 2026 (Tons)
    Fig.14 Global Wurtzite Form Boron Nitrate Powder Market, 2016 – 2026 (USD Million)
    Fig.15 Global Wurtzite Form Boron Nitrate Powder Market, 2016 – 2026 (Tons)
    Fig.16 Global Boron Nitrate Powder Market Share, by Application, 2019 & 2026 (USD Million)
    Fig.17 Global Boron Nitrate Powder Market Share, by Application, 2019 & 2026 (Tons)
    Fig.18 Global Coatings & Mold Release Boron Nitrate Powder Market, 2016 – 2026 (USD Million)
    Fig.19 Global Coatings & Mold Release Boron Nitrate Powder Market, 2016 – 2026 (Tons)
    Fig.20 Global Composites Boron Nitrate Powder Market, 2016 – 2026 (USD Million)
    Fig.21 Global Composites Boron Nitrate Powder Market, 2016 – 2026 (Tons)
    Fig.22 Global Electrical Insulation Boron Nitrate Powder Market, 2016 – 2026 (USD Million)
    Fig.23 Global Electrical Insulation Boron Nitrate Powder Market, 2016 – 2026 (Tons)
    Fig.24 Global Lubrication Boron Nitrate Powder Market, 2016 – 2026 (USD Million)
    Fig.25 Global Lubrication Boron Nitrate Powder Market, 2016 – 2026 (Tons)
    Fig.26 Global Mechanical Tools Boron Nitrate Powder Market, 2016 – 2026 (USD Million)
    Fig.27 Global Mechanical Tools Boron Nitrate Powder Market, 2016 – 2026 (Tons)
    Fig.28 Global Paints Boron Nitrate Powder Market, 2016 – 2026 (USD Million)
    Fig.29 Global Paints Boron Nitrate Powder Market, 2016 – 2026 (Tons)
    Fig.30 Global Personal Care Boron Nitrate Powder Market, 2016 – 2026 (USD Million)
    Fig.31 Global Personal Care Boron Nitrate Powder Market, 2016 – 2026 (Tons)
    Fig.32 Global Thermal Spray Boron Nitrate Powder Market, 2016 – 2026 (USD Million)
    Fig.33 Global Thermal Spray Boron Nitrate Powder Market, 2016 – 2026 (Tons)
    Fig.34 Global Others Boron Nitrate Powder Market, 2016 – 2026 (USD Million)
    Fig.35 Global Others Boron Nitrate Powder Market, 2016 – 2026 (Tons)
    Fig.36 Global Boron Nitrate Powder Market Share, by Region, 2019 & 2026 (USD Million)
    Fig.37 Global Boron Nitrate Powder Market Share, by Region, 2019 & 2026 (Tons)
    Fig.38 North America Boron Nitrate Powder Market, 2016 – 2026 (USD Million)
    Fig.39 North America Boron Nitrate Powder Market, 2016 – 2026 (Tons)
    Fig.40 U.S. Boron Nitrate Powder Market, 2016 – 2026 (USD Million)
    Fig.41 U.S. Boron Nitrate Powder  Market, 2016 – 2026 (Tons)
    Fig.42 Canada Boron Nitrate Powder Market, 2016 – 2026 (USD Million)
    Fig.43 Canada Boron Nitrate Powder  Market, 2016 – 2026 (Tons)
    Fig.44 Europe Boron Nitrate Powder Market, 2016 – 2026 (USD Million)
    Fig.45 Europe Boron Nitrate Powder Market, 2016 – 2026 (Tons)
    Fig.46 Germany Boron Nitrate Powder Market, 2016 – 2026 (USD Million)
    Fig.47 Germany Boron Nitrate Powder  Market, 2016 – 2026 (Tons)
    Fig.48 France Boron Nitrate Powder Market, 2016 – 2026 (USD Million)
    Fig.49 France Boron Nitrate Powder  Market, 2016 – 2026 (Tons)
    Fig.50 U.K. Boron Nitrate Powder Market, 2016 – 2026 (USD Million)
    Fig.51 U.K. Boron Nitrate Powder  Market, 2016 – 2026 (Tons)
    Fig.52 Italy Boron Nitrate Powder Market, 2016 – 2026 (USD Million)
    Fig.53 Italy Boron Nitrate Powder  Market, 2016 – 2026 (Tons)
    Fig.54 Spain Boron Nitrate Powder Market, 2016 – 2026 (USD Million)
    Fig.55 Spain Boron Nitrate Powder  Market, 2016 – 2026 (Tons)
    Fig.56 Rest of Europe Boron Nitrate Powder Market, 2016 – 2026 (USD Million)
    Fig.57 Rest of Europe Boron Nitrate Powder  Market, 2016 – 2026 (Tons)
    Fig.58 Asia Pacific Boron Nitrate Powder Market, 2016 – 2026 (USD Million)
    Fig.59 Asia Pacific Boron Nitrate Powder Market, 2016 – 2026 (Tons)
    Fig.60 China Boron Nitrate Powder Market, 2016 – 2026 (USD Million)
    Fig.61 China Boron Nitrate Powder  Market, 2016 – 2026 (Tons)
    Fig.62 Japan Boron Nitrate Powder Market, 2016 – 2026 (USD Million)
    Fig.63 Japan Boron Nitrate Powder  Market, 2016 – 2026 (Tons)
    Fig.64 India Boron Nitrate Powder Market, 2016 – 2026 (USD Million)
    Fig.65 India Boron Nitrate Powder  Market, 2016 – 2026 (Tons)
    Fig.66 South  Korea Boron Nitrate Powder Market, 2016 – 2026 (USD Million)
    Fig.67 South  Korea Boron Nitrate Powder  Market, 2016 – 2026 (Tons)
    Fig.68 South-East Asia Boron Nitrate Powder Market, 2016 – 2026 (USD Million)
    Fig.69 South-East Asia Boron Nitrate Powder  Market, 2016 – 2026 (Tons)
    Fig.70 Rest of Asia Pacific Boron Nitrate Powder Market, 2016 – 2026 (USD Million)
    Fig.71 Rest of Asia Pacific Boron Nitrate Powder  Market, 2016 – 2026 (Tons)
    Fig.72 Latin America Boron Nitrate Powder Market, 2016 – 2026 (USD Million)
    Fig.73 Latin America Boron Nitrate Powder Market, 2016 – 2026 (Tons)
    Fig.74 Brazil Boron Nitrate Powder Market, 2016 – 2026 (USD Million)
    Fig.75 Brazil Boron Nitrate Powder  Market, 2016 – 2026 (Tons)
    Fig.76 Mexico Boron Nitrate Powder Market, 2016 – 2026 (USD Million)
    Fig.77 Mexico Boron Nitrate Powder  Market, 2016 – 2026 (Tons)
    Fig.78 Rest of Latin America Boron Nitrate Powder Market, 2016 – 2026 (USD Million)
    Fig.79 Rest of Latin America Boron Nitrate Powder  Market, 2016 – 2026 (Tons)
    Fig.80 The Middle-East and Africa Boron Nitrate Powder Market, 2016 – 2026 (USD Million)
    Fig.81 The Middle-East and Africa Boron Nitrate Powder Market, 2016 – 2026 (Tons)
    Fig.82 GCC Countries Boron Nitrate Powder Market, 2016 – 2026 (USD Million)
    Fig.83 GCC Countries Boron Nitrate Powder  Market, 2016 – 2026 (Tons)
    Fig.84 South Africa Boron Nitrate Powder Market, 2016 – 2026 (USD Million)
    Fig.85 South Africa Boron Nitrate Powder  Market, 2016 – 2026 (Tons)
    Fig.86 Rest of Middle-East Africa Boron Nitrate Powder Market, 2016 – 2026 (USD Million)
    Fig.87 Rest of Middle-East Africa Boron Nitrate Powder  Market, 2016 – 2026 (Tons)
    Fig.88 Global Boron Nitrate Powder Production and Consumption, 2016 – 2026 (Tons)
    Fig.89 North America Boron Nitrate Powder Production and Consumption, 2016 – 2026 (USD Million) (Tons)
    Fig.90 Europe Boron Nitrate Powder Production and Consumption, 2016 – 2026 (USD Million) (Tons)
    Fig.91 Asia Pacific Boron Nitrate Powder Production and Consumption, 2016 – 2026 (USD Million) (Tons)
    Fig.92 Latin America Boron Nitrate Powder Production and Consumption, 2016 – 2026 (USD Million) (Tons)
    Fig.93 The Middle-East and Africa Boron Nitrate Powder Production and Consumption, 2016 – 2026 (USD Million) (Tons)
    Fig.94 Competitor Market Share – Revenue
    Fig.95 Competitor Market Share – Volume
    Fig.96 Saint-Gobain Revenue and Growth Rate
    Fig.97 Saint-Gobain Market Share
    Fig.98 Henze BNP AG Revenue and Growth Rate
    Fig.99 Henze BNP AG Market Share
    Fig.100 The 3M Company Revenue and Growth Rate
    Fig.101 The 3M Company Market Share
    Fig.102 Kennametal Revenue and Growth Rate
    Fig.103 Kennametal Market Share
    Fig.104 Mizushima Ferroalloy Co., Ltd. Revenue and Growth Rate
    Fig.105 Mizushima Ferroalloy Co., Ltd. Market Share
    Fig.106 Denka Company Ltd Revenue and Growth Rate
    Fig.107 Denka Company Ltd Market Share
    Fig.108 ZYP Coatings Inc. Revenue and Growth Rate
    Fig.109 ZYP Coatings Inc. Market Share
    Fig.110 Showa Denko K.K. Revenue and Growth Rate
    Fig.111 Showa Denko K.K. Market Share
    Fig.112 H.C.Starck GmbH Revenue and Growth Rate
    Fig.113 H.C.Starck GmbH Market Share
    Fig.114 Momentive Performance Materials Inc. Revenue and Growth Rate
    Fig.115 Momentive Performance Materials Inc. Market Share
    Fig.116 Others Revenue and Growth Rate
    Fig.117 Others Market Share
    Fig.118 Market Dynamics
    Fig.119 Global Boron Nitrate Powder – Value Chain Analysis
    Fig.120 Key Mandates and Regulations
    Fig.121 Technology Roadmap and Timeline
    Fig.122 Market Attractiveness Analysis – By Form
    Fig.123 Market Attractiveness Analysis – By Application
    Fig.124 Market Attractiveness Analysis – By Region
    Fig.125 Manufacturing Cost Structure of Boron Nitrate Powder
    Fig.126 Boron Nitrate Powder Industrial Chain Analysis
    Fig.127 Market Channels
    Fig.128 Marketing Channel Development Trend
    Fig.129 Growth in World Gross Product, 2008-2018

    List of Tables

    Table 1 Global Boron Nitrate Powder Market, 2019 & 2026 (USD Million)
    Table 2 Global Boron Nitrate Powder Market, by Form, 2016 – 2026 (USD Million)
    Table 3 Global Boron Nitrate Powder Market, by Form, 2016 – 2026 (Tons)
    Table 4 Global Boron Nitrate Powder Market, by Application, 2016 – 2026 (USD Million)
    Table 5 Global Boron Nitrate Powder Market, by Application, 2016 – 2026 (Tons)
    Table 6 Global Boron Nitrate Powder Market, by Region, 2016 – 2026 (USD Million)
    Table 7 Global Boron Nitrate Powder Market, by Region, 2016 – 2026 (Tons)
    Table 8 North America Boron Nitrate Powder Market, by Country, 2016 – 2026 (USD Million)
    Table 9 North America Boron Nitrate Powder Market, by Country, 2016 – 2026 (Tons)
    Table 10 North America Boron Nitrate Powder Market, by Form, 2016 – 2026 (USD Million)
    Table 11 North America Boron Nitrate Powder Market, by Form, 2016 – 2026 (Tons)
    Table 12 North America Boron Nitrate Powder Market, by Application, 2016 – 2026 (USD Million)
    Table 13 North America Boron Nitrate Powder Market, by Application, 2016 – 2026 (Tons)
    Table 14 Europe Boron Nitrate Powder Market, by Country, 2016 – 2026 (USD Million)
    Table 15 Europe Boron Nitrate Powder Market, by Country, 2016 – 2026 (Tons)
    Table 16 Europe Boron Nitrate Powder Market, by Form, 2016 – 2026 (USD Million)
    Table 17 Europe Boron Nitrate Powder Market, by Form, 2016 – 2026 (Tons)
    Table 18 Europe Boron Nitrate Powder Market, by Application, 2016 – 2026 (USD Million)
    Table 19 Europe Boron Nitrate Powder Market, by Application, 2016 – 2026 (Tons)
    Table 20 Asia Pacific Boron Nitrate Powder Market, by Country, 2016 – 2026 (USD Million)
    Table 21 Asia Pacific Boron Nitrate Powder Market, by Country, 2016 – 2026 (Tons)
    Table 22 Asia Pacific Boron Nitrate Powder Market, by Form, 2016 – 2026 (USD Million)
    Table 23 Asia Pacific Boron Nitrate Powder Market, by Form, 2016 – 2026 (Tons)
    Table 24 Asia Pacific Boron Nitrate Powder Market, by Application, 2016 – 2026 (USD Million)
    Table 25 Asia Pacific Boron Nitrate Powder Market, by Application, 2016 – 2026 (Tons)
    Table 26 Latin America Boron Nitrate Powder Market, by Country, 2016 – 2026 (USD Million)
    Table 27 Latin America Boron Nitrate Powder Market, by Country, 2016 – 2026 (Tons)
    Table 28 Latin America Boron Nitrate Powder Market, by Form, 2016 – 2026 (USD Million)
    Table 29 Latin America Boron Nitrate Powder Market, by Form, 2016 – 2026 (Tons)
    Table 30 Latin America Boron Nitrate Powder Market, by Application, 2016 – 2026 (USD Million)
    Table 31 Latin America Boron Nitrate Powder Market, by Application, 2016 – 2026 (Tons)
    Table 32 The Middle-East and Africa Boron Nitrate Powder Market, by Country, 2016 – 2026 (USD Million)
    Table 33 The Middle-East and Africa Boron Nitrate Powder Market, by Country, 2016 – 2026 (Tons)
    Table 34 The Middle-East and Africa Boron Nitrate Powder Market, by Form, 2016 – 2026 (USD Million)
    Table 35 The Middle-East and Africa Boron Nitrate Powder Market, by Form, 2016 – 2026 (Tons)
    Table 36 The Middle-East and Africa Boron Nitrate Powder Market, by Application, 2016 – 2026 (USD Million)
    Table 37 The Middle-East and Africa Boron Nitrate Powder Market, by Application, 2016 – 2026 (Tons)
    Table 38 North America Boron Nitrate Powder Production, Consumption, Export, Import, 2016 – 2019
    Table 39 Europe Boron Nitrate Powder Production, Consumption, Export, Import, 2016 – 2019
    Table 40 Asia Pacific Boron Nitrate Powder Production, Consumption, Export, Import, 2016 – 2019
    Table 41 Latin America Boron Nitrate Powder Production, Consumption, Export, Import, 2016 – 2019
    Table 42 The Middle-East and Africa Boron Nitrate Powder Production, Consumption, Export, Import, 2016 – 2019
    Table 43 Global Boron Nitrate Powder Market - Company Revenue Analysis, 2016 – 2019 (USD Million)
    Table 44 Global Boron Nitrate Powder Market - Company Revenue Share Analysis, 2016 – 2019 (%)
    Table 45 Global Boron Nitrate Powder Market - Company Volume Analysis, 2016 – 2019 (Tons)
    Table 46 Global Boron Nitrate Powder Market - Company Volume Share Analysis, 2016 – 2019 (%)
    Table 47 Acquisitions and Mergers
    Table 48 Market Drivers – Impact Analysis
    Table 49 Market Restraints
    Table 50 Market Opportunities
    Table 51 Production Base and Market Concentration Rate of Raw Material
    Table 52 Key Suppliers of Raw Materials
    Table 53 Raw Materials Sources of Boron Nitrate Powder Major Manufacturers
    Table 54 Major Buyers of Boron Nitrate Powder
    Table 55 Distributors/Traders of Boron Nitrate Powder by Region
    
    
  •  

    Industry Major Market Players

    •  Saint-Gobain
    •  Henze BNP AG
    •  The 3M Company
    •  Kennametal
    •  Mizushima Ferroalloy Co. Ltd.
    •  Denka Company Ltd
    •  ZYP Coatings Inc.
    •  Showa Denko K.K.
    •  H.C.Starck GmbH
    •  Momentive Performance Materials Inc.