Search Market Research Report

Discover Our Latest Reports
Discover Our Featured Reports
Discover Top Selling Reports

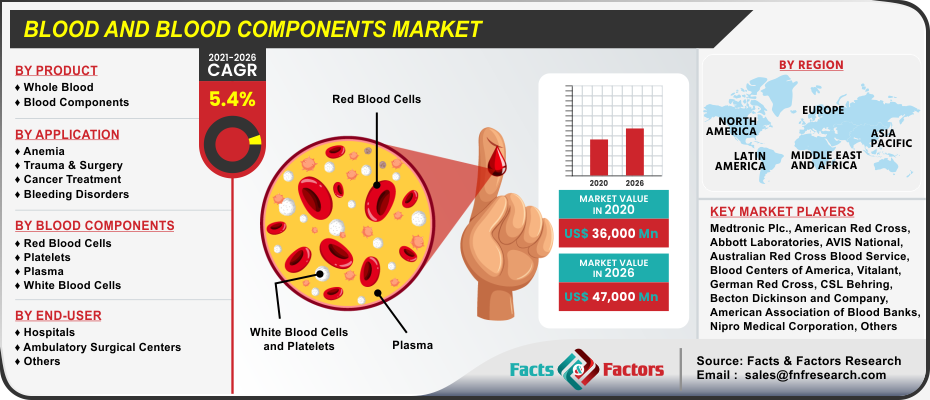
Blood and Blood Components Market Size, Share Global Analysis Report, , 2021 – 2026

report img

Blood and Blood Components Market By Product (Whole Blood, and Blood Components), By Application (Anemia, Trauma & Surgery, Cancer Treatment, and Bleeding Disorders), By Blood Components (Red Blood Cells, Platelets, Plasma, and White Blood Cells), and By End-User (Hospitals, Ambulatory Surgical Centers, and Others): Global Industry Perspective, Comprehensive Analysis, and Forecast, 2021 – 2026

Industry Insights

According to the report published by the Facts & Factors, global demand for the blood and blood components market was estimated at approximately USD 36,000 Million in 2020 and is expected to generate revenue of around USD 47,000 Million by the end of 2026, growing at a CAGR of around 5.4% between 2021 and 2026.

logoMarket Overview

Blood alludes to the liquid which flows in the vascular arrangement of nearly all creatures, as well as people. The red blood cells, white blood cells, platelets, and plasma are its four primary components. Blood and blood components can be used in several medical condition treatments such as anemia, bleeding disorders, trauma and surgery, and cancer treatment. In addition, they are also extensively used in resuscitation applications and in the surgery of traumatized patients.

logoIndustry Growth Factor

The growth of the global blood and blood components market is driven by the increase in the prevalence of trauma and road accidents and the growing occurrence of diseases. At times, due to traumas such as hemorrhage, the volume of blood gets reduced to a very low level and cannot be replaced quickly enough by the body.

The road accident causes extreme blood loss from the body, which has to be restored instantly. Sometimes, the blood itself is lacking only some components, as in the hemophilia case. All these situations demand transfusion of blood and blood components into the body of the patient. Moreover, the rising incidence of chronic diseases such as liver disease, cancer, among others will also encourage the growth of the global blood and blood components market during the forecast period.

Furthermore, the growing incidence of bleeding disorders along with the increase in the number of surgeries across the world is also propelling the blood and blood components market development globally. Also, the major rise in the elderly population base that is susceptible to lots of chronic diseases such as liver cirrhosis will make a significant demand for blood derivatives in the near future. Besides, the mounting awareness associated with the significance of blood donations between people will influence positively the industry viewpoint. Worldwide, the number of blood donations is also growing significantly.

However, the rising risk of developing or transferring an infection while the blood is transmitted to the patients, the inaccessibility of proficient blood stockpiling procedures, and the decline in the blood banks number are some restraining factors that might hinder the market growth. On the contrary, the production of novel advancements and the growing usage of plasma in the healthcare sector will most likely present growth prospects for the blood and blood components market growth in the forecast period.

Blood and Blood Components Market

To know more about this report | Request Free Sample Copy

logoSegmentation Analysis

The global blood and blood components market is classified into product, application, blood components, and end-user. On the basis of the product, the global blood and blood components market is segmented into whole blood, and blood components. Based on the application, the global blood and blood components market is divided into anemia, trauma & surgery, cancer treatment, and bleeding disorders.

The global blood and blood components market based on the blood components is classified into red blood cells, platelets, plasma, and white blood cells. In terms of the end-user industry, the global blood and blood components market is categorized into hospitals, ambulatory surgical centers, and others.

logoReport Scope

Report Attribute

Details

Market Size in 2020

USD 36,000 Million

Projected Market Size in 2026

USD 47,000 Million

CAGR Growth Rate

5.4% CAGR

Base Year

2020

Forecast Years

2021-2026

Key Market Players

Medtronic Plc., American Red Cross, Abbott Laboratories, Australian Red Cross Blood Service, Blood Centers of America, German Red Cross, Becton Dickinson and Company, Nipro Medical Corporation, AVIS National, American Association of Blood Banks, National Blood Authority Australia, Baxter International Inc., Vitalant, CSL Behring, Novartis, Immucor, Novo Nordisk, Roche Diagnostics, Ortho Clinical Diagnostics, Grifols International SA, Fresenius Kabi, Medimmune (AstraZeneca), Thermo Fisher Scientific Inc., Sarstedt AG & Co., Terumo Corporation, Haemonetics Corporation, and Macopharma, and others

Key Segment

By Product, Application, Blood Components, End-User, and Region

Major Regions Covered

North America, Europe, Asia Pacific, Latin America, and the Middle East & Africa

Purchase Options

Request customized purchase options to meet your research needs. Explore purchase options

logo Regional Analysis

Geographically, the blood and blood components market is segmented into North America, Asia-Pacific, Europe, Latin America, and the Middle East & Africa. In terms of region, the Asia-Pacific blood and blood components market is anticipated to record the fastest-growing market in the forthcoming years.

The high growth in this regional market can be attributed to the existence of many donors along with the highly developed healthcare infrastructure in the region. Furthermore, the favorable government initiatives and various untapped opportunities in the promising markets of India and China are some other key factors projected to propel the Asia-Pacific region during the forecast period.

logo Competitive Players

Several market players in the global blood and blood components market cover :

  • Medtronic Plc.
  • American Red Cross
  • Abbott Laboratories
  • Australian Red Cross Blood Service
  • Blood Centers of America
  • German Red Cross
  • Becton Dickinson and Company
  • Nipro Medical Corporation
  • AVIS National
  • American Association of Blood Banks
  • National Blood Authority Australia
  • Baxter International Inc.
  • Vitalant
  • CSL Behring
  • Novartis
  • Immucor
  • Novo Nordisk
  • Roche Diagnostics
  • Ortho Clinical Diagnostics
  • Grifols International SA
  • Fresenius Kabi
  • Medimmune (AstraZeneca)
  • Thermo Fisher Scientific Inc.
  • Sarstedt AG & Co.
  • Terumo Corporation
  • Haemonetics Corporation
  • Macopharma

logo Product Segment Analysis

  • Whole Blood
  • Blood Components

logo Application Segment Analysis

  • Anemia
  • Trauma & Surgery
  • Cancer Treatment
  • Bleeding Disorders

logo Blood Components Segment Analysis

  • Red Blood Cells
  • Platelets
  • Plasma
  • White Blood Cells

logo End-User Segment Analysis

  • Hospitals
  • Ambulatory Surgical Centers
  • Others

logo Regional Segment Analysis

  • North America
    • U.S.
    • Canada
  • Europe
    • U.K.
    • France
    • Germany
    • Rest of Europe
  • Asia Pacific
    • China
    • Japan
    • India
    • South Korea
    • Rest of Asia Pacific
  • Latin America
    • Brazil
    • Rest of Latin America
  • The Middle East and Africa
    • GCC Countries
    • South Africa
    • Rest of Middle East Africa

Table of Content

  1. Chapter 1 Executive Summary
    1. 1.1. Introduction of Blood and Blood Components
    2. 1.2. Global Blood and Blood Components Market, 2019 & 2026 (USD Million)
    3. 1.3. Global Blood and Blood Components Market, 2016 – 2026(USD Million)
    4. 1.4. Global Blood and Blood Components MarketAbsolute Revenue Opportunity, 2016 – 2026(USD Million)
    5. 1.5. Global Blood and Blood Components MarketIncremental Revenue Opportunity, 2020 – 2026(USD Million)
  2. Chapter 2 Blood and Blood Components Market – Product Analysis
    1. 2.1. Global Blood and Blood Components Market – Product Overview
    2. 2.2. Global Blood and Blood Components Market Share, by Product, 2019 & 2026(USD Million)
    3. 2.3. Whole Blood
      1. 2.3.1. Global Whole Blood Blood and Blood Components Market, 2016 – 2026(USD Million)
    4. 2.4. Blood Components
      1. 2.4.1. Global Blood Components Blood and Blood Components Market, 2016 – 2026(USD Million)
  3. Chapter 3 Blood and Blood Components Market – Application Analysis
    1. 3.1. Global Blood and Blood Components Market – Application Overview
    2. 3.2. Global Blood and Blood Components Market Share, by Application, 2019 & 2026(USD Million)
    3. 3.3. Anemia
      1. 3.3.1. Global Anemia Blood and Blood Components Market, 2016 – 2026(USD Million)
    4. 3.4. Trauma & Surgery
      1. 3.4.1. Global Trauma & Surgery Blood and Blood Components Market, 2016 – 2026(USD Million)
    5. 3.5. Cancer Treatment
      1. 3.5.1. Global Cancer Treatment Blood and Blood Components Market, 2016 – 2026(USD Million)
    6. 3.6. Bleeding Disorders
      1. 3.6.1. Global Bleeding Disorders Blood and Blood Components Market, 2016 – 2026(USD Million)
  4. Chapter 4 Blood and Blood Components Market – Blood Components Analysis
    1. 4.1. Global Blood and Blood Components Market – Blood Components Overview
    2. 4.2. Global Blood and Blood Components Market Share, by Blood Components, 2019 & 2026(USD Million)
    3. 4.3. Red Blood Cells
      1. 4.3.1. Global Red Blood Cells Blood and Blood Components Market, 2016 – 2026(USD Million)
    4. 4.4. Platelets
      1. 4.4.1. Global Platelets Blood and Blood Components Market, 2016 – 2026(USD Million)
    5. 4.5. Plasma
      1. 4.5.1. Global Plasma Blood and Blood Components Market, 2016 – 2026(USD Million)
    6. 4.6. White Blood Cells
      1. 4.6.1. Global White Blood Cells Blood and Blood Components Market, 2016 – 2026(USD Million)
  5. Chapter 5 Blood and Blood Components Market – End-User Analysis
    1. 5.1. Global Blood and Blood Components Market – End-User Overview
    2. 5.2. Global Blood and Blood Components Market Share, by End-User, 2019 & 2026(USD Million)
    3. 5.3. Hospitals
      1. 5.3.1. Global Hospitals Blood and Blood Components Market, 2016 – 2026(USD Million)
    4. 5.4. Ambulatory Surgical Centers
      1. 5.4.1. Global Ambulatory Surgical Centers Blood and Blood Components Market, 2016 – 2026(USD Million)
    5. 5.5. Others
      1. 5.5.1. Global Others Blood and Blood Components Market, 2016 – 2026(USD Million)
  6. Chapter 6 Blood and Blood Components Market – Regional Analysis
    1. 6.1. Global Blood and Blood Components Market Regional Overview
    2. 6.2. Global Blood and Blood Components Market Share, by Region, 2019 & 2026(USD Million)
    3. 6.3. North America
      1. 6.3.1. North America Blood and Blood Components Market, 2016 – 2026(USD Million)
        1. 6.3.1.1. North America Blood and Blood Components Market, by Country, 2016 - 2026(USD Million)
      2. 6.3.2. North America Blood and Blood Components Market, by Product, 2016 – 2026
        1. 6.3.2.1. North America Blood and Blood Components Market, by Product, 2016 – 2026(USD Million)
      3. 6.3.3. North America Blood and Blood Components Market, by Application, 2016 – 2026
        1. 6.3.3.1. North America Blood and Blood Components Market, by Application, 2016 – 2026(USD Million)
      4. 6.3.4. North America Blood and Blood Components Market, by Blood Components, 2016 – 2026
        1. 6.3.4.1. North America Blood and Blood Components Market, by Blood Components, 2016 – 2026(USD Million)
      5. 6.3.5. North America Blood and Blood Components Market, by End-User, 2016 – 2026
        1. 6.3.5.1. North America Blood and Blood Components Market, by End-User, 2016 – 2026(USD Million)
      6. 6.3.6. U.S.
        1. 6.3.6.1. U.S. Blood and Blood Components Market, 2016 – 2026(USD Million)
      7. 6.3.7. Canada
        1. 6.3.7.1. Canada Blood and Blood Components Market, 2016 – 2026(USD Million)
    4. 6.4. Europe
      1. 6.4.1. Europe Blood and Blood Components Market, 2016 – 2026(USD Million)
        1. 6.4.1.1. Europe Blood and Blood Components Market, by Country, 2016 - 2026(USD Million)
      2. 6.4.2. Europe Blood and Blood Components Market, by Product, 2016 – 2026
        1. 6.4.2.1. Europe Blood and Blood Components Market, by Product, 2016 – 2026(USD Million)
      3. 6.4.3. Europe Blood and Blood Components Market, by Application, 2016 – 2026
        1. 6.4.3.1. Europe Blood and Blood Components Market, by Application, 2016 – 2026(USD Million)
      4. 6.4.4. Europe Blood and Blood Components Market, by Blood Components, 2016 – 2026
        1. 6.4.4.1. Europe Blood and Blood Components Market, by Blood Components, 2016 – 2026(USD Million)
      5. 6.4.5. Europe Blood and Blood Components Market, by End-User, 2016 – 2026
        1. 6.4.5.1. Europe Blood and Blood Components Market, by End-User, 2016 – 2026(USD Million)
      6. 6.4.6. Germany
        1. 6.4.6.1. Germany Blood and Blood Components Market, 2016 – 2026(USD Million)
      7. 6.4.7. France
        1. 6.4.7.1. France Blood and Blood Components Market, 2016 – 2026(USD Million)
      8. 6.4.8. U.K.
        1. 6.4.8.1. U.K. Blood and Blood Components Market, 2016 – 2026(USD Million)
      9. 6.4.9. Italy
        1. 6.4.9.1. Italy Blood and Blood Components Market, 2016 – 2026(USD Million)
      10. 6.4.10. Spain
        1. 6.4.10.1. Spain Blood and Blood Components Market, 2016 – 2026(USD Million)
      11. 6.4.11. Rest of Europe
        1. 6.4.11.1. Rest of Europe Blood and Blood Components Market, 2016 – 2026(USD Million)
    5. 6.5. Asia Pacific
      1. 6.5.1. Asia Pacific Blood and Blood Components Market, 2016 – 2026(USD Million)
        1. 6.5.1.1. Asia Pacific Blood and Blood Components Market, by Country, 2016 - 2026(USD Million)
      2. 6.5.2. Asia Pacific Blood and Blood Components Market, by Product, 2016 – 2026
        1. 6.5.2.1. Asia Pacific Blood and Blood Components Market, by Product, 2016 – 2026(USD Million)
      3. 6.5.3. Asia Pacific Blood and Blood Components Market, by Application, 2016 – 2026
        1. 6.5.3.1. Asia Pacific Blood and Blood Components Market, by Application, 2016 – 2026(USD Million)
      4. 6.5.4. Asia Pacific Blood and Blood Components Market, by Blood Components, 2016 – 2026
        1. 6.5.4.1. Asia Pacific Blood and Blood Components Market, by Blood Components, 2016 – 2026(USD Million)
      5. 6.5.5. Asia Pacific Blood and Blood Components Market, by End-User, 2016 – 2026
        1. 6.5.5.1. Asia Pacific Blood and Blood Components Market, by End-User, 2016 – 2026(USD Million)
      6. 6.5.6. China
        1. 6.5.6.1. China Blood and Blood Components Market, 2016 – 2026(USD Million)
      7. 6.5.7. Japan
        1. 6.5.7.1. Japan Blood and Blood Components Market, 2016 – 2026(USD Million)
      8. 6.5.8. India
        1. 6.5.8.1. India Blood and Blood Components Market, 2016 – 2026(USD Million)
      9. 6.5.9. South Korea
        1. 6.5.9.1. South Korea Blood and Blood Components Market, 2016 – 2026(USD Million)
      10. 6.5.10. South-East Asia
        1. 6.5.10.1. South-East Asia Blood and Blood Components Market, 2016 – 2026(USD Million)
      11. 6.5.11. Rest of Asia Pacific
        1. 6.5.11.1. Rest of Asia Pacific Blood and Blood Components Market, 2016 – 2026(USD Million)
    6. 6.6. Latin America
      1. 6.6.1. Latin America Blood and Blood Components Market, 2016 – 2026(USD Million)
        1. 6.6.1.1. Latin America Blood and Blood Components Market, by Country, 2016 - 2026(USD Million)
      2. 6.6.2. Latin America Blood and Blood Components Market, by Product, 2016 – 2026
        1. 6.6.2.1. Latin America Blood and Blood Components Market, by Product, 2016 – 2026(USD Million)
      3. 6.6.3. Latin America Blood and Blood Components Market, by Application, 2016 – 2026
        1. 6.6.3.1. Latin America Blood and Blood Components Market, by Application, 2016 – 2026(USD Million)
      4. 6.6.4. Latin America Blood and Blood Components Market, by Blood Components, 2016 – 2026
        1. 6.6.4.1. Latin America Blood and Blood Components Market, by Blood Components, 2016 – 2026(USD Million)
      5. 6.6.5. Latin America Blood and Blood Components Market, by End-User, 2016 – 2026
        1. 6.6.5.1. Latin America Blood and Blood Components Market, by End-User, 2016 – 2026(USD Million)
      6. 6.6.6. Brazil
        1. 6.6.6.1. Brazil Blood and Blood Components Market, 2016 – 2026(USD Million)
      7. 6.6.7. Mexico
        1. 6.6.7.1. Mexico Blood and Blood Components Market, 2016 – 2026(USD Million)
      8. 6.6.8. Rest of Latin America
        1. 6.6.8.1. Rest of Latin America Blood and Blood Components Market, 2016 – 2026(USD Million)
    7. 6.7. The Middle-East and Africa
      1. 6.7.1. The Middle-East and Africa Blood and Blood Components Market, 2016 – 2026(USD Million)
        1. 6.7.1.1. The Middle-East and Africa Blood and Blood Components Market, by Country, 2016 - 2026(USD Million)
      2. 6.7.2. The Middle-East and Africa Blood and Blood Components Market, by Product, 2016 – 2026
        1. 6.7.2.1. The Middle-East and Africa Blood and Blood Components Market, by Product, 2016 – 2026(USD Million)
      3. 6.7.3. The Middle-East and Africa Blood and Blood Components Market, by Application, 2016 – 2026
        1. 6.7.3.1. The Middle-East and Africa Blood and Blood Components Market, by Application, 2016 – 2026(USD Million)
      4. 6.7.4. The Middle-East and Africa Blood and Blood Components Market, by Blood Components, 2016 – 2026
        1. 6.7.4.1. The Middle-East and Africa Blood and Blood Components Market, by Blood Components, 2016 – 2026(USD Million)
      5. 6.7.5. The Middle-East and Africa Blood and Blood Components Market, by End-User, 2016 – 2026
        1. 6.7.5.1. The Middle-East and Africa Blood and Blood Components Market, by End-User, 2016 – 2026(USD Million)
      6. 6.7.6. GCC Countries
        1. 6.7.6.1. GCC Countries Blood and Blood Components Market, 2016 – 2026(USD Million)
      7. 6.7.7. South Africa
        1. 6.7.7.1. South Africa Blood and Blood Components Market, 2016 – 2026(USD Million)
      8. 6.7.8. Rest of Middle-East Africa
        1. 6.7.8.1. Rest of Middle-East Africa Blood and Blood Components Market, 2016 – 2026(USD Million)
  7. Chapter 7 Blood and Blood Components Market – Competitive Landscape
    1. 7.1. Competitor Market Share – Revenue
    2. 7.2. Market Concentration Rate Analysis, Top 3 and Top 5 Players
    3. 7.3. Strategic Developments
      1. 7.3.1. Acquisitions and Mergers
      2. 7.3.2. New Products
      3. 7.3.3. Research & Development Activities
  8. Chapter 8 Company Profiles
    1. 8.1. Medtronic Plc.
      1. 8.1.1. Company Overview
      2. 8.1.2. Product/ServicePortfolio
      3. 8.1.3. Medtronic Plc. Sales, Revenue, and Gross Margin
      4. 8.1.4. Medtronic Plc. Revenue and Growth Rate
      5. 8.1.5. Medtronic Plc. Market Share
      6. 8.1.6. Recent Initiatives, Funding/VC Activities, and Technological Innovations
    2. 8.2. American Red Cross
      1. 8.2.1. Company Overview
      2. 8.2.2. Product/ServicePortfolio
      3. 8.2.3. American Red Cross Sales, Revenue, and Gross Margin
      4. 8.2.4. American Red Cross Revenue and Growth Rate
      5. 8.2.5. American Red Cross Market Share
      6. 8.2.6. Recent Initiatives, Funding/VC Activities, and Technological Innovations
    3. 8.3. Abbott Laboratories
      1. 8.3.1. Company Overview
      2. 8.3.2. Product/ServicePortfolio
      3. 8.3.3. Abbott Laboratories Sales, Revenue, and Gross Margin
      4. 8.3.4. Abbott Laboratories Revenue and Growth Rate
      5. 8.3.5. Abbott Laboratories Market Share
      6. 8.3.6. Recent Initiatives, Funding/VC Activities, and Technological Innovations
    4. 8.4. Australian Red Cross Blood Service
      1. 8.4.1. Company Overview
      2. 8.4.2. Product/ServicePortfolio
      3. 8.4.3. Australian Red Cross Blood Service Sales, Revenue, and Gross Margin
      4. 8.4.4. Australian Red Cross Blood Service Revenue and Growth Rate
      5. 8.4.5. Australian Red Cross Blood Service Market Share
      6. 8.4.6. Recent Initiatives, Funding/VC Activities, and Technological Innovations
    5. 8.5. Blood Centers of America
      1. 8.5.1. Company Overview
      2. 8.5.2. Product/ServicePortfolio
      3. 8.5.3. Blood Centers of America Sales, Revenue, and Gross Margin
      4. 8.5.4. Blood Centers of America Revenue and Growth Rate
      5. 8.5.5. Blood Centers of America Market Share
      6. 8.5.6. Recent Initiatives, Funding/VC Activities, and Technological Innovations
    6. 8.6. German Red Cross
      1. 8.6.1. Company Overview
      2. 8.6.2. Product/ServicePortfolio
      3. 8.6.3. German Red Cross Sales, Revenue, and Gross Margin
      4. 8.6.4. German Red Cross Revenue and Growth Rate
      5. 8.6.5. German Red Cross Market Share
      6. 8.6.6. Recent Initiatives, Funding/VC Activities, and Technological Innovations
    7. 8.7. Becton Dickinson and Company
      1. 8.7.1. Company Overview
      2. 8.7.2. Product/ServicePortfolio
      3. 8.7.3. Becton Dickinson and Company Sales, Revenue, and Gross Margin
      4. 8.7.4. Becton Dickinson and Company Revenue and Growth Rate
      5. 8.7.5. Becton Dickinson and Company Market Share
      6. 8.7.6. Recent Initiatives, Funding/VC Activities, and Technological Innovations
    8. 8.8. Nipro Medical Corporation
      1. 8.8.1. Company Overview
      2. 8.8.2. Product/ServicePortfolio
      3. 8.8.3. Nipro Medical Corporation Sales, Revenue, and Gross Margin
      4. 8.8.4. Nipro Medical Corporation Revenue and Growth Rate
      5. 8.8.5. Nipro Medical Corporation Market Share
      6. 8.8.6. Recent Initiatives, Funding/VC Activities, and Technological Innovations
    9. 8.9. AVIS National
      1. 8.9.1. Company Overview
      2. 8.9.2. Product/ServicePortfolio
      3. 8.9.3. AVIS National Sales, Revenue, and Gross Margin
      4. 8.9.4. AVIS National Revenue and Growth Rate
      5. 8.9.5. AVIS National Market Share
      6. 8.9.6. Recent Initiatives, Funding/VC Activities, and Technological Innovations
    10. 8.10. American Association of Blood Banks
      1. 8.10.1. Company Overview
      2. 8.10.2. Product/ServicePortfolio
      3. 8.10.3. American Association of Blood Banks Sales, Revenue, and Gross Margin
      4. 8.10.4. American Association of Blood Banks Revenue and Growth Rate
      5. 8.10.5. American Association of Blood Banks Market Share
      6. 8.10.6. Recent Initiatives, Funding/VC Activities, and Technological Innovations
    11. 8.11. National Blood Authority Australia
      1. 8.11.1. Company Overview
      2. 8.11.2. Product/ServicePortfolio
      3. 8.11.3. National Blood Authority Australia Sales, Revenue, and Gross Margin
      4. 8.11.4. National Blood Authority Australia Revenue and Growth Rate
      5. 8.11.5. National Blood Authority Australia Market Share
      6. 8.11.6. Recent Initiatives, Funding/VC Activities, and Technological Innovations
    12. 8.12. Baxter International Inc.
      1. 8.12.1. Company Overview
      2. 8.12.2. Product/ServicePortfolio
      3. 8.12.3. Baxter International Inc. Sales, Revenue, and Gross Margin
      4. 8.12.4. Baxter International Inc. Revenue and Growth Rate
      5. 8.12.5. Baxter International Inc. Market Share
      6. 8.12.6. Recent Initiatives, Funding/VC Activities, and Technological Innovations
    13. 8.13. Vitalant
      1. 8.13.1. Company Overview
      2. 8.13.2. Product/ServicePortfolio
      3. 8.13.3. Vitalant Sales, Revenue, and Gross Margin
      4. 8.13.4. Vitalant Revenue and Growth Rate
      5. 8.13.5. Vitalant Market Share
      6. 8.13.6. Recent Initiatives, Funding/VC Activities, and Technological Innovations
    14. 8.14. CSL Behring
      1. 8.14.1. Company Overview
      2. 8.14.2. Product/ServicePortfolio
      3. 8.14.3. CSL Behring Sales, Revenue, and Gross Margin
      4. 8.14.4. CSL Behring Revenue and Growth Rate
      5. 8.14.5. CSL Behring Market Share
      6. 8.14.6. Recent Initiatives, Funding/VC Activities, and Technological Innovations
    15. 8.15. Novartis
      1. 8.15.1. Company Overview
      2. 8.15.2. Product/ServicePortfolio
      3. 8.15.3. Novartis Sales, Revenue, and Gross Margin
      4. 8.15.4. Novartis Revenue and Growth Rate
      5. 8.15.5. Novartis Market Share
      6. 8.15.6. Recent Initiatives, Funding/VC Activities, and Technological Innovations
    16. 8.16. Immucor
      1. 8.16.1. Company Overview
      2. 8.16.2. Product/ServicePortfolio
      3. 8.16.3. Immucor Sales, Revenue, and Gross Margin
      4. 8.16.4. Immucor Revenue and Growth Rate
      5. 8.16.5. Immucor Market Share
      6. 8.16.6. Recent Initiatives, Funding/VC Activities, and Technological Innovations
    17. 8.17. Novo Nordisk
      1. 8.17.1. Company Overview
      2. 8.17.2. Product/ServicePortfolio
      3. 8.17.3. Novo Nordisk Sales, Revenue, and Gross Margin
      4. 8.17.4. Novo Nordisk Revenue and Growth Rate
      5. 8.17.5. Novo Nordisk Market Share
      6. 8.17.6. Recent Initiatives, Funding/VC Activities, and Technological Innovations
    18. 8.18. Roche Diagnostics
      1. 8.18.1. Company Overview
      2. 8.18.2. Product/ServicePortfolio
      3. 8.18.3. Roche Diagnostics Sales, Revenue, and Gross Margin
      4. 8.18.4. Roche Diagnostics Revenue and Growth Rate
      5. 8.18.5. Roche Diagnostics Market Share
      6. 8.18.6. Recent Initiatives, Funding/VC Activities, and Technological Innovations
    19. 8.19. Ortho Clinical Diagnostics
      1. 8.19.1. Company Overview
      2. 8.19.2. Product/ServicePortfolio
      3. 8.19.3. Ortho Clinical Diagnostics Sales, Revenue, and Gross Margin
      4. 8.19.4. Ortho Clinical Diagnostics Revenue and Growth Rate
      5. 8.19.5. Ortho Clinical Diagnostics Market Share
      6. 8.19.6. Recent Initiatives, Funding/VC Activities, and Technological Innovations
    20. 8.20. Grifols International SA
      1. 8.20.1. Company Overview
      2. 8.20.2. Product/ServicePortfolio
      3. 8.20.3. Grifols International SA Sales, Revenue, and Gross Margin
      4. 8.20.4. Grifols International SA Revenue and Growth Rate
      5. 8.20.5. Grifols International SA Market Share
      6. 8.20.6. Recent Initiatives, Funding/VC Activities, and Technological Innovations
    21. 8.21. Fresenius Kabi
      1. 8.21.1. Company Overview
      2. 8.21.2. Product/ServicePortfolio
      3. 8.21.3. Fresenius Kabi Sales, Revenue, and Gross Margin
      4. 8.21.4. Fresenius Kabi Revenue and Growth Rate
      5. 8.21.5. Fresenius Kabi Market Share
      6. 8.21.6. Recent Initiatives, Funding/VC Activities, and Technological Innovations
    22. 8.22. Medimmune (AstraZeneca)
      1. 8.22.1. Company Overview
      2. 8.22.2. Product/ServicePortfolio
      3. 8.22.3. Medimmune (AstraZeneca) Sales, Revenue, and Gross Margin
      4. 8.22.4. Medimmune (AstraZeneca) Revenue and Growth Rate
      5. 8.22.5. Medimmune (AstraZeneca) Market Share
      6. 8.22.6. Recent Initiatives, Funding/VC Activities, and Technological Innovations
    23. 8.23. Thermo Fisher Scientific Inc.
      1. 8.23.1. Company Overview
      2. 8.23.2. Product/ServicePortfolio
      3. 8.23.3. Thermo Fisher Scientific Inc. Sales, Revenue, and Gross Margin
      4. 8.23.4. Thermo Fisher Scientific Inc. Revenue and Growth Rate
      5. 8.23.5. Thermo Fisher Scientific Inc. Market Share
      6. 8.23.6. Recent Initiatives, Funding/VC Activities, and Technological Innovations
    24. 8.24. Sarstedt AG & Co.
      1. 8.24.1. Company Overview
      2. 8.24.2. Product/ServicePortfolio
      3. 8.24.3. Sarstedt AG & Co. Sales, Revenue, and Gross Margin
      4. 8.24.4. Sarstedt AG & Co. Revenue and Growth Rate
      5. 8.24.5. Sarstedt AG & Co. Market Share
      6. 8.24.6. Recent Initiatives, Funding/VC Activities, and Technological Innovations
    25. 8.25. Terumo Corporation
      1. 8.25.1. Company Overview
      2. 8.25.2. Product/ServicePortfolio
      3. 8.25.3. Terumo Corporation Sales, Revenue, and Gross Margin
      4. 8.25.4. Terumo Corporation Revenue and Growth Rate
      5. 8.25.5. Terumo Corporation Market Share
      6. 8.25.6. Recent Initiatives, Funding/VC Activities, and Technological Innovations
    26. 8.26. Haemonetics Corporation
      1. 8.26.1. Company Overview
      2. 8.26.2. Product/ServicePortfolio
      3. 8.26.3. Haemonetics Corporation Sales, Revenue, and Gross Margin
      4. 8.26.4. Haemonetics Corporation Revenue and Growth Rate
      5. 8.26.5. Haemonetics Corporation Market Share
      6. 8.26.6. Recent Initiatives, Funding/VC Activities, and Technological Innovations
    27. 8.27. Macopharma
      1. 8.27.1. Company Overview
      2. 8.27.2. Product/ServicePortfolio
      3. 8.27.3. Macopharma Sales, Revenue, and Gross Margin
      4. 8.27.4. Macopharma Revenue and Growth Rate
      5. 8.27.5. Macopharma Market Share
      6. 8.27.6. Recent Initiatives, Funding/VC Activities, and Technological Innovations
  9. Chapter 9 Blood and Blood Components — Industry Analysis
    1. 9.1. Introduction and Taxonomy
    2. 9.2. Blood and Blood Components Market – Key Trends
      1. 9.2.1. Market Drivers
      2. 9.2.2. Market Restraints
      3. 9.2.3. Market Opportunities
    3. 9.3. Value Chain Analysis
    4. 9.4. Key Mandates and Regulations
    5. 9.5. Technology Roadmap and Timeline
    6. 9.6. Blood and Blood Components Market – Attractiveness Analysis
      1. 9.6.1. By Product
      2. 9.6.2. By Application
      3. 9.6.3. By Blood Components
      4. 9.6.4. By End-User
      5. 9.6.5. By Region
  10. Chapter 10 Industrial Chain, Sourcing Strategy, and Downstream Buyers
    1. 10.1. Blood and Blood Components Industrial Chain Analysis
    2. 10.2. Downstream Buyers
    3. 10.3. Distributors/Traders List
  11. Chapter 11 Marketing Strategy Analysis
    1. 11.1. Marketing Channel
    2. 11.2. Direct Marketing
    3. 11.3. Indirect Marketing
    4. 11.4. Marketing Channel Development Trends
    5. 11.5. Economic/Political Environmental Change
  12. Chapter 12 Report Conclusion& Key Insights
    1. 12.1. Key Insights from Primary Interviews & Surveys Respondents
    2. 12.2. Key Takeaways from Analysts, Consultants, and Industry Leaders
  13. Chapter 13 Research Approach & Methodology
    1. 13.1. Report Description
    2. 13.2. Research Scope
    3. 13.3. Research Methodology
      1. 13.3.1. Secondary Research
      2. 13.3.2. Primary Research
      3. 13.3.3. Statistical Models
        1. 13.3.3.1. Company Share Analysis Model
        2. 13.3.3.2. Revenue Based Modeling
      4. 13.3.4. Research Limitations

      List of Figures

      Fig.1	Product Picture of  Blood and Blood Components
      Fig.2	Global  Blood and Blood Components  Market, 2016 – 2026(USD Million)
      Fig.3	Global  Blood and Blood Components  MarketAbsolute Revenue Opportunity, 2016 – 2026(USD Million)
      Fig.4	Global  Blood and Blood Components  MarketIncremental Revenue Opportunity, 2020 – 2026(USD Million)
      Fig.5	Global  Blood and Blood Components  Market Share, by Product, 2019 & 2026(USD Million)
      Fig.6	Global Whole Blood Blood and Blood Components  Market, 2016 – 2026(USD Million)
      Fig.7	Global Blood Components Blood and Blood Components  Market, 2016 – 2026(USD Million)
      Fig.8	Global  Blood and Blood Components  Market Share, by Application, 2019 & 2026(USD Million)
      Fig.9	Global Anemia Blood and Blood Components  Market, 2016 – 2026(USD Million)
      Fig.10	Global Trauma & Surgery Blood and Blood Components  Market, 2016 – 2026(USD Million)
      Fig.11	Global Cancer Treatment Blood and Blood Components  Market, 2016 – 2026(USD Million)
      Fig.12	Global Bleeding Disorders Blood and Blood Components  Market, 2016 – 2026(USD Million)
      Fig.13	Global  Blood and Blood Components  Market Share, by Blood Components, 2019 & 2026(USD Million)
      Fig.14	Global Red Blood Cells Blood and Blood Components  Market, 2016 – 2026(USD Million)
      Fig.15	Global Platelets Blood and Blood Components  Market, 2016 – 2026(USD Million)
      Fig.16	Global Plasma Blood and Blood Components  Market, 2016 – 2026(USD Million)
      Fig.17	Global White Blood Cells Blood and Blood Components  Market, 2016 – 2026(USD Million)
      Fig.18	Global  Blood and Blood Components  Market Share, by End-User, 2019 & 2026(USD Million)
      Fig.19	Global Hospitals Blood and Blood Components  Market, 2016 – 2026(USD Million)
      Fig.20	Global Ambulatory Surgical Centers Blood and Blood Components  Market, 2016 – 2026(USD Million)
      Fig.21	Global Others Blood and Blood Components  Market, 2016 – 2026(USD Million)
      Fig.22	Global  Blood and Blood Components  MarketShare, by Region, 2019 & 2026(USD Million)
      Fig.23	North America Blood and Blood Components  Market, 2016 – 2026(USD Million)
      Fig.24	U.S. Blood and Blood Components  Market, 2016 – 2026(USD Million)
      Fig.25	Canada Blood and Blood Components  Market, 2016 – 2026(USD Million)
      Fig.26	Europe Blood and Blood Components  Market, 2016 – 2026(USD Million)
      Fig.27	Germany Blood and Blood Components  Market, 2016 – 2026(USD Million)
      Fig.28	France Blood and Blood Components  Market, 2016 – 2026(USD Million)
      Fig.29	U.K. Blood and Blood Components  Market, 2016 – 2026(USD Million)
      Fig.30	Italy Blood and Blood Components  Market, 2016 – 2026(USD Million)
      Fig.31	Spain Blood and Blood Components  Market, 2016 – 2026(USD Million)
      Fig.32	Rest of Europe Blood and Blood Components  Market, 2016 – 2026(USD Million)
      Fig.33	Asia Pacific Blood and Blood Components  Market, 2016 – 2026(USD Million)
      Fig.34	China Blood and Blood Components  Market, 2016 – 2026(USD Million)
      Fig.35	Japan Blood and Blood Components  Market, 2016 – 2026(USD Million)
      Fig.36	India Blood and Blood Components  Market, 2016 – 2026(USD Million)
      Fig.37	South  Korea Blood and Blood Components  Market, 2016 – 2026(USD Million)
      Fig.38	South-East Asia Blood and Blood Components  Market, 2016 – 2026(USD Million)
      Fig.39	Rest of Asia Pacific Blood and Blood Components  Market, 2016 – 2026(USD Million)
      Fig.40	Latin America Blood and Blood Components  Market, 2016 – 2026(USD Million)
      Fig.41	Brazil Blood and Blood Components  Market, 2016 – 2026(USD Million)
      Fig.42	Mexico Blood and Blood Components  Market, 2016 – 2026(USD Million)
      Fig.43	Rest of Latin America Blood and Blood Components  Market, 2016 – 2026(USD Million)
      Fig.44	The Middle-East and Africa Blood and Blood Components  Market, 2016 – 2026(USD Million)
      Fig.45	GCC Countries Blood and Blood Components  Market, 2016 – 2026(USD Million)
      Fig.46	South Africa Blood and Blood Components  Market, 2016 – 2026(USD Million)
      Fig.47	Rest of Middle-East Africa Blood and Blood Components  Market, 2016 – 2026(USD Million)
      Fig.48	Competitor Market Share – Revenue
      Fig.49	Medtronic Plc. Revenue and Growth Rate
      Fig.50	Medtronic Plc. Market Share
      Fig.51	American Red Cross Revenue and Growth Rate
      Fig.52	American Red Cross Market Share
      Fig.53	Abbott Laboratories Revenue and Growth Rate
      Fig.54	Abbott Laboratories Market Share
      Fig.55	Australian Red Cross Blood Service Revenue and Growth Rate
      Fig.56	Australian Red Cross Blood Service Market Share
      Fig.57	Blood Centers of America Revenue and Growth Rate
      Fig.58	Blood Centers of America Market Share
      Fig.59	German Red Cross Revenue and Growth Rate
      Fig.60	German Red Cross Market Share
      Fig.61	Becton Dickinson and Company Revenue and Growth Rate
      Fig.62	Becton Dickinson and Company Market Share
      Fig.63	Nipro Medical Corporation Revenue and Growth Rate
      Fig.64	Nipro Medical Corporation Market Share
      Fig.65	AVIS National Revenue and Growth Rate
      Fig.66	AVIS National Market Share
      Fig.67	American Association of Blood Banks Revenue and Growth Rate
      Fig.68	American Association of Blood Banks Market Share
      Fig.69	National Blood Authority Australia Revenue and Growth Rate
      Fig.70	National Blood Authority Australia Market Share
      Fig.71	Baxter International Inc. Revenue and Growth Rate
      Fig.72	Baxter International Inc. Market Share
      Fig.73	Vitalant Revenue and Growth Rate
      Fig.74	Vitalant Market Share
      Fig.75	CSL Behring Revenue and Growth Rate
      Fig.76	CSL Behring Market Share
      Fig.77	Novartis Revenue and Growth Rate
      Fig.78	Novartis Market Share
      Fig.79	Immucor Revenue and Growth Rate
      Fig.80	Immucor Market Share
      Fig.81	Novo Nordisk Revenue and Growth Rate
      Fig.82	Novo Nordisk Market Share
      Fig.83	Roche Diagnostics Revenue and Growth Rate
      Fig.84	Roche Diagnostics Market Share
      Fig.85	Ortho Clinical Diagnostics Revenue and Growth Rate
      Fig.86	Ortho Clinical Diagnostics Market Share
      Fig.87	Grifols International SA Revenue and Growth Rate
      Fig.88	Grifols International SA Market Share
      Fig.89	Fresenius Kabi Revenue and Growth Rate
      Fig.90	Fresenius Kabi Market Share
      Fig.91	Medimmune (AstraZeneca) Revenue and Growth Rate
      Fig.92	Medimmune (AstraZeneca) Market Share
      Fig.93	Thermo Fisher Scientific Inc. Revenue and Growth Rate
      Fig.94	Thermo Fisher Scientific Inc. Market Share
      Fig.95	Sarstedt AG & Co. Revenue and Growth Rate
      Fig.96	Sarstedt AG & Co. Market Share
      Fig.97	Terumo Corporation Revenue and Growth Rate
      Fig.98	Terumo Corporation Market Share
      Fig.99	Haemonetics Corporation Revenue and Growth Rate
      Fig.100	Haemonetics Corporation Market Share
      Fig.101	Macopharma Revenue and Growth Rate
      Fig.102	Macopharma Market Share
      Fig.103	Market Dynamics
      Fig.104	Global  Blood and Blood Components  – Value Chain Analysis
      Fig.105	Key Mandates and Regulations
      Fig.106	Technology Roadmap and Timeline
      Fig.107	Market Attractiveness Analysis – By Product
      Fig.108	Market Attractiveness Analysis – By Application
      Fig.109	Market Attractiveness Analysis – By Blood Components
      Fig.110	Market Attractiveness Analysis – By End-User
      Fig.111	Market Attractiveness Analysis – By Region
      Fig.112	Blood and Blood Components  Industrial Chain Analysis
      Fig.113	Market Channels
      Fig.114	Marketing Channel Development Trend
      Fig.115	Growth in World Gross Product, 2008-2018
      

      List of Tables

      Table 1	Global  Blood and Blood Components Market, 2019 & 2026(USD Million)
      Table 2	Global  Blood and Blood Components Market, by Product, 2016 – 2026(USD Million)
      Table 3	Global  Blood and Blood Components Market, by Application, 2016 – 2026(USD Million)
      Table 4	Global  Blood and Blood Components Market, by Blood Components, 2016 – 2026(USD Million)
      Table 5	Global  Blood and Blood Components Market, by End-User, 2016 – 2026(USD Million)
      Table 6	Global  Blood and Blood Components Market, by Region, 2016 – 2026(USD Million)
      Table 7	North America Blood and Blood Components  Market, by Country, 2016 – 2026(USD Million)
      Table 8	North America Blood and Blood Components  Market, by Product, 2016 – 2026(USD Million)
      Table 9	North America Blood and Blood Components  Market, by Application, 2016 – 2026(USD Million)
      Table 10 North America Blood and Blood Components  Market, by Blood Components, 2016 – 2026(USD Million)
      Table 11 North America Blood and Blood Components  Market, by End-User, 2016 – 2026(USD Million)
      Table 12 Europe Blood and Blood Components  Market, by Country, 2016 – 2026(USD Million)
      Table 13 Europe Blood and Blood Components  Market, by Product, 2016 – 2026(USD Million)
      Table 14 Europe Blood and Blood Components  Market, by Application, 2016 – 2026(USD Million)
      Table 15 Europe Blood and Blood Components  Market, by Blood Components, 2016 – 2026(USD Million)
      Table 16 Europe Blood and Blood Components  Market, by End-User, 2016 – 2026(USD Million)
      Table 17 Asia Pacific Blood and Blood Components  Market, by Country, 2016 – 2026(USD Million)
      Table 18 Asia Pacific Blood and Blood Components  Market, by Product, 2016 – 2026(USD Million)
      Table 19 Asia Pacific Blood and Blood Components  Market, by Application, 2016 – 2026(USD Million)
      Table 20 Asia Pacific Blood and Blood Components  Market, by Blood Components, 2016 – 2026(USD Million)
      Table 21 Asia Pacific Blood and Blood Components  Market, by End-User, 2016 – 2026(USD Million)
      Table 22 Latin America Blood and Blood Components  Market, by Country, 2016 – 2026(USD Million)
      Table 23 Latin America Blood and Blood Components  Market, by Product, 2016 – 2026(USD Million)
      Table 24 Latin America Blood and Blood Components  Market, by Application, 2016 – 2026(USD Million)
      Table 25 Latin America Blood and Blood Components  Market, by Blood Components, 2016 – 2026(USD Million)
      Table 26 Latin America Blood and Blood Components  Market, by End-User, 2016 – 2026(USD Million)
      Table 27 The Middle-East and Africa Blood and Blood Components  Market, by Country, 2016 – 2026(USD Million)
      Table 28 The Middle-East and Africa Blood and Blood Components  Market, by Product, 2016 – 2026(USD Million)
      Table 29 The Middle-East and Africa Blood and Blood Components  Market, by Application, 2016 – 2026(USD Million)
      Table 30 The Middle-East and Africa Blood and Blood Components  Market, by Blood Components, 2016 – 2026(USD Million)
      Table 31 The Middle-East and Africa Blood and Blood Components  Market, by End-User, 2016 – 2026(USD Million)
      Table 32 Global  Blood and Blood Components  Market - Company Revenue Analysis, 2016 – 2019(USD Million)
      Table 33 Global  Blood and Blood Components  Market - Company Revenue Share Analysis, 2016 – 2019(%)
      Table 34 Acquisitions and Mergers
      Table 35 Market Drivers – Impact Analysis
      Table 36 Market Restraints
      Table 37 Market Opportunities
      Table 38 Major Buyers of  Blood and Blood Components
      Table 39 Distributors/Traders of  Blood and Blood Components  by Region
      

Industry Major Market Players

  • Medtronic Plc.
  • American Red Cross
  • Abbott Laboratories
  • Australian Red Cross Blood Service
  • Blood Centers of America
  • German Red Cross
  • Becton Dickinson and Company
  • Nipro Medical Corporation
  • AVIS National
  • American Association of Blood Banks
  • National Blood Authority Australia
  • Baxter International Inc.
  • Vitalant
  • CSL Behring
  • Novartis
  • Immucor
  • Novo Nordisk
  • Roche Diagnostics
  • Ortho Clinical Diagnostics
  • Grifols International SA
  • Fresenius Kabi
  • Medimmune (AstraZeneca)
  • Thermo Fisher Scientific Inc.
  • Sarstedt AG & Co.
  • Terumo Corporation
  • Haemonetics Corporation
  • Macopharma.