Search Market Research Report

Discover Our Latest Reports
Discover Our Featured Reports
Discover Top Selling Reports

Biotechnology Instruments Market Size, Share Global Analysis Report, , 2021 – 2026

report img

Biotechnology Instruments Market Product (Lab Automation Instruments, Life Science Consumables, IVD Instruments, and Medical Lasers), and End-User (Government & Academic Institutes, Pharmaceutical & Biotechnology Companies, Hospitals & Healthcare Facilities, and Others): Global Industry Perspective, Comprehensive Analysis, and Forecast, 2021 – 2026

Industry Insights

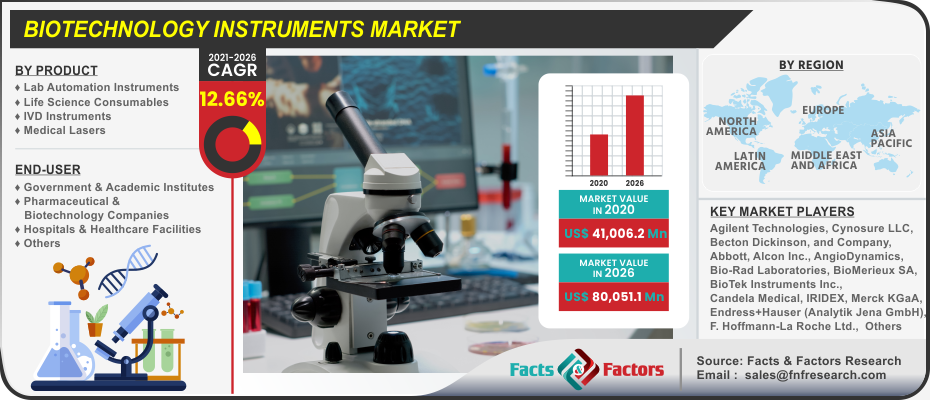
According to the report published by Facts and Factors, global demand for the biotechnology instruments market was estimated at approximately USD 41,006.2 Million in 2020 and is expected to generate revenue of around USD 80,051.1 Million by the end of 2026, growing at a CAGR of around 12.66% between 2021 and 2026.

logoMarket Overview

Biomedical Instrumentation or Bioinstrumentation refers to the application of biomedical engineering that is focusing on the devices and mechanics, which are used in measuring, evaluating, and treating biological systems.

logoIndustry Growth Factor

The global market of biotechnology instruments is expected to grow at a significant growth rate during the forecast period. The high adoption of point-of-care diagnostic devices is a key growth factor that is driving the growth of the global biotechnology instruments market. Moreover, the huge increase in demand for biotechnology products for the production of personalized medicine is likely to propel the global market of biotechnology instruments in the upcoming years.

Furthermore, the continuous developments in research and development have improved the capabilities of point-of-care (POC) testing systems. The novel equipment presents an extensive menu of tests that is able used in numerous hospital settings. The novel POC devices let real-time transmission of test results to the electronic medical record of patients to get an effortless review from physicians. The systems are designed in a method, where they can effortlessly meet the terms with changes in laboratory regulations.

Moreover, the increasing occurrence of chronic disorders such as diabetes, cancer, and heart diseases, cardiovascular disorders, as well as infectious diseases like COVID-19, and others, is also anticipated to boost the global biotechnology instruments market escalation.  Besides, the immense increase in the use of 2D and 3D cell cultures in the area of discovery and manufacture of novel drug compounds is propelling the expansion of the global biotechnology instruments market. The growing research activities surrounding gene expression, mainly since the initiation of the Human Genome Project, have further advanced the global demand for microarrays for studying the genotype or gene clusters expression, boosting the global market of biotechnology instruments.

Biotechnology Instruments Market

To know more about this report | Request Free Sample Copy

logoSegmentation Analysis

The global biotechnology instruments market has been segmented into product and end-user. On the basis of product, the global biotechnology instruments market has been classified into lab automation instruments, life science consumables, IVD instruments, and medical lasers. In terms of the end-user industry, the global biotechnology instruments market has been bifurcated into government & academic institutes, pharmaceutical & biotechnology companies, hospitals & healthcare facilities, and others.

logoReport Scope

Report Attribute

Details

Market Size in 2020

USD 41,006.2 Million

Projected Market Size in 2026

USD 80,051.1 Million

CAGR Growth Rate

12.66% CAGR

Base Year

2020

Forecast Years

2021-2026

Key Market Players

Agilent Technologies, Becton Dickinson, and Company, Abbott, Alcon Inc., AngioDynamics, Bio-Rad Laboratories, BioMerieux SA, BioTek Instruments Inc., Cynosure LLC, Candela Medical, Endress+Hauser (Analytik Jena GmbH), Danaher Corporation, IIlumina Inc., F. Hoffmann-La Roche Ltd., IRIDEX, Merck KGaA, Lumenis, Perkin Elmer Inc., Novanta  Inc., Siemens  Healthineers, QIAGEN, Waters Corporation, Tecan Group AG, Zimmer MedizinSysteme GmbH, and Thermo Fisher Scientific Inc., and among others.

Key Segment

By Product, By End-User, and By Region

Major Regions Covered

North America, Europe, Asia Pacific, Latin America, and the Middle East & Africa

Purchase Options

Request customized purchase options to meet your research needs. Explore purchase options

logo Regional Analysis

The global biotechnology instruments market has been classified into North America, Latin America, Asia-Pacific, Europe, the Middle East, and Africa. In terms of revenue, North America is accounted for the largest market share in the global biotechnology instruments market. The high growth in this regional market can be attributed to the growing demand, the preference for manual automation in the pharmaceuticals, biotechnology, and associated industries in the region, the affordability of biotechnology instruments, and the rising demand for highly developed instruments to ease and speed up the procedure. Also, the accessibility of government funding for research and development activities is likely to drive market development.

The region of Asia-Pacific is anticipated to become the fastest-growing market during the forecast period. This is due to the increase in investments in the biotechnology area and the fast-developing economy.

logo Competitive Players

The major market players covered in the global biotechnology instruments market include:

  • Agilent Technologies
  • Becton Dickinsonand Company
  • Abbott
  • Alcon Inc.
  • AngioDyanamics
  • Bio-Rad Laboratories
  • BioMerieux SA
  • BioTek Instruments Inc.
  • Cynosure LLC
  • Candela Medical
  • Endress+Hauser (Analytik Jena GmbH)
  • Danaher Corporation
  • IIlumina Inc.
  • F. Hoffmann-La Roche Ltd.
  • IRIDEX
  • Merck KGaA
  • Lumenis
  • Perkin Elmer Inc.
  • Novanta  Inc.
  • Siemens  Healthineers
  • QIAGEN
  • Waters Corporation
  • Tecan Group AG
  • Zimmer MedizinSysteme GmbH
  • Thermo Fisher Scientific Inc.

logo Product Segment Analysis

  • Lab Automation Instruments
  • Life Science Consumables
  • IVD Instruments
  • Medical Lasers

logo End-User Segment Analysis

  • Government & Academic Institutes
  • Pharmaceutical & Biotechnology Companies
  • Hospitals & Healthcare Facilities
  • Others

logo Regional Segment Analysis

  • North America
    • U.S.
    • Canada
  • Europe
    • U.K.
    • France
    • Germany
    • Rest of Europe
  • Asia Pacific
    • China
    • Japan
    • India
    • South Korea
    • Rest of Asia Pacific
  • Latin America
    • Brazil
    • Rest of Latin America
  • The Middle East and Africa
    • GCC Countries
    • South Africa
    • Rest of Middle East Africa

Table of Content

  1. Chapter 1 Executive Summary
    1. 1.1. Introduction of Biotechnology Instruments
    2. 1.2. Global Biotechnology Instruments Market, 2019 & 2026 (USD Million)
    3. 1.3. Global Biotechnology Instruments Market, 2016 – 2026(USD Million)
    4. 1.4. Global Biotechnology Instruments MarketAbsolute Revenue Opportunity, 2016 – 2026(USD Million)
    5. 1.5. Global Biotechnology Instruments MarketIncremental Revenue Opportunity, 2020 – 2026(USD Million)
  2. Chapter 2 Biotechnology Instruments Market – Product Analysis
    1. 2.1. Global Biotechnology Instruments Market – Product Overview
    2. 2.2. Global Biotechnology Instruments Market Share, by Product, 2019 & 2026(USD Million)
    3. 2.3. Lab Automation Instruments
      1. 2.3.1. Global Lab Automation Instruments Biotechnology Instruments Market, 2016 – 2026(USD Million)
    4. 2.4. Life Science Consumables
      1. 2.4.1. Global Life Science Consumables Biotechnology Instruments Market, 2016 – 2026(USD Million)
    5. 2.5. IVD Instruments
      1. 2.5.1. Global IVD Instruments Biotechnology Instruments Market, 2016 – 2026(USD Million)
    6. 2.6. Medical Lasers
      1. 2.6.1. Global Medical Lasers Biotechnology Instruments Market, 2016 – 2026(USD Million)
  3. Chapter 3 Biotechnology Instruments Market – End-User Analysis
    1. 3.1. Global Biotechnology Instruments Market – End-User Overview
    2. 3.2. Global Biotechnology Instruments Market Share, by End-User, 2019 & 2026(USD Million)
    3. 3.3. Government & Academic Institutes
      1. 3.3.1. Global Government & Academic Institutes Biotechnology Instruments Market, 2016 – 2026(USD Million)
    4. 3.4. Pharmaceutical & Biotechnology Companies
      1. 3.4.1. Global Pharmaceutical & Biotechnology Companies Biotechnology Instruments Market, 2016 – 2026(USD Million)
    5. 3.5. Hospitals & Healthcare Facilities
      1. 3.5.1. Global Hospitals & Healthcare Facilities Biotechnology Instruments Market, 2016 – 2026(USD Million)
    6. 3.6. Others
      1. 3.6.1. Global Others Biotechnology Instruments Market, 2016 – 2026(USD Million)
  4. Chapter 4 Biotechnology Instruments Market – Regional Analysis
    1. 4.1. Global Biotechnology Instruments Market Regional Overview
    2. 4.2. Global Biotechnology Instruments Market Share, by Region, 2019 & 2026(USD Million)
    3. 4.3. North America
      1. 4.3.1. North America Biotechnology Instruments Market, 2016 – 2026(USD Million)
        1. 4.3.1.1. North America Biotechnology Instruments Market, by Country, 2016 - 2026(USD Million)
      2. 4.3.2. North America Biotechnology Instruments Market, by Product, 2016 – 2026
        1. 4.3.2.1. North America Biotechnology Instruments Market, by Product, 2016 – 2026(USD Million)
      3. 4.3.3. North America Biotechnology Instruments Market, by End-User, 2016 – 2026
        1. 4.3.3.1. North America Biotechnology Instruments Market, by End-User, 2016 – 2026(USD Million)
      4. 4.3.4. U.S.
        1. 4.3.4.1. U.S. Biotechnology Instruments Market, 2016 – 2026(USD Million)
      5. 4.3.5. Canada
        1. 4.3.5.1. Canada Biotechnology Instruments Market, 2016 – 2026(USD Million)
    4. 4.4. Europe
      1. 4.4.1. Europe Biotechnology Instruments Market, 2016 – 2026(USD Million)
        1. 4.4.1.1. Europe Biotechnology Instruments Market, by Country, 2016 - 2026(USD Million)
      2. 4.4.2. Europe Biotechnology Instruments Market, by Product, 2016 – 2026
        1. 4.4.2.1. Europe Biotechnology Instruments Market, by Product, 2016 – 2026(USD Million)
      3. 4.4.3. Europe Biotechnology Instruments Market, by End-User, 2016 – 2026
        1. 4.4.3.1. Europe Biotechnology Instruments Market, by End-User, 2016 – 2026(USD Million)
      4. 4.4.4. Germany
        1. 4.4.4.1. Germany Biotechnology Instruments Market, 2016 – 2026(USD Million)
      5. 4.4.5. France
        1. 4.4.5.1. France Biotechnology Instruments Market, 2016 – 2026(USD Million)
      6. 4.4.6. U.K.
        1. 4.4.6.1. U.K. Biotechnology Instruments Market, 2016 – 2026(USD Million)
      7. 4.4.7. Italy
        1. 4.4.7.1. Italy Biotechnology Instruments Market, 2016 – 2026(USD Million)
      8. 4.4.8. Spain
        1. 4.4.8.1. Spain Biotechnology Instruments Market, 2016 – 2026(USD Million)
      9. 4.4.9. Rest of Europe
        1. 4.4.9.1. Rest of Europe Biotechnology Instruments Market, 2016 – 2026(USD Million)
    5. 4.5. Asia Pacific
      1. 4.5.1. Asia Pacific Biotechnology Instruments Market, 2016 – 2026(USD Million)
        1. 4.5.1.1. Asia Pacific Biotechnology Instruments Market, by Country, 2016 - 2026(USD Million)
      2. 4.5.2. Asia Pacific Biotechnology Instruments Market, by Product, 2016 – 2026
        1. 4.5.2.1. Asia Pacific Biotechnology Instruments Market, by Product, 2016 – 2026(USD Million)
      3. 4.5.3. Asia Pacific Biotechnology Instruments Market, by End-User, 2016 – 2026
        1. 4.5.3.1. Asia Pacific Biotechnology Instruments Market, by End-User, 2016 – 2026(USD Million)
      4. 4.5.4. China
        1. 4.5.4.1. China Biotechnology Instruments Market, 2016 – 2026(USD Million)
      5. 4.5.5. Japan
        1. 4.5.5.1. Japan Biotechnology Instruments Market, 2016 – 2026(USD Million)
      6. 4.5.6. India
        1. 4.5.6.1. India Biotechnology Instruments Market, 2016 – 2026(USD Million)
      7. 4.5.7. South Korea
        1. 4.5.7.1. South Korea Biotechnology Instruments Market, 2016 – 2026(USD Million)
      8. 4.5.8. South-East Asia
        1. 4.5.8.1. South-East Asia Biotechnology Instruments Market, 2016 – 2026(USD Million)
      9. 4.5.9. Rest of Asia Pacific
        1. 4.5.9.1. Rest of Asia Pacific Biotechnology Instruments Market, 2016 – 2026(USD Million)
    6. 4.6. Latin America
      1. 4.6.1. Latin America Biotechnology Instruments Market, 2016 – 2026(USD Million)
        1. 4.6.1.1. Latin America Biotechnology Instruments Market, by Country, 2016 - 2026(USD Million)
      2. 4.6.2. Latin America Biotechnology Instruments Market, by Product, 2016 – 2026
        1. 4.6.2.1. Latin America Biotechnology Instruments Market, by Product, 2016 – 2026(USD Million)
      3. 4.6.3. Latin America Biotechnology Instruments Market, by End-User, 2016 – 2026
        1. 4.6.3.1. Latin America Biotechnology Instruments Market, by End-User, 2016 – 2026(USD Million)
      4. 4.6.4. Brazil
        1. 4.6.4.1. Brazil Biotechnology Instruments Market, 2016 – 2026(USD Million)
      5. 4.6.5. Mexico
        1. 4.6.5.1. Mexico Biotechnology Instruments Market, 2016 – 2026(USD Million)
      6. 4.6.6. Rest of Latin America
        1. 4.6.6.1. Rest of Latin America Biotechnology Instruments Market, 2016 – 2026(USD Million)
    7. 4.7. The Middle-East and Africa
      1. 4.7.1. The Middle-East and Africa Biotechnology Instruments Market, 2016 – 2026(USD Million)
        1. 4.7.1.1. The Middle-East and Africa Biotechnology Instruments Market, by Country, 2016 - 2026(USD Million)
      2. 4.7.2. The Middle-East and Africa Biotechnology Instruments Market, by Product, 2016 – 2026
        1. 4.7.2.1. The Middle-East and Africa Biotechnology Instruments Market, by Product, 2016 – 2026(USD Million)
      3. 4.7.3. The Middle-East and Africa Biotechnology Instruments Market, by End-User, 2016 – 2026
        1. 4.7.3.1. The Middle-East and Africa Biotechnology Instruments Market, by End-User, 2016 – 2026(USD Million)
      4. 4.7.4. GCC Countries
        1. 4.7.4.1. GCC Countries Biotechnology Instruments Market, 2016 – 2026(USD Million)
      5. 4.7.5. South Africa
        1. 4.7.5.1. South Africa Biotechnology Instruments Market, 2016 – 2026(USD Million)
      6. 4.7.6. Rest of Middle-East Africa
        1. 4.7.6.1. Rest of Middle-East Africa Biotechnology Instruments Market, 2016 – 2026(USD Million)
  5. Chapter 5 Biotechnology Instruments Market – Competitive Landscape
    1. 5.1. Competitor Market Share – Revenue
    2. 5.2. Market Concentration Rate Analysis, Top 3 and Top 5 Players
    3. 5.3. Strategic Developments
      1. 5.3.1. Acquisitions and Mergers
      2. 5.3.2. New Products
      3. 5.3.3. Research & Development Activities
  6. Chapter 6 Company Profiles
    1. 6.1. Agilent Technologies
      1. 6.1.1. Company Overview
      2. 6.1.2. Product/ServicePortfolio
      3. 6.1.3. Agilent Technologies Sales, Revenue, and Gross Margin
      4. 6.1.4. Agilent Technologies Revenue and Growth Rate
      5. 6.1.5. Agilent Technologies Market Share
      6. 6.1.6. Recent Initiatives, Funding/VC Activities, and Technological Innovations
    2. 6.2. Becton Dickinson
      1. 6.2.1. Company Overview
      2. 6.2.2. Product/ServicePortfolio
      3. 6.2.3. Becton Dickinson Sales, Revenue, and Gross Margin
      4. 6.2.4. Becton Dickinson Revenue and Growth Rate
      5. 6.2.5. Becton Dickinson Market Share
      6. 6.2.6. Recent Initiatives, Funding/VC Activities, and Technological Innovations
    3. 6.3. and Company
      1. 6.3.1. Company Overview
      2. 6.3.2. Product/ServicePortfolio
      3. 6.3.3. and Company Sales, Revenue, and Gross Margin
      4. 6.3.4. and Company Revenue and Growth Rate
      5. 6.3.5. and Company Market Share
      6. 6.3.6. Recent Initiatives, Funding/VC Activities, and Technological Innovations
    4. 6.4. Abbott
      1. 6.4.1. Company Overview
      2. 6.4.2. Product/ServicePortfolio
      3. 6.4.3. Abbott Sales, Revenue, and Gross Margin
      4. 6.4.4. Abbott Revenue and Growth Rate
      5. 6.4.5. Abbott Market Share
      6. 6.4.6. Recent Initiatives, Funding/VC Activities, and Technological Innovations
    5. 6.5. Alcon Inc.
      1. 6.5.1. Company Overview
      2. 6.5.2. Product/ServicePortfolio
      3. 6.5.3. Alcon Inc. Sales, Revenue, and Gross Margin
      4. 6.5.4. Alcon Inc. Revenue and Growth Rate
      5. 6.5.5. Alcon Inc. Market Share
      6. 6.5.6. Recent Initiatives, Funding/VC Activities, and Technological Innovations
    6. 6.6. AngioDynamics
      1. 6.6.1. Company Overview
      2. 6.6.2. Product/ServicePortfolio
      3. 6.6.3. AngioDynamics Sales, Revenue, and Gross Margin
      4. 6.6.4. AngioDynamics Revenue and Growth Rate
      5. 6.6.5. AngioDynamics Market Share
      6. 6.6.6. Recent Initiatives, Funding/VC Activities, and Technological Innovations
    7. 6.7. Bio-Rad Laboratories
      1. 6.7.1. Company Overview
      2. 6.7.2. Product/ServicePortfolio
      3. 6.7.3. Bio-Rad Laboratories Sales, Revenue, and Gross Margin
      4. 6.7.4. Bio-Rad Laboratories Revenue and Growth Rate
      5. 6.7.5. Bio-Rad Laboratories Market Share
      6. 6.7.6. Recent Initiatives, Funding/VC Activities, and Technological Innovations
    8. 6.8. BioMerieux SA
      1. 6.8.1. Company Overview
      2. 6.8.2. Product/ServicePortfolio
      3. 6.8.3. BioMerieux SA Sales, Revenue, and Gross Margin
      4. 6.8.4. BioMerieux SA Revenue and Growth Rate
      5. 6.8.5. BioMerieux SA Market Share
      6. 6.8.6. Recent Initiatives, Funding/VC Activities, and Technological Innovations
    9. 6.9. BioTek Instruments Inc.
      1. 6.9.1. Company Overview
      2. 6.9.2. Product/ServicePortfolio
      3. 6.9.3. BioTek Instruments Inc. Sales, Revenue, and Gross Margin
      4. 6.9.4. BioTek Instruments Inc. Revenue and Growth Rate
      5. 6.9.5. BioTek Instruments Inc. Market Share
      6. 6.9.6. Recent Initiatives, Funding/VC Activities, and Technological Innovations
    10. 6.10. Cynosure LLC
      1. 6.10.1. Company Overview
      2. 6.10.2. Product/ServicePortfolio
      3. 6.10.3. Cynosure LLC Sales, Revenue, and Gross Margin
      4. 6.10.4. Cynosure LLC Revenue and Growth Rate
      5. 6.10.5. Cynosure LLC Market Share
      6. 6.10.6. Recent Initiatives, Funding/VC Activities, and Technological Innovations
    11. 6.11. Candela Medical
      1. 6.11.1. Company Overview
      2. 6.11.2. Product/ServicePortfolio
      3. 6.11.3. Candela Medical Sales, Revenue, and Gross Margin
      4. 6.11.4. Candela Medical Revenue and Growth Rate
      5. 6.11.5. Candela Medical Market Share
      6. 6.11.6. Recent Initiatives, Funding/VC Activities, and Technological Innovations
    12. 6.12. Endress+Hauser (Analytik Jena GmbH)
      1. 6.12.1. Company Overview
      2. 6.12.2. Product/ServicePortfolio
      3. 6.12.3. Endress+Hauser (Analytik Jena GmbH) Sales, Revenue, and Gross Margin
      4. 6.12.4. Endress+Hauser (Analytik Jena GmbH) Revenue and Growth Rate
      5. 6.12.5. Endress+Hauser (Analytik Jena GmbH) Market Share
      6. 6.12.6. Recent Initiatives, Funding/VC Activities, and Technological Innovations
    13. 6.13. Danaher Corporation
      1. 6.13.1. Company Overview
      2. 6.13.2. Product/ServicePortfolio
      3. 6.13.3. Danaher Corporation Sales, Revenue, and Gross Margin
      4. 6.13.4. Danaher Corporation Revenue and Growth Rate
      5. 6.13.5. Danaher Corporation Market Share
      6. 6.13.6. Recent Initiatives, Funding/VC Activities, and Technological Innovations
    14. 6.14. IIlumina Inc.
      1. 6.14.1. Company Overview
      2. 6.14.2. Product/ServicePortfolio
      3. 6.14.3. IIlumina Inc. Sales, Revenue, and Gross Margin
      4. 6.14.4. IIlumina Inc. Revenue and Growth Rate
      5. 6.14.5. IIlumina Inc. Market Share
      6. 6.14.6. Recent Initiatives, Funding/VC Activities, and Technological Innovations
      7. 6.15. F. Hoffmann-La Roche Ltd.
      8. 6.15.1. Company Overview
      9. 6.15.2. Product/ServicePortfolio
        1. 6.15.3. F. Hoffmann-La Roche Ltd. Sales, Revenue, and Gross Margin
        2. 6.15.4. F. Hoffmann-La Roche Ltd. Revenue and Growth Rate
        3. 6.15.5. F. Hoffmann-La Roche Ltd. Market Share
      10. 6.15.6. Recent Initiatives, Funding/VC Activities, and Technological Innovations
    15. 6.16. IRIDEX
      1. 6.16.1. Company Overview
      2. 6.16.2. Product/ServicePortfolio
      3. 6.16.3. IRIDEX Sales, Revenue, and Gross Margin
      4. 6.16.4. IRIDEX Revenue and Growth Rate
      5. 6.16.5. IRIDEX Market Share
      6. 6.16.6. Recent Initiatives, Funding/VC Activities, and Technological Innovations
    16. 6.17. Merck KGaA
      1. 6.17.1. Company Overview
      2. 6.17.2. Product/ServicePortfolio
      3. 6.17.3. Merck KGaA Sales, Revenue, and Gross Margin
      4. 6.17.4. Merck KGaA Revenue and Growth Rate
      5. 6.17.5. Merck KGaA Market Share
      6. 6.17.6. Recent Initiatives, Funding/VC Activities, and Technological Innovations
    17. 6.18. Lumenis
      1. 6.18.1. Company Overview
      2. 6.18.2. Product/ServicePortfolio
      3. 6.18.3. Lumenis Sales, Revenue, and Gross Margin
      4. 6.18.4. Lumenis Revenue and Growth Rate
      5. 6.18.5. Lumenis Market Share
      6. 6.18.6. Recent Initiatives, Funding/VC Activities, and Technological Innovations
    18. 6.19. Perkin Elmer Inc.
      1. 6.19.1. Company Overview
      2. 6.19.2. Product/ServicePortfolio
      3. 6.19.3. Perkin Elmer Inc. Sales, Revenue, and Gross Margin
      4. 6.19.4. Perkin Elmer Inc. Revenue and Growth Rate
      5. 6.19.5. Perkin Elmer Inc. Market Share
      6. 6.19.6. Recent Initiatives, Funding/VC Activities, and Technological Innovations
    19. 6.20. Novanta Inc.
      1. 6.20.1. Company Overview
      2. 6.20.2. Product/ServicePortfolio
      3. 6.20.3. Novanta Inc. Sales, Revenue, and Gross Margin
      4. 6.20.4. Novanta Inc. Revenue and Growth Rate
      5. 6.20.5. Novanta Inc. Market Share
      6. 6.20.6. Recent Initiatives, Funding/VC Activities, and Technological Innovations
    20. 6.21. Siemens Healthineers
      1. 6.21.1. Company Overview
      2. 6.21.2. Product/ServicePortfolio
      3. 6.21.3. Siemens Healthineers Sales, Revenue, and Gross Margin
      4. 6.21.4. Siemens Healthineers Revenue and Growth Rate
      5. 6.21.5. Siemens Healthineers Market Share
      6. 6.21.6. Recent Initiatives, Funding/VC Activities, and Technological Innovations
    21. 6.22. QIAGEN
      1. 6.22.1. Company Overview
      2. 6.22.2. Product/ServicePortfolio
      3. 6.22.3. QIAGEN Sales, Revenue, and Gross Margin
      4. 6.22.4. QIAGEN Revenue and Growth Rate
      5. 6.22.5. QIAGEN Market Share
      6. 6.22.6. Recent Initiatives, Funding/VC Activities, and Technological Innovations
    22. 6.23. Waters Corporation
      1. 6.23.1. Company Overview
      2. 6.23.2. Product/ServicePortfolio
      3. 6.23.3. Waters Corporation Sales, Revenue, and Gross Margin
      4. 6.23.4. Waters Corporation Revenue and Growth Rate
      5. 6.23.5. Waters Corporation Market Share
      6. 6.23.6. Recent Initiatives, Funding/VC Activities, and Technological Innovations
    23. 6.24. Tecan Group AG
      1. 6.24.1. Company Overview
      2. 6.24.2. Product/ServicePortfolio
      3. 6.24.3. Tecan Group AG Sales, Revenue, and Gross Margin
      4. 6.24.4. Tecan Group AG Revenue and Growth Rate
      5. 6.24.5. Tecan Group AG Market Share
      6. 6.24.6. Recent Initiatives, Funding/VC Activities, and Technological Innovations
    24. 6.25. Zimmer MedizinSysteme GmbH
      1. 6.25.1. Company Overview
      2. 6.25.2. Product/ServicePortfolio
      3. 6.25.3. Zimmer MedizinSysteme GmbH Sales, Revenue, and Gross Margin
      4. 6.25.4. Zimmer MedizinSysteme GmbH Revenue and Growth Rate
      5. 6.25.5. Zimmer MedizinSysteme GmbH Market Share
      6. 6.25.6. Recent Initiatives, Funding/VC Activities, and Technological Innovations
    25. 6.26. Thermo Fisher Scientific Inc.
      1. 6.26.1. Company Overview
      2. 6.26.2. Product/ServicePortfolio
      3. 6.26.3. Thermo Fisher Scientific Inc. Sales, Revenue, and Gross Margin
      4. 6.26.4. Thermo Fisher Scientific Inc. Revenue and Growth Rate
      5. 6.26.5. Thermo Fisher Scientific Inc. Market Share
      6. 6.26.6. Recent Initiatives, Funding/VC Activities, and Technological Innovations
  7. Chapter 7 Biotechnology Instruments — Industry Analysis
    1. 7.1. Introduction and Taxonomy
    2. 7.2. Biotechnology Instruments Market – Key Trends
      1. 7.2.1. Market Drivers
      2. 7.2.2. Market Restraints
      3. 7.2.3. Market Opportunities
    3. 7.3. Value Chain Analysis
    4. 7.4. Key Mandates and Regulations
    5. 7.5. Technology Roadmap and Timeline
    6. 7.6. Biotechnology Instruments Market – Attractiveness Analysis
      1. 7.6.1. By Product
      2. 7.6.2. By End-User
      3. 7.6.3. By Region
  8. Chapter 8 Industrial Chain, Sourcing Strategy, and Downstream Buyers
    1. 8.1. Biotechnology Instruments Industrial Chain Analysis
    2. 8.2. Downstream Buyers
    3. 8.3. Distributors/Traders List
  9. Chapter 9 Marketing Strategy Analysis
    1. 9.1. Marketing Channel
    2. 9.2. Direct Marketing
    3. 9.3. Indirect Marketing
    4. 9.4. Marketing Channel Development Trends
    5. 9.5. Economic/Political Environmental Change
  10. Chapter 10 Report Conclusion& Key Insights
    1. 10.1. Key Insights from Primary Interviews & Surveys Respondents
    2. 10.2. Key Takeaways from Analysts, Consultants, and Industry Leaders
  11. Chapter 11 Research Approach & Methodology
    1. 11.1. Report Description
    2. 11.2. Research Scope
    3. 11.3. Research Methodology
      1. 11.3.1. Secondary Research
      2. 11.3.2. Primary Research
      3. 11.3.3. Statistical Models
        1. 11.3.3.1. Company Share Analysis Model
        2. 11.3.3.2. Revenue Based Modeling
      4. 11.3.4. Research Limitations

      List of Figures

      Fig.1	Product Picture of  Biotechnology Instruments
      Fig.2	Global  Biotechnology Instruments  Market, 2016 – 2026(USD Million)
      Fig.3	Global  Biotechnology Instruments  MarketAbsolute Revenue Opportunity, 2016 – 2026(USD Million)
      Fig.4	Global  Biotechnology Instruments  MarketIncremental Revenue Opportunity, 2020 – 2026(USD Million)
      Fig.5	Global  Biotechnology Instruments  Market Share, by Product, 2019 & 2026(USD Million)
      Fig.6	Global Lab Automation Instruments Biotechnology Instruments  Market, 2016 – 2026(USD Million)
      Fig.7	Global Life Science Consumables Biotechnology Instruments  Market, 2016 – 2026(USD Million)
      Fig.8	Global IVD Instruments Biotechnology Instruments  Market, 2016 – 2026(USD Million)
      Fig.9	Global Medical Lasers Biotechnology Instruments  Market, 2016 – 2026(USD Million)
      Fig.10	Global  Biotechnology Instruments  Market Share, by End-User, 2019 & 2026(USD Million)
      Fig.11	Global Government & Academic Institutes Biotechnology Instruments  Market, 2016 – 2026(USD Million)
      Fig.12	Global Pharmaceutical & Biotechnology Companies Biotechnology Instruments  Market, 2016 – 2026(USD Million)
      Fig.13	Global Hospitals & Healthcare Facilities Biotechnology Instruments  Market, 2016 – 2026(USD Million)
      Fig.14	Global Others Biotechnology Instruments  Market, 2016 – 2026(USD Million)
      Fig.15	Global  Biotechnology Instruments  MarketShare, by Region, 2019 & 2026(USD Million)
      Fig.16	North America Biotechnology Instruments  Market, 2016 – 2026(USD Million)
      Fig.17	U.S. Biotechnology Instruments  Market, 2016 – 2026(USD Million)
      Fig.18	Canada Biotechnology Instruments  Market, 2016 – 2026(USD Million)
      Fig.19	Europe Biotechnology Instruments  Market, 2016 – 2026(USD Million)
      Fig.20	Germany Biotechnology Instruments  Market, 2016 – 2026(USD Million)
      Fig.21	France Biotechnology Instruments  Market, 2016 – 2026(USD Million)
      Fig.22	U.K. Biotechnology Instruments  Market, 2016 – 2026(USD Million)
      Fig.23	Italy Biotechnology Instruments  Market, 2016 – 2026(USD Million)
      Fig.24	Spain Biotechnology Instruments  Market, 2016 – 2026(USD Million)
      Fig.25	Rest of Europe Biotechnology Instruments  Market, 2016 – 2026(USD Million)
      Fig.26	Asia Pacific Biotechnology Instruments  Market, 2016 – 2026(USD Million)
      Fig.27	China Biotechnology Instruments  Market, 2016 – 2026(USD Million)
      Fig.28	Japan Biotechnology Instruments  Market, 2016 – 2026(USD Million)
      Fig.29	India Biotechnology Instruments  Market, 2016 – 2026(USD Million)
      Fig.30	South  Korea Biotechnology Instruments  Market, 2016 – 2026(USD Million)
      Fig.31	South-East Asia Biotechnology Instruments  Market, 2016 – 2026(USD Million)
      Fig.32	Rest of Asia Pacific Biotechnology Instruments  Market, 2016 – 2026(USD Million)
      Fig.33	Latin America Biotechnology Instruments  Market, 2016 – 2026(USD Million)
      Fig.34	Brazil Biotechnology Instruments  Market, 2016 – 2026(USD Million)
      Fig.35	Mexico Biotechnology Instruments  Market, 2016 – 2026(USD Million)
      Fig.36	Rest of Latin America Biotechnology Instruments  Market, 2016 – 2026(USD Million)
      Fig.37	The Middle-East and Africa Biotechnology Instruments  Market, 2016 – 2026(USD Million)
      Fig.38	GCC Countries Biotechnology Instruments  Market, 2016 – 2026(USD Million)
      Fig.39	South Africa Biotechnology Instruments  Market, 2016 – 2026(USD Million)
      Fig.40	Rest of Middle-East Africa Biotechnology Instruments  Market, 2016 – 2026(USD Million)
      Fig.41	Competitor Market Share – Revenue
      Fig.42	Agilent Technologies Revenue and Growth Rate
      Fig.43	Agilent Technologies Market Share
      Fig.44	Becton Dickinson Revenue and Growth Rate
      Fig.45	Becton Dickinson Market Share
      Fig.46	and Company Revenue and Growth Rate
      Fig.47	and Company Market Share
      Fig.48	Abbott Revenue and Growth Rate
      Fig.49	Abbott Market Share
      Fig.50	Alcon Inc. Revenue and Growth Rate
      Fig.51	Alcon Inc. Market Share
      Fig.52	AngioDynamics Revenue and Growth Rate
      Fig.53	AngioDynamics Market Share
      Fig.54	Bio-Rad Laboratories Revenue and Growth Rate
      Fig.55	Bio-Rad Laboratories Market Share
      Fig.56	BioMerieux SA Revenue and Growth Rate
      Fig.57	BioMerieux SA Market Share
      Fig.58	BioTek Instruments Inc. Revenue and Growth Rate
      Fig.59	BioTek Instruments Inc. Market Share
      Fig.60	Cynosure LLC Revenue and Growth Rate
      Fig.61	Cynosure LLC Market Share
      Fig.62	Candela Medical Revenue and Growth Rate
      Fig.63	Candela Medical Market Share
      Fig.64	Endress+Hauser (Analytik Jena GmbH) Revenue and Growth Rate
      Fig.65	Endress+Hauser (Analytik Jena GmbH) Market Share
      Fig.66	Danaher Corporation Revenue and Growth Rate
      Fig.67	Danaher Corporation Market Share
      Fig.68	IIlumina Inc. Revenue and Growth Rate
      Fig.69	IIlumina Inc. Market Share
      Fig.70	F. Hoffmann-La Roche Ltd. Revenue and Growth Rate
      Fig.71	F. Hoffmann-La Roche Ltd. Market Share
      Fig.72	IRIDEX Revenue and Growth Rate
      Fig.73	IRIDEX Market Share
      Fig.74	Merck KGaA Revenue and Growth Rate
      Fig.75	Merck KGaA Market Share
      Fig.76	Lumenis Revenue and Growth Rate
      Fig.77	Lumenis Market Share
      Fig.78	Perkin Elmer Inc. Revenue and Growth Rate
      Fig.79	Perkin Elmer Inc. Market Share
      Fig.80	Novanta  Inc. Revenue and Growth Rate
      Fig.81	Novanta  Inc. Market Share
      Fig.82	Siemens  Healthineers Revenue and Growth Rate
      Fig.83	Siemens  Healthineers Market Share
      Fig.84	QIAGEN Revenue and Growth Rate
      Fig.85	QIAGEN Market Share
      Fig.86	Waters Corporation Revenue and Growth Rate
      Fig.87	Waters Corporation Market Share
      Fig.88	Tecan Group AG Revenue and Growth Rate
      Fig.89	Tecan Group AG Market Share
      Fig.90	Zimmer MedizinSysteme GmbH Revenue and Growth Rate
      Fig.91	Zimmer MedizinSysteme GmbH Market Share
      Fig.92	Thermo Fisher Scientific Inc. Revenue and Growth Rate
      Fig.93	Thermo Fisher Scientific Inc. Market Share
      Fig.94	Market Dynamics
      Fig.95	Global  Biotechnology Instruments  – Value Chain Analysis
      Fig.96	Key Mandates and Regulations
      Fig.97	Technology Roadmap and Timeline
      Fig.98	Market Attractiveness Analysis – By Product
      Fig.99	Market Attractiveness Analysis – By End-User
      Fig.100	Market Attractiveness Analysis – By Region
      Fig.101	Biotechnology Instruments  Industrial Chain Analysis
      Fig.102	Market Channels
      Fig.103	Marketing Channel Development Trend
      Fig.104	Growth in World Gross Product, 2008-2018
      

      List of Tables

      Table 1	Global  Biotechnology Instruments Market, 2019 & 2026(USD Million)
      Table 2	Global  Biotechnology Instruments Market, by Product, 2016 – 2026(USD Million)
      Table 3	Global  Biotechnology Instruments Market, by End-User, 2016 – 2026(USD Million)
      Table 4	Global  Biotechnology Instruments Market, by Region, 2016 – 2026(USD Million)
      Table 5	North America Biotechnology Instruments  Market, by Country, 2016 – 2026(USD Million)
      Table 6	North America Biotechnology Instruments  Market, by Product, 2016 – 2026(USD Million)
      Table 7	North America Biotechnology Instruments  Market, by End-User, 2016 – 2026(USD Million)
      Table 8	Europe Biotechnology Instruments  Market, by Country, 2016 – 2026(USD Million)
      Table 9	Europe Biotechnology Instruments  Market, by Product, 2016 – 2026(USD Million)
      Table 10 Europe Biotechnology Instruments  Market, by End-User, 2016 – 2026(USD Million)
      Table 11 Asia Pacific Biotechnology Instruments  Market, by Country, 2016 – 2026(USD Million)
      Table 12 Asia Pacific Biotechnology Instruments  Market, by Product, 2016 – 2026(USD Million)
      Table 13 Asia Pacific Biotechnology Instruments  Market, by End-User, 2016 – 2026(USD Million)
      Table 14 Latin America Biotechnology Instruments  Market, by Country, 2016 – 2026(USD Million)
      Table 15 Latin America Biotechnology Instruments  Market, by Product, 2016 – 2026(USD Million)
      Table 16 Latin America Biotechnology Instruments  Market, by End-User, 2016 – 2026(USD Million)
      Table 17 The Middle-East and Africa Biotechnology Instruments  Market, by Country, 2016 – 2026(USD Million)
      Table 18 The Middle-East and Africa Biotechnology Instruments  Market, by Product, 2016 – 2026(USD Million)
      Table 19 The Middle-East and Africa Biotechnology Instruments  Market, by End-User, 2016 – 2026(USD Million)
      Table 20 Global  Biotechnology Instruments  Market - Company Revenue Analysis, 2016 – 2019(USD Million)
      Table 21 Global  Biotechnology Instruments  Market - Company Revenue Share Analysis, 2016 – 2019(%)
      Table 22 Acquisitions and Mergers
      Table 23 Market Drivers – Impact Analysis
      Table 24 Market Restraints
      Table 25 Market Opportunities
      Table 26 Major Buyers of  Biotechnology Instruments
      Table 27 Distributors/Traders of  Biotechnology Instruments  by Region
      

Industry Major Market Players

  • Agilent Technologies
  • Becton Dickinsonand Company
  • Abbott
  • Alcon Inc.
  • AngioDyanamics
  • Bio-Rad Laboratories
  • BioMerieux SA
  • BioTek Instruments Inc.
  • Cynosure LLC
  • Candela Medical
  • Endress+Hauser (Analytik Jena GmbH)
  • Danaher Corporation
  • IIlumina Inc.
  • F. Hoffmann-La Roche Ltd.
  • IRIDEX
  • Merck KGaA
  • Lumenis
  • Perkin Elmer Inc.
  • Novanta  Inc.
  • Siemens  Healthineers
  • QIAGEN
  • Waters Corporation
  • Tecan Group AG
  • Zimmer MedizinSysteme GmbH
  • Thermo Fisher Scientific Inc.