Search Market Research Report

Discover Our Latest Reports
Discover Our Featured Reports
Discover Top Selling Reports

Biopolymers Market Size, Share Global Analysis Report, 2020–2026

report img

Biopolymers Market By Product Type (Bio-PET, Bio-PE, Polylactic acid, Biodegradable polyesters, Others), By Application (Packaging, Fibers, Cosmetics, Agriculture seed coatings, Automotive interior parts, Others) and By End-User (Food and Beverages, Automotive Industry, Healthcare, Agriculture, Chemicals industry, Semiconductor & Electronics): Global Industry Outlook, Market Size, Business Intelligence, Consumer Preferences, Statistical Surveys, Comprehensive Analysis, Historical Developments, Current Trends, and Forecast 2020–2026

Industry Insights

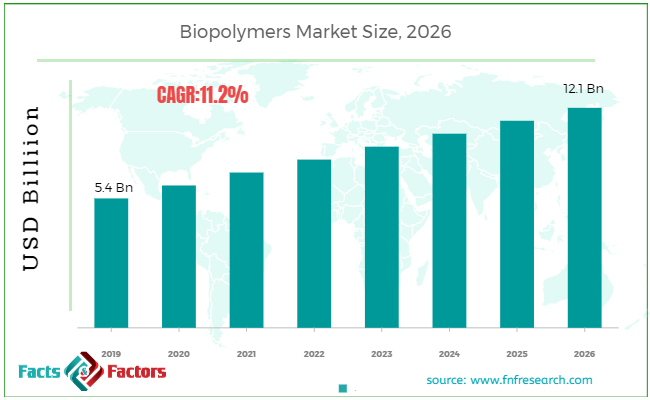
[220+ Pages Report] According to the report published by Facts Factors, the global biopolymers market size was worth around USD 5.4 billion in 2019 and is predicted to grow to around USD 12.1 billion by 2026 with a compound annual growth rate (CAGR) of roughly 11.2% between 2020 and 2026. The report analyzes the global biopolymers market drivers, restraints/challenges, and the effect they have on the demands during the projection period. In addition, the report explores emerging opportunities in the biopolymers market.

The biopolymers market report analyzes and notifies the industry statistics at the global as well as regional and country levels in order to acquire a thorough perspective of the entire biopolymers market. The historical and past insights are provided for FY 2016 to FY 2019 whereas projected trends are delivered for FY 2020 to FY 2026. The quantitative and numerical data is represented in terms of both volume (Tons) and value (USD Million) from FY 2016 – 2026.

Biopolymers Market Size

To know more about this report | Request Free Sample Copy


logoKey Insights from Primary Research

  • As per our primary respondents, the biopolymers market is set to grow annually at a rate of around 11.2%
  • It was established through primary research that the biopolymers market was valued at around USD 4.8 billion in 2018
  • Europe held the largest market share of the biopolymers market in terms of revenue, in 2018
  • The “xx” category, on the basis of product type segmentation, was the leading revenue-generating category in 2018
  • The “xx” category, on the basis of application segmentation, was the leading revenue-generating in 2018

logoKey Recommendations from Analysts

  • As per our analysts, stringent government regulations for the usage of conventional plastics and packaging materials is anticipated to boost the biopolymer market
  • In the biopolymers market, North America is anticipated to have the second-largest market share in terms of revenue
  • Europe 2020, Horizon 2020, and Bioeconomy Strategy are some of the legal frameworks for the success of the bioplastic industry in Europe
  • Huge research & development investment requirement for the development of biopolymers is one of the major challenges for the new entrants
  • The cost-effectiveness of conventional plastics over biopolymers is the major factor hindering the growth of the global biopolymer market

The quantitative data is further underlined and reinforced by comprehensive qualitative data which comprises various across-the-board market dynamics. The rationales which directly or indirectly impact the biopolymers industry are exemplified through parameters such as growth drivers, restraints, challenges, and opportunities among other impacting factors.

Throughout our research report, we have encompassed all the proven models and tools of industry analysis and extensively illustrated all the key business strategies and business models adopted in the biopolymers industry. The report provides an all-inclusive and detailed competitive landscape prevalent in the biopolymers market.

The report utilizes established industry analysis tools and models such as Porter’s Five Forces framework to analyze and recognize critical business strategies adopted by various stakeholders involved in the entire value chain of the biopolymers industry. The biopolymers market report additionally employs SWOT analysis and PESTLE analysis models for further in-depth analysis.

The report study further includes an in-depth analysis of industry players' market shares and provides an overview of leading players' market position in the biopolymers sector. Key strategic developments in the biopolymers market competitive landscape such as acquisitions & mergers, inaugurations of different products and services, partnerships & joint ventures, MoU agreements, VC & funding activities, R&D activities, and geographic expansion among other noteworthy activities by key players of the biopolymers market are appropriately highlighted in the report.

Increasing awareness of the harmful effects of food packaging and the demand for environmentally-friendly packaging materials among the population of developing countries support the growth of the global biopolymer industry. The demand for biopolymers is also driven by strict government rules for the use of traditional plastics and packaging materials. In addition, fluctuations in petroleum prices and their declining sources contribute to a change in biopolymers because the primary materials used in biopolymer production are regenerative. The economic efficiency of conventional plastics over biopolymers is, however, the major barrier to growth in the world biopolymer industry. One of the major challenges for new entrants is the huge investment in R&D for the production of biopolymers. The growth of the global biopolymer market is driven by the poor mechanical characteristics needed by the plastics industry.

The biopolymers market research report delivers an acute valuation and taxonomy of the biopolymers industry by practically splitting the market on the basis of different types, applications, and regions. Through the analysis of the historical and projected trends, all the segments and sub-segments were evaluated through the bottom-up approach, and different market sizes have been projected for FY 2020 to FY 2026.

logoReport Scope

Report Attribute

Details

Market Size in 2019

USD 5.4 Billion

Projected Market Size in 2026

USD 12.1 Billion

CAGR Growth Rate

11.2% CAGR

Base Year

2019

Forecast Years

2020-2026

Key Market Players

Plantic, BASF, DuPont, Durect Corp., BiotecGmbh, Novamont, Arkema, Biopolymer International, Ecospan, FMC Biopolymer, Braskem, and Others

Key Segment

By Product, Application, End-User, and Region

Major Regions Covered

North America, Europe, Asia Pacific, Latin America, and the Middle East & Africa

Purchase Options

Request customized purchase options to meet your research needs. Explore purchase options

The regional segmentation of the biopolymers industry includes the complete classification of all the major continents including North America, Latin America, Europe, Asia Pacific, and Middle East & Africa. Further, country-wise data for the biopolymers industry is provided for the leading economies of the world.

The biopolymer market is segmented based on Product Type, Application, and End-User. On the basis of product type segmentation, the market is classified into Bio-PET, Bio-PE, Polylactic acid, Biodegradable polyesters, and Others. In terms of Application segmentation, the market is bifurcated into Packaging, Fibers, Cosmetics, Agriculture seed coatings, Automotive interior parts, and Others. In terms of end-user segmentation, the market is bifurcated into food and Beverages, Automotive Industry, Healthcare, Agriculture, Chemicals industry, Semiconductor & Electronics

logoSome of the essential players operating in the biopolymers market, but not restricted to include

  • Plantic
  • BASF
  • DuPont
  • Durect Corp.
  • BiotecGmbh
  • Novamont
  • Arkema
  • Biopolymer International
  • Ecospan
  • FMC Biopolymer
  • Braskem
  • and Others

The taxonomy of the Global Biopolymer Market by its scope and segmentation is as follows:

logo By Type Segmentation Analysis (Customizable)

  • Bio-PET
  • Bio-PE
  • Polylactic acid
  • Biodegradable polyesters
  • Others

logo By Application Segmentation Analysis (Customizable)

  • Packaging
  • Fibers
  • Cosmetics
  • Agriculture seed coatings
  • Automotive interior parts
  • Others (medical implants)

logo By Application Segmentation Analysis (Customizable)

  • Food and Beverages
  • Automotive Industry
  • Healthcare
  • Agriculture
  • Chemicals industry
  • Semiconductor & Electronics

logo Regional Segmentation Analysis (Customizable)

  • North America
    • The U.S.
    • Canada
  • Europe
    • Germany
    • The UK
    • France
    • Spain
    • Italy
    • Rest of Europe
  • Asia Pacific
    • China
    • Japan
    • India
    • South Korea
    • Southeast Asia
    • Rest of Asia Pacific
  • Latin America
    • Brazil
    • Mexico
    • Rest of Latin America
  • Middle East & Africa
    • GCC
    • South Africa
    • Rest of Middle East & Africa

Table of Content

  1. CHAPTER 1. Executive Summary
  2. CHAPTER 2. Biopolymers market – Product Type Analysis
    1. 2.1. Global Biopolymers Market – Product Type Overview
    2. 2.2. Global Biopolymers Market Share, by Product Type, 2019 & 2026 (USD Million)
    3. 2.3. Global Biopolymers Market share, by Product Type, 2019 & 2026 (Tons)
    4. 2.4. Bio-PET
      1. 2.4.1. Global Bio-PET Biopolymers Market, 2016-2026 (USD Million)
      2. 2.4.2. Global Bio-PET Biopolymers Market, 2016-2026 (Tons)
    5. 2.5. Bio-PE
      1. 2.5.1. Global Bio-PE Biopolymers Market, 2016-2026 (USD Million)
      2. 2.5.2. Global Bio-PE Biopolymers Market, 2016-2026 (Tons)
    6. 2.6. Polylactic acid
      1. 2.6.1. Global Polylactic acid Biopolymers Market, 2016-2026 (USD Million)
      2. 2.6.2. Global Polylactic acid Biopolymers Market, 2016-2026 (Tons)
    7. 2.7. Biodegradable polyesters
      1. 2.7.1. Global Biodegradable polyesters Biopolymers Market, 2016-2026 (USD Million)
      2. 2.7.2. Global Biodegradable polyesters Biopolymers Market, 2016-2026 (Tons)
    8. 2.8. Others
      1. 2.8.1. Global Others Biopolymers Market, 2016-2026 (USD Million)
      2. 2.8.2. Global Others Biopolymers Market, 2016-2026 (Tons)
  3. CHAPTER 3. Biopolymers market – Application Analysis
    1. 3.1. Global Biopolymers Market – Application Overview
    2. 3.2. Global Biopolymers Market Share, by Application, 2019 & 2026 (USD Million)
    3. 3.3. Global Biopolymers Market share, by Application, 2019 & 2026 (Tons)
    4. 3.4. Packaging
      1. 3.4.1. Global Packaging Biopolymers Market, 2016-2026 (USD Million)
      2. 3.4.2. Global Packaging Biopolymers Market, 2016-2026 (Tons)
    5. 3.5. Fibers
      1. 3.5.1. Global Fibers Biopolymers Market, 2016-2026 (USD Million)
      2. 3.5.2. Global Fibers Biopolymers Market, 2016-2026 (Tons)
    6. 3.6. Cosmetics
      1. 3.6.1. Global Cosmetics Biopolymers Market, 2016-2026 (USD Million)
      2. 3.6.2. Global Cosmetics Biopolymers Market, 2016-2026 (Tons)
    7. 3.7. Agriculture seed coatings
      1. 3.7.1. Global Agriculture seed coatings Biopolymers Market, 2016-2026 (USD Million)
      2. 3.7.2. Global Agriculture seed coatings Biopolymers Market, 2016-2026 (Tons)
    8. 3.8. Automotive interior parts
      1. 3.8.1. Global Automotive interior parts Biopolymers Market, 2016-2026 (USD Million)
      2. 3.8.2. Global Automotive interior parts Biopolymers Market, 2016-2026 (Tons)
    9. 3.9. Others
      1. 3.9.1. Global Others Biopolymers Market, 2016-2026 (USD Million)
      2. 3.9.2. Global Others Biopolymers Market, 2016-2026 (Tons)
  4. CHAPTER 4. Biopolymers market – End-User Analysis
    1. 4.1. Global Biopolymers Market – End-User Overview
    2. 4.2. Global Biopolymers Market Share, by End-User, 2019 & 2026 (USD Million)
    3. 4.3. Global Biopolymers Market share, by End-User, 2019 & 2026 (Tons)
    4. 4.4. Food and Beverages
      1. 4.4.1. Global Food and Beverages Biopolymers Market, 2016-2026 (USD Million)
      2. 4.4.2. Global Food and Beverages Biopolymers Market, 2016-2026 (Tons)
    5. 4.5. Automotive Industry
      1. 4.5.1. Global Automotive Industry Biopolymers Market, 2016-2026 (USD Million)
      2. 4.5.2. Global Automotive Industry Biopolymers Market, 2016-2026 (Tons)
    6. 4.6. Healthcare
      1. 4.6.1. Global Healthcare Biopolymers Market, 2016-2026 (USD Million)
      2. 4.6.2. Global Healthcare Biopolymers Market, 2016-2026 (Tons)
    7. 4.7. Agriculture
      1. 4.7.1. Global Agriculture Biopolymers Market, 2016-2026 (USD Million)
      2. 4.7.2. Global Agriculture Biopolymers Market, 2016-2026 (Tons)
    8. 4.8. Chemicals industry
      1. 4.8.1. Global Chemicals industry Biopolymers Market, 2016-2026 (USD Million)
      2. 4.8.2. Global Chemicals industry Biopolymers Market, 2016-2026 (Tons)
    9. 4.9. Semiconductor & Electronics
      1. 4.9.1. Global Semiconductor & Electronics Biopolymers Market, 2016-2026 (USD Million)
      2. 4.9.2. Global Semiconductor & Electronics Biopolymers Market, 2016-2026 (Tons)
  5. CHAPTER 5. Biopolymers market – Regional Analysis
    1. 5.1. Global Biopolymers Market Regional Overview
    2. 5.2. Global Biopolymers Market Share, by Region, 2019 & 2026 (Value)
    3. 5.3. Global Biopolymers Market Share, by Region, 2019 & 2026 (Volume)
    4. 5.4. North America
      1. 5.4.1. North America Biopolymers Market size and forecast, 2016-2026
      2. 5.4.2. North America Biopolymers Market, by Country, 2019 - 2026 (USD Million)
      3. 5.4.3. North America Market size and forecast, 2016-2026 (Tons)
      4. 5.4.4. North America Biopolymers Market, by Country, 2019 - 2026 (Tons)
      5. 5.4.5. North America Biopolymers Market, by Product Type, 2016-2026
        1. 5.4.5.1. North America Biopolymers Market, by Product Type, 2016-2026 (USD Million)
        2. 5.4.5.2. North America Biopolymers Market, by Product Type, 2016-2026 (Tons)
      6. 5.4.6. North America Biopolymers Market, by Application, 2016-2026
        1. 5.4.6.1. North America Biopolymers Market, by Application, 2016-2026 (USD Million)
        2. 5.4.6.2. North America Biopolymers Market, by Application, 2016-2026 (Tons)
      7. 5.4.7. North America Biopolymers Market, by End-User, 2016-2026
        1. 5.4.7.1. North America Biopolymers Market, by End-User, 2016-2026 (USD Million)
        2. 5.4.7.2. North America Biopolymers Market, by End-User, 2016-2026 (Tons)
      8. 5.4.8. U.S.
        1. 5.4.8.1. U.S. Market size and forecast, 2016-2026 (USD Million)
        2. 5.4.8.2. U.S. Market size and forecast, 2016-2026 (Tons)
      9. 5.4.9. Canada
        1. 5.4.9.1. Canada Market size and forecast, 2016-2026 (USD Million)
        2. 5.4.9.2. Canada Market size and forecast, 2016-2026 (Tons)
    5. 5.5. Europe
      1. 5.5.1. Europe Biopolymers Market size and forecast, 2016-2026
      2. 5.5.2. Europe Biopolymers Market, by Country, 2019 - 2026 (USD Million)
      3. 5.5.3. Europe Market size and forecast, 2016-2026 (Tons)
      4. 5.5.4. Europe Biopolymers Market, by Country, 2019 - 2026 (Tons)
      5. 5.5.5. Europe Biopolymers Market, by Product Type, 2016-2026
        1. 5.5.5.1. Europe Biopolymers Market, by Product Type, 2016-2026 (USD Million)
        2. 5.5.5.2. Europe Biopolymers Market, by Product Type, 2016-2026 (Tons)
      6. 5.5.6. Europe Biopolymers Market, by Application, 2016-2026
        1. 5.5.6.1. Europe Biopolymers Market, by Application, 2016-2026 (USD Million)
        2. 5.5.6.2. Europe Biopolymers Market, by Application, 2016-2026 (Tons)
      7. 5.5.7. Europe Biopolymers Market, by End-User, 2016-2026
        1. 5.5.7.1. Europe Biopolymers Market, by End-User, 2016-2026 (USD Million)
        2. 5.5.7.2. Europe Biopolymers Market, by End-User, 2016-2026 (Tons)
      8. 5.5.8. Germany
        1. 5.5.8.1. Germany Market size and forecast, 2016-2026 (USD Million)
        2. 5.5.8.2. Germany Market size and forecast, 2016-2026 (Tons)
      9. 5.5.9. France
        1. 5.5.9.1. France Market size and forecast, 2016-2026 (USD Million)
        2. 5.5.9.2. France Market size and forecast, 2016-2026 (Tons)
      10. 5.5.10. U.K.
        1. 5.5.10.1. U.K. Market size and forecast, 2016-2026 (USD Million)
        2. 5.5.10.2. U.K. Market size and forecast, 2016-2026 (Tons)
      11. 5.5.11. Italy
        1. 5.5.11.1. Italy Market size and forecast, 2016-2026 (USD Million)
        2. 5.5.11.2. Italy Market size and forecast, 2016-2026 (Tons)
      12. 5.5.12. Spain
        1. 5.5.12.1. Spain Market size and forecast, 2016-2026 (USD Million)
        2. 5.5.12.2. Spain Market size and forecast, 2016-2026 (Tons)
      13. 5.5.13. Rest of Europe
        1. 5.5.13.1. Rest of Europe Market size and forecast, 2016-2026 (USD Million)
        2. 5.5.13.2. Rest of Europe Market size and forecast, 2016-2026 (Tons)
    6. 5.6. Asia Pacific
      1. 5.6.1. Asia Pacific Biopolymers Market size and forecast, 2016-2026
      2. 5.6.2. Asia Pacific Biopolymers Market, by Country, 2019 - 2026 (USD Million)
      3. 5.6.3. Asia Pacific Market size and forecast, 2016-2026 (Tons)
      4. 5.6.4. Asia Pacific Biopolymers Market, by Country, 2019 - 2026 (Tons)
      5. 5.6.5. Asia Pacific Biopolymers Market, by Product Type, 2016-2026
        1. 5.6.5.1. Asia Pacific Biopolymers Market, by Product Type, 2016-2026 (USD Million)
        2. 5.6.5.2. Asia Pacific Biopolymers Market, by Product Type, 2016-2026 (Tons)
      6. 5.6.6. Asia Pacific Biopolymers Market, by Application, 2016-2026
        1. 5.6.6.1. Asia Pacific Biopolymers Market, by Application, 2016-2026 (USD Million)
        2. 5.6.6.2. Asia Pacific Biopolymers Market, by Application, 2016-2026 (Tons)
      7. 5.6.7. Asia Pacific Biopolymers Market, by End-User, 2016-2026
        1. 5.6.7.1. Asia Pacific Biopolymers Market, by End-User, 2016-2026 (USD Million)
        2. 5.6.7.2. Asia Pacific Biopolymers Market, by End-User, 2016-2026 (Tons)
      8. 5.6.8. China
        1. 5.6.8.1. China Market size and forecast, 2016-2026 (USD Million)
        2. 5.6.8.2. China Market size and forecast, 2016-2026 (Tons)
      9. 5.6.9. Japan
        1. 5.6.9.1. Japan Market size and forecast, 2016-2026 (USD Million)
        2. 5.6.9.2. Japan Market size and forecast, 2016-2026 (Tons)
      10. 5.6.10. India
        1. 5.6.10.1. India Market size and forecast, 2016-2026 (USD Million)
        2. 5.6.10.2. India Market size and forecast, 2016-2026 (Tons)
      11. 5.6.11. South Korea
        1. 5.6.11.1. South Korea Market size and forecast, 2016-2026 (USD Million)
        2. 5.6.11.2. South Korea Market size and forecast, 2016-2026 (Tons)
      12. 5.6.12. South-East Asia
        1. 5.6.12.1. South-East Asia Market size and forecast, 2016-2026 (USD Million)
        2. 5.6.12.2. South-East Asia Market size and forecast, 2016-2026 (Tons)
      13. 5.6.13. Rest of Asia Pacific
        1. 5.6.13.1. Rest of Asia Pacific Market size and forecast, 2016-2026 (USD Million)
        2. 5.6.13.2. Rest of Asia Pacific Market size and forecast, 2016-2026 (Tons)
    7. 5.7. Latin America
      1. 5.7.1. Latin America Biopolymers Market size and forecast, 2016-2026
      2. 5.7.2. Latin America Biopolymers Market, by Country, 2019 - 2026 (USD Million)
      3. 5.7.3. Latin America Market size and forecast, 2016-2026 (Tons)
      4. 5.7.4. Latin America Biopolymers Market, by Country, 2019 - 2026 (Tons)
      5. 5.7.5. Latin America Biopolymers Market, by Product Type, 2016-2026
        1. 5.7.5.1. Latin America Biopolymers Market, by Product Type, 2016-2026 (USD Million)
        2. 5.7.5.2. Latin America Biopolymers Market, by Product Type, 2016-2026 (Tons)
      6. 5.7.6. Latin America Biopolymers Market, by Application, 2016-2026
        1. 5.7.6.1. Latin America Biopolymers Market, by Application, 2016-2026 (USD Million)
        2. 5.7.6.2. Latin America Biopolymers Market, by Application, 2016-2026 (Tons)
      7. 5.7.7. Latin America Biopolymers Market, by End-User, 2016-2026
        1. 5.7.7.1. Latin America Biopolymers Market, by End-User, 2016-2026 (USD Million)
        2. 5.7.7.2. Latin America Biopolymers Market, by End-User, 2016-2026 (Tons)
      8. 5.7.8. Brazil
        1. 5.7.8.1. Brazil Market size and forecast, 2016-2026 (USD Million)
        2. 5.7.8.2. Brazil Market size and forecast, 2016-2026 (Tons)
      9. 5.7.9. Mexico
        1. 5.7.9.1. Mexico Market size and forecast, 2016-2026 (USD Million)
        2. 5.7.9.2. Mexico Market size and forecast, 2016-2026 (Tons)
      10. 5.7.10. Rest of Latin America
        1. 5.7.10.1. Rest of Latin America Market size and forecast, 2016-2026 (USD Million)
        2. 5.7.10.2. Rest of Latin America Market size and forecast, 2016-2026 (Tons)
    8. 5.8. The Middle-East and Africa
      1. 5.8.1. The Middle-East and Africa Biopolymers Market size and forecast, 2016-2026
      2. 5.8.2. The Middle-East and Africa Biopolymers Market, by Country, 2019 - 2026 (USD Million)
      3. 5.8.3. The Middle-East and Africa Market size and forecast, 2016-2026 (Tons)
      4. 5.8.4. The Middle-East and Africa Biopolymers Market, by Country, 2019 - 2026 (Tons)
      5. 5.8.5. The Middle-East and Africa Biopolymers Market, by Product Type, 2016-2026
        1. 5.8.5.1. The Middle-East and Africa Biopolymers Market, by Product Type, 2016-2026 (USD Million)
        2. 5.8.5.2. The Middle-East and Africa Biopolymers Market, by Product Type, 2016-2026 (Tons)
      6. 5.8.6. The Middle-East and Africa Biopolymers Market, by Application, 2016-2026
        1. 5.8.6.1. The Middle-East and Africa Biopolymers Market, by Application, 2016-2026 (USD Million)
        2. 5.8.6.2. The Middle-East and Africa Biopolymers Market, by Application, 2016-2026 (Tons)
      7. 5.8.7. The Middle-East and Africa Biopolymers Market, by End-User, 2016-2026
        1. 5.8.7.1. The Middle-East and Africa Biopolymers Market, by End-User, 2016-2026 (USD Million)
        2. 5.8.7.2. The Middle-East and Africa Biopolymers Market, by End-User, 2016-2026 (Tons)
      8. 5.8.8. GCC Countries
        1. 5.8.8.1. GCC Countries Market size and forecast, 2016-2026 (USD Million)
        2. 5.8.8.2. GCC Countries Market size and forecast, 2016-2026 (Tons)
      9. 5.8.9. South Africa
        1. 5.8.9.1. South Africa Market size and forecast, 2016-2026 (USD Million)
        2. 5.8.9.2. South Africa Market size and forecast, 2016-2026 (Tons)
      10. 5.8.10. Rest of Middle-East Africa
        1. 5.8.10.1. Rest of Middle-East Africa Market size and forecast, 2016-2026 (USD Million)
        2. 5.8.10.2. Rest of Middle-East Africa Market size and forecast, 2016-2026 (Tons)
  6. CHAPTER 6. Biopolymers Production, Consumption, Export, Import by Regions
    1. 6.1. Global Biopolymers production and revenue, 2016-2026 (USD Million) (Tons)
    2. 6.2. Global Import and Export Analysis, by Region
  7. CHAPTER 7. Biopolymers market – Competitive Landscape
    1. 7.1. Competitor Market Share – Revenue
    2. 7.2. Market Concentration Rate Analysis, Top 3 and Top 5 Players
    3. 7.3. Competitor Market Share – Volume
    4. 7.4. Strategic Development
      1. 7.4.1. Acquisitions and Mergers
      2. 7.4.2. New Products
      3. 7.4.3. Research & Development Activities
  8. CHAPTER 8. Company Profiles
    1. 8.1. Novamont
      1. 8.1.1. Company Overview
      2. 8.1.2. Novamont Sales, Revenue, Price, and Gross Margin
      3. 8.1.3. Product portfolio
      4. 8.1.4. Recent initiatives
    2. 8.2. Plantic
      1. 8.2.1. Company Overview
      2. 8.2.2. Plantic Sales, Revenue, Price, and Gross Margin
      3. 8.2.3. Product portfolio
      4. 8.2.4. Recent initiatives
    3. 8.3. Arkema
      1. 8.3.1. Company Overview
      2. 8.3.2. Arkema Sales, Revenue, Price, and Gross Margin
      3. 8.3.3. Product portfolio
      4. 8.3.4. Recent initiatives
    4. 8.4. BASF
      1. 8.4.1. Company Overview
      2. 8.4.2. BASF Sales, Revenue, Price, and Gross Margin
      3. 8.4.3. Product portfolio
      4. 8.4.4. Recent initiatives
    5. 8.5. Biopolymer International
      1. 8.5.1. Company Overview
      2. 8.5.2. Biopolymer International Sales, Revenue, Price, and Gross Margin
      3. 8.5.3. Product portfolio
      4. 8.5.4. Recent initiatives
    6. 8.6. DuPont
      1. 8.6.1. Company Overview
      2. 8.6.2. DuPont Sales, Revenue, Price, and Gross Margin
      3. 8.6.3. Product portfolio
      4. 8.6.4. Recent initiatives
    7. 8.7. Ecospan
      1. 8.7.1. Company Overview
      2. 8.7.2. Ecospan Sales, Revenue, Price, and Gross Margin
      3. 8.7.3. Product portfolio
      4. 8.7.4. Recent initiatives
    8. 8.8. Durect Corp.
      1. 8.8.1. Company Overview
      2. 8.8.2. Durect Corp. Sales, Revenue, Price, and Gross Margin
      3. 8.8.3. Product portfolio
      4. 8.8.4. Recent initiatives
    9. 8.9. FMC Biopolymer
      1. 8.9.1. Company Overview
      2. 8.9.2. FMC Biopolymer Sales, Revenue, Price, and Gross Margin
      3. 8.9.3. Product portfolio
      4. 8.9.4. Recent initiatives
    10. 8.10. Biotec Gmbh
      1. 8.10.1. Company Overview
      2. 8.10.2. Biotec Gmbh Sales, Revenue, Price, and Gross Margin
      3. 8.10.3. Product portfolio
      4. 8.10.4. Recent initiatives
    11. 8.11. Braskem
      1. 8.11.1. Company Overview
      2. 8.11.2. Braskem Sales, Revenue, Price, and Gross Margin
      3. 8.11.3. Product portfolio
      4. 8.11.4. Recent initiatives
  9. CHAPTER 9. Biopolymers — Industry Analysis
    1. 9.1. Introduction and Taxonomy
    2. 9.2. Biopolymers Market – Key Trends
      1. 9.2.1. Market Drivers
      2. 9.2.2. Market Restraints
      3. 9.2.3. Market Opportunities
    3. 9.3. Value Chain Analysis
    4. 9.4. Key Mandates and Regulations
    5. 9.5. Technology Roadmap and Timeline
    6. 9.6. Biopolymers market – Attractiveness Analysis
      1. 9.6.1. By Product Type
      2. 9.6.2. By Application
      3. 9.6.3. By End-User
      4. 9.6.4. By Region
  10. CHAPTER 10. Raw Material analysis
    1. 10.1. Biopolymers Key Raw Material Analysis
      1. 10.1.1. Key Raw Materials
      2. 10.1.2. Price Trend of Key Raw Materials
    2. 10.2. Key Suppliers of Raw Materials
    3. 10.3. Proportion of Manufacturing Cost Structure
      1. 10.3.1. Raw Materials
      2. 10.3.2. Labor Cost
    4. 10.4. Manufacturing Expenses Analysis of Biopolymers
  11. CHAPTER 11. Industrial Chain, Sourcing Strategy and Downstream Buyers
    1. 11.1. Biopolymers Industrial Chain Analysis
    2. 11.2. Upstream Raw Materials Sourcing
      1. 11.2.1. Risk Mitigation:
      2. 11.2.2. Supplier Relationships:
      3. 11.2.3. Business Processes:
      4. 11.2.4. Securing the Product:
    3. 11.3. Raw Materials Sources of Biopolymers Major Manufacturers in 2016
    4. 11.4. Downstream Buyers
    5. 11.5. Distributors/Traders List
  12. CHAPTER 12. Marketing Strategy Analysis, Distributors
    1. 12.1. Marketing Channel
    2. 12.2. Direct Marketing
    3. 12.3. Indirect Marketing
    4. 12.4. Marketing Channel Development Trend
    5. 12.5. Economic/Political Environmental Change
  13. CHAPTER 13. Report Conclusion
  14. CHAPTER 14. Research Approach & Methodology
    1. 14.1. Report Description
    2. 14.2. Research Scope
    3. 14.3. Research Methodology
      1. 14.3.1. Secondary Research
      2. 14.3.2. Primary Research
      3. 14.3.3. Models
        1. 14.3.3.1. Company Share Analysis Model
        2. 14.3.3.2. Revenue Based Modeling
        3. 14.3.3.3. Research Limitations

        List of Figures

        FIG. 1 Global Biopolymers Market, 2016-2026 (USD Million)
        FIG. 2 Global Biopolymers Market Share, by  Product Type, 2019 & 2026 (USD Million)
        FIG. 3 Global Biopolymers Market share, by  Product Type, 2019 & 2026 (Tons)
        FIG. 4 Global Bio-PET Biopolymers Market, 2016-2026 (USD Million)
        FIG. 5 Global Bio-PET Biopolymers  Market, 2016-2026 (Tons)
        FIG. 6 Global Bio-PE Biopolymers Market, 2016-2026 (USD Million)
        FIG. 7 Global Bio-PE Biopolymers  Market, 2016-2026 (Tons)
        FIG. 8 Global Polylactic acid Biopolymers Market, 2016-2026 (USD Million)
        FIG. 9 Global Polylactic acid Biopolymers  Market, 2016-2026 (Tons)
        FIG. 10 Global Biodegradable polyesters Biopolymers Market, 2016-2026 (USD Million)
        FIG. 11 Global Biodegradable polyesters Biopolymers  Market, 2016-2026 (Tons)
        FIG. 12 Global Others Biopolymers Market, 2016-2026 (USD Million)
        FIG. 13 Global Others Biopolymers  Market, 2016-2026 (Tons)
        FIG. 14 Global Biopolymers Market Share, by  Application, 2019 & 2026 (USD Million)
        FIG. 15 Global Biopolymers Market share, by  Application, 2019 & 2026 (Tons)
        FIG. 16 Global Packaging Biopolymers Market, 2016-2026 (USD Million)
        FIG. 17 Global Packaging Biopolymers  Market, 2016-2026 (Tons)
        FIG. 18 Global Fibers Biopolymers Market, 2016-2026 (USD Million)
        FIG. 19 Global Fibers Biopolymers  Market, 2016-2026 (Tons)
        FIG. 20 Global Cosmetics Biopolymers Market, 2016-2026 (USD Million)
        FIG. 21 Global Cosmetics Biopolymers  Market, 2016-2026 (Tons)
        FIG. 22 Global Agriculture seed coatings Biopolymers Market, 2016-2026 (USD Million)
        FIG. 23 Global Agriculture seed coatings Biopolymers  Market, 2016-2026 (Tons)
        FIG. 24 Global Automotive interior parts Biopolymers Market, 2016-2026 (USD Million)
        FIG. 25 Global Automotive interior parts Biopolymers  Market, 2016-2026 (Tons)
        FIG. 26 Global Others Biopolymers Market, 2016-2026 (USD Million)
        FIG. 27 Global Others Biopolymers  Market, 2016-2026 (Tons)
        FIG. 28 Global Biopolymers Market Share, by End-User, 2019 & 2026 (USD Million)
        FIG. 29 Global Biopolymers Market share, by End-User, 2019 & 2026 (Tons)
        FIG. 30 Global Food and Beverages Biopolymers Market, 2016-2026 (USD Million)
        FIG. 31 Global Food and Beverages Biopolymers  Market, 2016-2026 (Tons)
        FIG. 32 Global Automotive Industry Biopolymers Market, 2016-2026 (USD Million)
        FIG. 33 Global Automotive Industry Biopolymers  Market, 2016-2026 (Tons)
        FIG. 34 Global Healthcare Biopolymers Market, 2016-2026 (USD Million)
        FIG. 35 Global Healthcare Biopolymers  Market, 2016-2026 (Tons)
        FIG. 36 Global Agriculture Biopolymers Market, 2016-2026 (USD Million)
        FIG. 37 Global Agriculture Biopolymers  Market, 2016-2026 (Tons)
        FIG. 38 Global Chemicals industry Biopolymers Market, 2016-2026 (USD Million)
        FIG. 39 Global Chemicals industry Biopolymers  Market, 2016-2026 (Tons)
        FIG. 40 Global Semiconductor & Electronics Biopolymers Market, 2016-2026 (USD Million)
        FIG. 41 Global Semiconductor & Electronics Biopolymers  Market, 2016-2026 (Tons)
        FIG. 42 Global Biopolymers Market Share, by Region, 2019 & 2026
        FIG. 43 Global Biopolymers Market Share, by Region, 2019 & 2026
        FIG. 44 North America Biopolymers Market, 2016-2026
        FIG. 45 North America Biopolymers  Market, 2016-2026 (Tons)
        FIG. 46 U.S. Biopolymers Market, 2016-2026
        FIG. 47 U.S. Biopolymers  Market, 2016-2026 (Tons)
        FIG. 48 Canada Biopolymers Market, 2016-2026
        FIG. 49 Canada Biopolymers  Market, 2016-2026 (Tons)
        FIG. 50 Europe Biopolymers Market, 2016-2026
        FIG. 51 Europe Biopolymers  Market, 2016-2026 (Tons)
        FIG. 52 Germany Biopolymers Market, 2016-2026
        FIG. 53 Germany Biopolymers  Market, 2016-2026 (Tons)
        FIG. 54 France Biopolymers Market, 2016-2026
        FIG. 55 France Biopolymers  Market, 2016-2026 (Tons)
        FIG. 56 U.K. Biopolymers Market, 2016-2026
        FIG. 57 U.K. Biopolymers  Market, 2016-2026 (Tons)
        FIG. 58 Italy Biopolymers Market, 2016-2026
        FIG. 59 Italy Biopolymers  Market, 2016-2026 (Tons)
        FIG. 60 Spain Biopolymers Market, 2016-2026
        FIG. 61 Spain Biopolymers  Market, 2016-2026 (Tons)
        FIG. 62 Rest of Europe Biopolymers Market, 2016-2026
        FIG. 63 Rest of Europe Biopolymers  Market, 2016-2026 (Tons)
        FIG. 64 Asia Pacific Biopolymers Market, 2016-2026
        FIG. 65 Asia Pacific Biopolymers  Market, 2016-2026 (Tons)
        FIG. 66 China Biopolymers Market, 2016-2026
        FIG. 67 China Biopolymers  Market, 2016-2026 (Tons)
        FIG. 68 Japan Biopolymers Market, 2016-2026
        FIG. 69 Japan Biopolymers  Market, 2016-2026 (Tons)
        FIG. 70 India Biopolymers Market, 2016-2026
        FIG. 71 India Biopolymers  Market, 2016-2026 (Tons)
        FIG. 72 South  Korea Biopolymers Market, 2016-2026
        FIG. 73 South  Korea Biopolymers  Market, 2016-2026 (Tons)
        FIG. 74 South-East Asia Biopolymers Market, 2016-2026
        FIG. 75 South-East Asia Biopolymers  Market, 2016-2026 (Tons)
        FIG. 76 Rest of Asia Pacific Biopolymers Market, 2016-2026
        FIG. 77 Rest of Asia Pacific Biopolymers  Market, 2016-2026 (Tons)
        FIG. 78 Latin America Biopolymers Market, 2016-2026
        FIG. 79 Latin America Biopolymers  Market, 2016-2026 (Tons)
        FIG. 80 Brazil Biopolymers Market, 2016-2026
        FIG. 81 Brazil Biopolymers  Market, 2016-2026 (Tons)
        FIG. 82 Mexico Biopolymers Market, 2016-2026
        FIG. 83 Mexico Biopolymers  Market, 2016-2026 (Tons)
        FIG. 84 Rest of Latin America Biopolymers Market, 2016-2026
        FIG. 85 Rest of Latin America Biopolymers  Market, 2016-2026 (Tons)
        FIG. 86 The Middle-East and Africa Biopolymers Market, 2016-2026
        FIG. 87 The Middle-East and Africa Biopolymers  Market, 2016-2026 (Tons)
        FIG. 88 GCC Countries Biopolymers Market, 2016-2026
        FIG. 89 GCC Countries Biopolymers  Market, 2016-2026 (Tons)
        FIG. 90 South Africa Biopolymers Market, 2016-2026
        FIG. 91 South Africa Biopolymers  Market, 2016-2026 (Tons)
        FIG. 92 Rest of Middle-East Africa Biopolymers Market, 2016-2026
        FIG. 93 Rest of Middle-East Africa Biopolymers  Market, 2016-2026 (Tons)
        FIG. 94 Global Biopolymers production and revenue, 2016-2026 (USD Million) (Tons)
        FIG. 95 North America Biopolymers production and revenue, 2016-2026 (USD Million) (Tons)
        FIG. 96 Europe Biopolymers production and revenue, 2016-2026 (USD Million) (Tons)
        FIG. 97 Asia Pacific Biopolymers production and revenue, 2016-2026 (USD Million) (Tons)
        FIG. 98 Latin America Biopolymers production and revenue, 2016-2026 (USD Million) (Tons)
        FIG. 99 Middle East and Africa Biopolymers production and revenue, 2016-2026 (USD Million) (Tons)
        FIG. 100 Competitor Market Share – Revenue
        FIG. 101 Competitor Market Share – Volume
        FIG. 102 Novamont Revenue and Growth Rate
        FIG. 103 Novamont Market Share
        FIG. 104 Plantic Revenue and Growth Rate
        FIG. 105 Plantic Market Share
        FIG. 106 Arkema Revenue and Growth Rate
        FIG. 107 Arkema Market Share
        FIG. 108 BASF Revenue and Growth Rate
        FIG. 109 BASF Market Share
        FIG. 110 Biopolymer International Revenue and Growth Rate
        FIG. 111 Biopolymer International Market Share
        FIG. 112 DuPont Revenue and Growth Rate
        FIG. 113 DuPont Market Share
        FIG. 114 Ecospan Revenue and Growth Rate
        FIG. 115 Ecospan Market Share
        FIG. 116 Durect Corp. Revenue and Growth Rate
        FIG. 117 Durect Corp. Market Share
        FIG. 118 FMC Biopolymer Revenue and Growth Rate
        FIG. 119 FMC Biopolymer Market Share
        FIG. 120 Biotec Gmbh Revenue and Growth Rate
        FIG. 121 Biotec Gmbh Market Share
        FIG. 122 Braskem Revenue and Growth Rate
        FIG. 123 Braskem Market Share
        FIG. 124 Market Dynamics
        FIG. 125 Global Biopolymers – Value Chain Analysis
        FIG. 126 Key Mandates and Regulations
        FIG. 127 Technology Roadmap and Timeline
        FIG. 128 Market Attractiveness Analysis – By  Product Type
        FIG. 129 Market Attractiveness Analysis – By  Application
        FIG. 130 Market Attractiveness Analysis – By End-User
        FIG. 131 Market Attractiveness Analysis – By Region
        FIG. 132 Manufacturing Cost Structure of Biopolymers
        FIG. 133 Biopolymers Industrial Chain Analysis
        FIG. 134 Market Channel
        FIG. 135 Marketing Channel Development Trend
        FIG. 136 Growth in World Gross Product, 2008-2019


        List of Tables

        TABLE 1 Global Biopolymers market, 2019 & 2026 (USD Million)
        TABLE 2 Global Biopolymers market, by  Product Type, 2016-2026 (USD Million)
        TABLE 3 Global Biopolymers market, by  Product Type, 2016-2026 (Tons)
        TABLE 4 Global Biopolymers market, by  Application, 2016-2026 (USD Million)
        TABLE 5 Global Biopolymers market, by  Application, 2016-2026 (Tons)
        TABLE 6 Global Biopolymers market, by End-User, 2016-2026 (USD Million)
        TABLE 7 Global Biopolymers market, by End-User, 2016-2026 (Tons)
        TABLE 8 Global Biopolymers market, by region, 2016-2026 (USD Million)
        TABLE 9 Global Biopolymers market, by region, 2016-2026 (Tons)
        TABLE 10 North America Biopolymers Market, by  Product Type, 2016-2026 (USD Million)
        TABLE 11 North America Biopolymers Market, by  Product Type, 2016-2026 (Tons)
        TABLE 12 North America Biopolymers Market, by  Application, 2016-2026 (USD Million)
        TABLE 13 North America Biopolymers Market, by  Application, 2016-2026 (Tons)
        TABLE 14 North America Biopolymers Market, by End-User, 2016-2026 (USD Million)
        TABLE 15 North America Biopolymers Market, by End-User, 2016-2026 (Tons)
        TABLE 16 Europe Biopolymers Market, by  Product Type, 2016-2026 (USD Million)
        TABLE 17 Europe Biopolymers Market, by  Product Type, 2016-2026 (Tons)
        TABLE 18 Europe Biopolymers Market, by  Application, 2016-2026 (USD Million)
        TABLE 19 Europe Biopolymers Market, by  Application, 2016-2026 (Tons)
        TABLE 20 Europe Biopolymers Market, by End-User, 2016-2026 (USD Million)
        TABLE 21 Europe Biopolymers Market, by End-User, 2016-2026 (Tons)
        TABLE 22 Asia Pacific Biopolymers Market, by  Product Type, 2016-2026 (USD Million)
        TABLE 23 Asia Pacific Biopolymers Market, by  Product Type, 2016-2026 (Tons)
        TABLE 24 Asia Pacific Biopolymers Market, by  Application, 2016-2026 (USD Million)
        TABLE 25 Asia Pacific Biopolymers Market, by  Application, 2016-2026 (Tons)
        TABLE 26 Asia Pacific Biopolymers Market, by End-User, 2016-2026 (USD Million)
        TABLE 27 Asia Pacific Biopolymers Market, by End-User, 2016-2026 (Tons)
        TABLE 28 Latin America Biopolymers Market, by  Product Type, 2016-2026 (USD Million)
        TABLE 29 Latin America Biopolymers Market, by  Product Type, 2016-2026 (Tons)
        TABLE 30 Latin America Biopolymers Market, by  Application, 2016-2026 (USD Million)
        TABLE 31 Latin America Biopolymers Market, by  Application, 2016-2026 (Tons)
        TABLE 32 Latin America Biopolymers Market, by End-User, 2016-2026 (USD Million)
        TABLE 33 Latin America Biopolymers Market, by End-User, 2016-2026 (Tons)
        TABLE 34 The Middle-East and Africa Biopolymers Market, by  Product Type, 2016-2026 (USD Million)
        TABLE 35 The Middle-East and Africa Biopolymers Market, by  Product Type, 2016-2026 (Tons)
        TABLE 36 The Middle-East and Africa Biopolymers Market, by  Application, 2016-2026 (USD Million)
        TABLE 37 The Middle-East and Africa Biopolymers Market, by  Application, 2016-2026 (Tons)
        TABLE 38 The Middle-East and Africa Biopolymers Market, by End-User, 2016-2026 (USD Million)
        TABLE 39 The Middle-East and Africa Biopolymers Market, by End-User, 2016-2026 (Tons)
        TABLE 40 North America Biopolymers Production, Consumption, Export, Import, 2016-2019
        TABLE 41 Europe Biopolymers Production, Consumption, Export, Import, 2016-2019
        TABLE 42 Asia Pacific Biopolymers Production, Consumption, Export, Import, 2016-2019
        TABLE 43 Latin America Biopolymers Production, Consumption, Export, Import, 2016-2019
        TABLE 44 Middle East & Africa Biopolymers Production, Consumption, Export, Import, 2016-2019
        TABLE 45 Global Biopolymers Market - Company Revenue Analysis 2016-2019 (USD Million)
        TABLE 46 Global Biopolymers Market - Company Revenue Share Analysis 2016-2019(%)
        TABLE 47 Global Biopolymers Market - Company Volume Analysis 2016-2019 (Tons)
        TABLE 48 Global Biopolymers Market - Company Volume Share Analysis 2016-2019(%)
        TABLE 49 Acquisitions and Mergers
        TABLE 50 New Product/Service Launch
        TABLE 51 Research & Development Activities
        TABLE 52 Market Drivers
        TABLE 53 Market Restraints
        TABLE 54 Market Opportunities
        TABLE 55 Production Base and Market Concentration Rate of Raw Material
        TABLE 56 Key Suppliers of Raw Materials
        TABLE 57 Raw Materials Sources of Biopolymers Major Manufacturers in 2016
        TABLE 58 Major Buyers of Biopolymers
        TABLE 59 Distributors/Traders of Biopolymers by Region

Industry Major Market Players

  • Plantic
  •  BASF
  •  DuPont
  •  Durect Corp.
  •  BiotecGmbh
  •  Novamont
  •  Arkema