Search Market Research Report

Discover Our Latest Reports
Discover Our Featured Reports
Discover Top Selling Reports

Biomass Pellets Market Size, Share Global Analysis Report, 2020–2026

report img

Biomass Pellets Market By Source (Agriculture Residue, Wood Sawdust, Others) and By End-Use (Power Generation, Industrial Heating, Commercial and Domestic Heating and Others): Global Industry Outlook, Market Size, Business Intelligence, Consumer Preferences, Statistical Surveys, Comprehensive Analysis, Historical Developments, Current Trends, and Forecast 2020–2026

Industry Insights

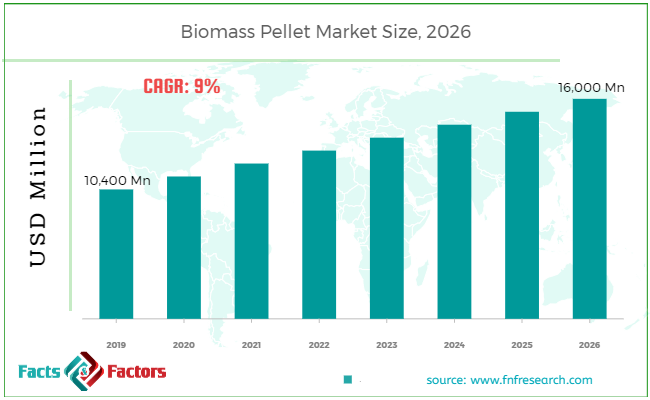
[180+ Pages Report] According to the report published by Facts Factors, the global biomass pellets market size was worth around 10,400 million in 2019 and is predicted to grow to around 16,000 million by 2026 with a compound annual growth rate (CAGR) of roughly 9% between 2020 and 2026. The report analyzes the global biomass pellets market drivers, restraints/challenges, and the effect they have on the demands during the projection period. In addition, the report explores emerging opportunities in the biomass pellets market.

Biomass Pellets Market Size

To know more about this report | Request Free Sample Copy

This specialized and expertise-oriented industry research report scrutinizes the technical and commercial business outlook of the Biomass Pellets industry. The report analyzes and declares the historical and current trends analysis of the Biomass Pellets industry and subsequently recommends the projected trends anticipated to be observed in the Biomass Pellets market during the upcoming years.

The biomass pellets market report analyzes and notifies the industry statistics at the global as well as regional and country levels in order to acquire a thorough perspective of the entire Biomass Pellets market. The historical and past insights are provided for FY 2016 to FY 2019 whereas projected trends are delivered for FY 2020 to FY 2026. The quantitative and numerical data is represented in terms of both volume (Kilo Tons) and value (USD Million) from FY 2016 – 2026.


logoKey Insights from Primary Research

  • As per our primary respondents, the biomass pellets market is set to grow annually at a rate of around 9%
  • It was recognized through primary research that the biomass pellets market was valued at around USD 10400 million in 2019.
  • Europe is expected to hold the largest market share of biomass pellets in terms of revenue, in 2019.
  • According to type segmentation the “Wood Sawdust” category, was the leading revenue-generating category in 2019.
  • The “Industrial Heating” category, on the basis of application segmentation, contributes to the highest revenue-generating category.

logoKey Recommendations from Analysts

  • As per our Analysts, Europe is projected to have a significant demand for biomass pellets in the forthcoming time owing to a rise in use for room heating applications. Growing awareness about greenhouse emissions and government policies are expected to shift consumers from fossil fuels to biomass pellets.
  • Germany and the U.K. are expected to generate major revenue from biomass pellets for the European Region.
  • Asia Pacific region is estimated to grow at a significant growth rate in the forecasted period.  The significant growth of the Asia Pacific is estimated to get fueled by the rising demand for biomass pellets in the power plant application for electricity generation. China is expected to become the largest contributor to renewable energy in the forecasted period.
  • To maintain the high calorific value, biomass pellets are needed to store carefully that increases the overall storage and inventory cost.
  • The industrial heating market is expected to grow at a significant rate owing to high efficiency and affordable pricing is driving the industrial heating market in the forecasted time.

logoBiomass Pellets Market Share in 2019, by Application


The quantitative data is further underlined and reinforced by comprehensive qualitative data which comprises various across-the-board market dynamics. The rationales which directly or indirectly impact the Biomass Pellets industry are exemplified through parameters such as growth drivers, restraints, challenges, and opportunities among other impacting factors.

Throughout our research report, we have encompassed all the proven models and tools of industry analysis and extensively illustrated all the key business strategies and business models adopted in the Biomass Pellets industry. The report provides an all-inclusive and detailed competitive landscape prevalent in the Biomass Pellets market.

The report utilizes established industry analysis tools and models such as Porter’s Five Forces framework to analyze and recognize critical business strategies adopted by various stakeholders involved in the entire value chain of the Biomass Pellets industry. The Biomass Pellets market report additionally employs SWOT analysis and PESTLE analysis models for further in-depth analysis.

The report study further includes an in-depth analysis of industry players' market shares and provides an overview of leading players' market position in the Biomass Pellets sector. Key strategic developments in the Biomass Pellets market competitive landscape such as acquisitions & mergers, inaugurations of different products and services, partnerships & joint ventures, MoU agreements, VC & funding activities, R&D activities, and geographic expansion among other noteworthy activities by key players of the Biomass Pellets market are appropriately highlighted in the report.

The Biomass Pellets market research report delivers an acute valuation and taxonomy of the Biomass Pellets industry by practically splitting the market on the basis of different types, applications, and regions. Through the analysis of the historical and projected trends, all the segments and sub-segments were evaluated through the bottom-up approach, and different market sizes have been projected for FY 2020 to FY 2026.

logoReport Scope

Report Attribute

Details

Market Size in 2019

USD 10,400 Million

Projected Market Size in 2026

USD 16,000 Million

CAGR Growth Rate

9% CAGR

Base Year

2019

Forecast Years

2020-2026

Key Market Players

Westervelt Renewable Energy LLC, Enviva Biomass, Drax Biomass Inc., Renetech Inc., Enviva Partners, LP, German Pellets GmgH, AS Graanul Invest, Pinnacle Renewable Energy Inc., Lignetics Of Idaho Inc., Zilkha Biomass Energy, LLC, Premium Pellets Ltd., Fram Renewable Fuels, Abellon Clean Energy Ltd., Subham Industries, Nishant Bioenergy Private Energy, MVM Bio Green Energy Eco Equipment, Ecostan India Private Ltd., JP Green Fuels, Kushal Timber Private Ltd., Forest Energy Corporation Helius Energy Ltd., New England Wood Pellet., Viridis Energy Inc, International WoodFuels LLC, and Energex.

Key Segment

By Source, End-Use, and Region

Major Regions Covered

North America, Europe, Asia Pacific, Latin America, and the Middle East & Africa

Purchase Options

Request customized purchase options to meet your research needs.Explore purchase options

The regional segmentation of the Biomass Pellets industry includes the complete classification of all the major continents including North America, Latin America, Europe, Asia Pacific, and Middle East & Africa. Further, country-wise data for the Biomass Pellets industry is provided for the leading economies of the world.

The Biomass Pellets market is segmented based on Source and Application.  On the basis of type segmentation, the market is classified into agriculture residue, wood sawdust, and others. In terms of Application segmentation, the market is bifurcated into power generation, industrial heating, commercial and domestic heating, and others.

logoCompetitive Analysis

Some of the essential players operating in the Biomass Pellets market, but not restricted to include:

  • Westervelt Renewable Energy LLC
  • Enviva Biomass
  • Drax Biomass Inc.
  • Renetech Inc.
  • Enviva Partners
  • LP
  • German Pellets GmgH
  • AS Graanul Invest
  • Pinnacle Renewable Energy Inc.
  • Lignetics Of Idaho Inc.
  • Zilkha Biomass Energy LLC
  • Premium Pellets Ltd.
  • Fram Renewable Fuels
  • Abellon Clean Energy Ltd.
  • Subham Industries
  • Nishant Bioenergy Private Energy
  • MVM Bio Green Energy Eco Equipment
  • Ecostan India Private Ltd.
  • JP Green Fuels
  • Kushal Timber Private Ltd.
  • Forest Energy Corporation Helius Energy Ltd.
  • New England Wood Pellet.
  • Viridis Energy Inc
  • International WoodFuels LLC
  • Energex

The taxonomy of the Biomass Pellets Market by its scope and segmentation is as follows:

logo By Source Segmentation Analysis

  • Agriculture Residue
  • Wood Sawdust
  • Others

logo By Application Segmentation Analysis

  • Power Generation
  • Industrial Heating
  • Commercial and Domestic Heating
  • Others

logo By Regional Segmentation Analysis

  • North America
    • The U.S.
    • Canada
  • Europe
    • Germany
    • The UK
    • France
    • Spain
    • Italy
    • Rest of Europe
  • Asia Pacific
    • China
    • Japan
    • India
    • South Korea
    • Southeast Asia
    • Rest of Asia Pacific
  • Latin America
    • Brazil
    • Mexico
    • Rest of Latin America
  • Middle East & Africa
    • GCC
    • South Africa
    • Rest of Middle East & Africa

Table of Content

  1. CHAPTER 1. Executive Summary
  2. CHAPTER 2. Biomass Pellets market – Source Analysis
    1. 2.1. Global Biomass Pellets Market – Source Overview
    2. 2.2. Global Biomass Pellets Market Share, by Source, 2019 & 2026 (USD Million)
    3. 2.3. Global Biomass Pellets Market share, by Source, 2019 & 2026 (Kilo Tons)
    4. 2.4. Agriculture Residue
      1. 2.4.1. Global Agriculture Residue Biomass Pellets Market, 2016-2026 (USD Million)
      2. 2.4.2. Global Agriculture Residue Biomass Pellets Market, 2016-2026 (Kilo Tons)
    5. 2.5. Wood Sawdust
      1. 2.5.1. Global Wood Sawdust Biomass Pellets Market, 2016-2026 (USD Million)
      2. 2.5.2. Global Wood Sawdust Biomass Pellets Market, 2016-2026 (Kilo Tons)
    6. 2.6. Others
      1. 2.6.1. Global Others Biomass Pellets Market, 2016-2026 (USD Million)
      2. 2.6.2. Global Others Biomass Pellets Market, 2016-2026 (Kilo Tons)
  3. CHAPTER 3. Biomass Pellets market – End Use Analysis
    1. 3.1. Global Biomass Pellets Market – End Use Overview
    2. 3.2. Global Biomass Pellets Market Share, by End Use, 2019 & 2026 (USD Million)
    3. 3.3. Global Biomass Pellets Market share, by End Use, 2019 & 2026 (Kilo Tons)
    4. 3.4. Power Generation
      1. 3.4.1. Global Power Generation Biomass Pellets Market, 2016-2026 (USD Million)
      2. 3.4.2. Global Power Generation Biomass Pellets Market, 2016-2026 (Kilo Tons)
    5. 3.5. Industrial Heating
      1. 3.5.1. Global Industrial Heating Biomass Pellets Market, 2016-2026 (USD Million)
      2. 3.5.2. Global Industrial Heating Biomass Pellets Market, 2016-2026 (Kilo Tons)
    6. 3.6. Commercial and Domestic Heating
      1. 3.6.1. Global Commercial and Domestic Heating Biomass Pellets Market, 2016-2026 (USD Million)
      2. 3.6.2. Global Commercial and Domestic Heating Biomass Pellets Market, 2016-2026 (Kilo Tons)
    7. 3.7. Others
      1. 3.7.1. Global Others Biomass Pellets Market, 2016-2026 (USD Million)
      2. 3.7.2. Global Others Biomass Pellets Market, 2016-2026 (Kilo Tons)
  4. CHAPTER 4. Biomass Pellets market – Regional Analysis
    1. 4.1. Global Biomass Pellets Market Regional Overview
    2. 4.2. Global Biomass Pellets Market Share, by Region, 2019 & 2026 (Value)
    3. 4.3. Global Biomass Pellets Market Share, by Region, 2019 & 2026 (Volume)
    4. 4.4. North America
      1. 4.4.1. North America Biomass Pellets Market size and forecast, 2016-2026
      2. 4.4.2. North America Biomass Pellets Market, by Country, 2018 - 2025 (USD Million)
      3. 4.4.3. North America Market size and forecast, 2016-2026 (Kilo Tons)
      4. 4.4.4. North America Biomass Pellets Market, by Country, 2018 - 2025 (Kilo Tons)
      5. 4.4.5. North America Biomass Pellets Market, by Source, 2016-2026
      6. 4.4.6. North America Biomass Pellets Market, by End Use, 2016-2026
        1. 4.4.7. U.S.
    5. 4.4.8. Canada
  5. 4.5. Europe
    1. 4.5.1. Europe Biomass Pellets Market size and forecast, 2016-2026
    2. 4.5.2. Europe Biomass Pellets Market, by Country, 2018 - 2025 (USD Million)
    3. 4.5.3. Europe Market size and forecast, 2016-2026 (Kilo Tons)
    4. 4.5.4. Europe Biomass Pellets Market, by Country, 2018 - 2025 (Kilo Tons)
    5. 4.5.5. Europe Biomass Pellets Market, by Source, 2016-2026
    6. 4.5.6. Europe Biomass Pellets Market, by End Use, 2016-2026
    7. 4.5.7. Germany
    8. 4.5.8. France
      1. 4.5.9. U.K.
  6. 4.5.10. Italy
  7. 4.5.11. Spain
  8. 4.5.12. Rest of Europe
  • 4.6. Asia Pacific
    1. 4.6.1. Asia Pacific Biomass Pellets Market size and forecast, 2016-2026
    2. 4.6.2. Asia Pacific Biomass Pellets Market, by Country, 2018 - 2025 (USD Million)
    3. 4.6.3. Asia Pacific Market size and forecast, 2016-2026 (Kilo Tons)
    4. 4.6.4. Asia Pacific Biomass Pellets Market, by Country, 2018 - 2025 (Kilo Tons)
    5. 4.6.5. Asia Pacific Biomass Pellets Market, by Source, 2016-2026
    6. 4.6.6. Asia Pacific Biomass Pellets Market, by End Use, 2016-2026
    7. 4.6.7. China
    8. 4.6.8. Japan
    9. 4.6.9. India
    10. 4.6.10. South Korea
    11. 4.6.11. South-East Asia
    12. 4.6.12. Rest of Asia Pacific
  • 4.7. Latin America
    1. 4.7.1. Latin America Biomass Pellets Market size and forecast, 2016-2026
    2. 4.7.2. Latin America Biomass Pellets Market, by Country, 2018 - 2025 (USD Million)
    3. 4.7.3. Latin America Market size and forecast, 2016-2026 (Kilo Tons)
    4. 4.7.4. Latin America Biomass Pellets Market, by Country, 2018 - 2025 (Kilo Tons)
    5. 4.7.5. Latin America Biomass Pellets Market, by Source, 2016-2026
    6. 4.7.6. Latin America Biomass Pellets Market, by End Use, 2016-2026
    7. 4.7.7. Brazil
    8. 4.7.8. Mexico
    9. 4.7.9. Rest of Latin America
  • 4.8. The Middle-East and Africa
    1. 4.8.1. The Middle-East and Africa Biomass Pellets Market size and forecast, 2016-2026
    2. 4.8.2. The Middle-East and Africa Biomass Pellets Market, by Country, 2018 - 2025 (USD Million)
    3. 4.8.3. The Middle-East and Africa Market size and forecast, 2016-2026 (Kilo Tons)
    4. 4.8.4. The Middle-East and Africa Biomass Pellets Market, by Country, 2018 - 2025 (Kilo Tons)
    5. 4.8.5. The Middle-East and Africa Biomass Pellets Market, by Source, 2016-2026
    6. 4.8.6. The Middle-East and Africa Biomass Pellets Market, by End Use, 2016-2026
    7. 4.8.7. GCC Countries
    8. 4.8.8. South Africa
    9. 4.8.9. Rest of Middle-East Africa
  • CHAPTER 5. Biomass Pellets Production, Consumption, Export, Import by Regions
    1. 5.1. Global Biomass Pellets production and revenue, 2015-2025 (USD Million) (Kilo Tons)
    2. 5.2. Global Import and Export Analysis, by Region
  • CHAPTER 6. Biomass Pellets market – Competitive Landscape
    1. 6.1. Competitor Market Share – Revenue
    2. 6.2. Market Concentration Rate Analysis, Top 3 and Top 5 Players
    3. 6.3. Competitor Market Share – Volume
    4. 6.4. Strategic Development
      1. 6.4.1. Acquisitions and Mergers
      2. 6.4.2. New Products
      3. 6.4.3. Research & Development Activities
  • CHAPTER 7. Company Profiles
    1. 7.1. Westervelt Renewable Energy LLC
      1. 7.1.1. Company Overview
      2. 7.1.2. Westervelt Renewable Energy LLC Sales, Revenue, Price, and Gross Margin
      3. 7.1.3. Product portfolio
      4. 7.1.4. Recent initiatives
    2. 7.2. Enviva Biomass
      1. 7.2.1. Company Overview
      2. 7.2.2. Enviva Biomass Sales, Revenue, Price, and Gross Margin
      3. 7.2.3. Product portfolio
      4. 7.2.4. Recent initiatives
    3. 7.3. Drax Biomass Inc.
      1. 7.3.1. Company Overview
      2. 7.3.2. Drax Biomass Inc. Sales, Revenue, Price, and Gross Margin
      3. 7.3.3. Product portfolio
      4. 7.3.4. Recent initiatives
    4. 7.4. Renetech Inc.
      1. 7.4.1. Company Overview
      2. 7.4.2. Renetech Inc. Sales, Revenue, Price, and Gross Margin
      3. 7.4.3. Product portfolio
      4. 7.4.4. Recent initiatives
    5. 7.5. Enviva Partners, LP
      1. 7.5.1. Company Overview
      2. 7.5.2. Enviva Partners, LP Sales, Revenue, Price, and Gross Margin
      3. 7.5.3. Product portfolio
      4. 7.5.4. Recent initiatives
    6. 7.6. German Pellets GmgH
      1. 7.6.1. Company Overview
      2. 7.6.2. German Pellets GmgH Sales, Revenue, Price, and Gross Margin
      3. 7.6.3. Product portfolio
      4. 7.6.4. Recent initiatives
    7. 7.7. AS Graanul Invest
      1. 7.7.1. Company Overview
      2. 7.7.2. AS Graanul Invest Sales, Revenue, Price, and Gross Margin
      3. 7.7.3. Product portfolio
      4. 7.7.4. Recent initiatives
    8. 7.8. Pinnacle Renewable Energy Inc.
      1. 7.8.1. Company Overview
      2. 7.8.2. Pinnacle Renewable Energy Inc. Sales, Revenue, Price, and Gross Margin
      3. 7.8.3. Product portfolio
      4. 7.8.4. Recent initiatives
    9. 7.9. Lignetics Of Idaho Inc.
      1. 7.9.1. Company Overview
      2. 7.9.2. Lignetics Of Idaho Inc. Sales, Revenue, Price, and Gross Margin
      3. 7.9.3. Product portfolio
      4. 7.9.4. Recent initiatives
    10. 7.10. Zilkha Biomass Energy, LLC
      1. 7.10.1. Company Overview
      2. 7.10.2. Zilkha Biomass Energy, LLC Sales, Revenue, Price, and Gross Margin
      3. 7.10.3. Product portfolio
      4. 7.10.4. Recent initiatives
    11. 7.11. Premium Pellets Ltd.
      1. 7.11.1. Company Overview
      2. 7.11.2. Premium Pellets Ltd. Sales, Revenue, Price, and Gross Margin
      3. 7.11.3. Product portfolio
      4. 7.11.4. Recent initiatives
    12. 7.12. Fram Renewable Fuels
      1. 7.12.1. Company Overview
      2. 7.12.2. Fram Renewable Fuels Sales, Revenue, Price, and Gross Margin
      3. 7.12.3. Product portfolio
      4. 7.12.4. Recent initiatives
    13. 7.13. Abellon Clean Energy Ltd.
      1. 7.13.1. Company Overview
      2. 7.13.2. Abellon Clean Energy Ltd. Sales, Revenue, Price, and Gross Margin
      3. 7.13.3. Product portfolio
      4. 7.13.4. Recent initiatives
    14. 7.14. Subham Industries
      1. 7.14.1. Company Overview
      2. 7.14.2. Subham Industries Sales, Revenue, Price, and Gross Margin
      3. 7.14.3. Product portfolio
      4. 7.14.4. Recent initiatives
    15. 7.15. Nishant Bioenergy Private Energy
      1. 7.15.1. Company Overview
      2. 7.15.2. Nishant Bioenergy Private Energy Sales, Revenue, Price, and Gross Margin
      3. 7.15.3. Product portfolio
      4. 7.15.4. Recent initiatives
    16. 7.16. MVM Bio Green Energy Eco Equipment
      1. 7.16.1. Company Overview
      2. 7.16.2. MVM Bio Green Energy Eco Equipment Sales, Revenue, Price, and Gross Margin
      3. 7.16.3. Product portfolio
      4. 7.16.4. Recent initiatives
    17. 7.17. Ecostan India Private Ltd.
      1. 7.17.1. Company Overview
      2. 7.17.2. Ecostan India Private Ltd. Sales, Revenue, Price, and Gross Margin
      3. 7.17.3. Product portfolio
      4. 7.17.4. Recent initiatives
    18. 7.18. JP Green Fuels
      1. 7.18.1. Company Overview
      2. 7.18.2. JP Green Fuels Sales, Revenue, Price, and Gross Margin
      3. 7.18.3. Product portfolio
      4. 7.18.4. Recent initiatives
    19. 7.19. Kushal Timber Private Ltd.
      1. 7.19.1. Company Overview
      2. 7.19.2. Kushal Timber Private Ltd. Sales, Revenue, Price, and Gross Margin
      3. 7.19.3. Product portfolio
      4. 7.19.4. Recent initiatives
    20. 7.20. Forest Energy Corporation
      1. 7.20.1. Company Overview
      2. 7.20.2. Forest Energy Corporation Sales, Revenue, Price, and Gross Margin
      3. 7.20.3. Product portfolio
      4. 7.20.4. Recent initiatives
    21. 7.21. Helius Energy Ltd.
      1. 7.21.1. Company Overview
      2. 7.21.2. Helius Energy Ltd. Sales, Revenue, Price, and Gross Margin
      3. 7.21.3. Product portfolio
      4. 7.21.4. Recent initiatives
    22. 7.22. New England Wood Pellet.
      1. 7.22.1. Company Overview
      2. 7.22.2. New England Wood Pellet. Sales, Revenue, Price, and Gross Margin
      3. 7.22.3. Product portfolio
      4. 7.22.4. Recent initiatives
    23. 7.23. Viridis Energy Inc
      1. 7.23.1. Company Overview
      2. 7.23.2. Viridis Energy Inc Sales, Revenue, Price, and Gross Margin
      3. 7.23.3. Product portfolio
      4. 7.23.4. Recent initiatives
    24. 7.24. International WoodFuels LLC
      1. 7.24.1. Company Overview
      2. 7.24.2. International WoodFuels LLC Sales, Revenue, Price, and Gross Margin
      3. 7.24.3. Product portfolio
      4. 7.24.4. Recent initiatives
    25. 7.25. Energex
      1. 7.25.1. Company Overview
      2. 7.25.2. Energex Sales, Revenue, Price, and Gross Margin
      3. 7.25.3. Product portfolio
      4. 7.25.4. Recent initiatives
  • CHAPTER 8. Biomass Pellets — Industry Analysis
    1. 8.1. Introduction and Taxonomy
    2. 8.2. Biomass Pellets Market – Key Trends
      1. 8.2.1. Market Drivers
      2. 8.2.2. Market Restraints
      3. 8.2.3. Market Opportunities
    3. 8.3. Value Chain Analysis
    4. 8.4. Key Mandates and Regulations
    5. 8.5. Technology Roadmap and Timeline
    6. 8.6. Biomass Pellets market – Attractiveness Analysis
      1. 8.6.1. By Source
      2. 8.6.2. By End Use
      3. 8.6.3. By Region
  • CHAPTER 9. Raw Material analysis
    1. 9.1. Biomass Pellets Key Raw Material Analysis
      1. 9.1.1. Key Raw Materials
      2. 9.1.2. Price Trend of Key Raw Materials
    2. 9.2. Key Suppliers of Raw Materials
    3. 9.3. Proportion of Manufacturing Cost Structure
      1. 9.3.1. Raw Materials
      2. 9.3.2. Labor Cost
    4. 9.4. Manufacturing Expenses Analysis of Biomass Pellets
  • CHAPTER 10. Industrial Chain, Sourcing Strategy and Downstream Buyers
    1. 10.1. Biomass Pellets Industrial Chain Analysis
    2. 10.2. Upstream Raw Materials Sourcing
      1. 10.2.1. Risk Mitigation:
      2. 10.2.2. Supplier Relationships:
      3. 10.2.3. Business Processes:
      4. 10.2.4. Securing the Product:
    3. 10.3. Raw Materials Sources of Biomass Pellets Major Manufacturers in 2016
    4. 10.4. Downstream Buyers
    5. 10.5. Distributors/Traders List
  • CHAPTER 11. Marketing Strategy Analysis, Distributors
    1. 11.1. Marketing Channel
    2. 11.2. Direct Marketing
    3. 11.3. Indirect Marketing
    4. 11.4. Marketing Channel Development Trend
    5. 11.5. Economic/Political Environmental Change
  • CHAPTER 12. Report Conclusion
  • CHAPTER 13. Research Approach & Methodology
    1. 13.1. Report Description
    2. 13.2. Research Scope
    3. 13.3. Research Methodology
      1. 13.3.1. Secondary Research
      2. 13.3.2. Primary Research
      3. 13.3.3. Models

  • List of Figures

    FIG. 1 Global Biomass Pellets Market, 2016-2026 (USD Million)
    FIG. 2 Global Biomass Pellets Market Share, by Source, 2019 & 2026 (USD Million)
    FIG. 3 Global Biomass Pellets Market share, by Source, 2019 & 2026 (Kilo Tons)
    FIG. 4 Global Agriculture Residue Biomass Pellets Market, 2016-2026 (USD Million)
    FIG. 5 Global Agriculture Residue Biomass Pellets  Market, 2016-2026 (Kilo Tons)
    FIG. 6 Global Wood Sawdust Biomass Pellets Market, 2016-2026 (USD Million)
    FIG. 7 Global Wood Sawdust Biomass Pellets  Market, 2016-2026 (Kilo Tons)
    FIG. 8 Global Others Biomass Pellets Market, 2016-2026 (USD Million)
    FIG. 9 Global Others Biomass Pellets  Market, 2016-2026 (Kilo Tons)
    FIG. 10 Global Biomass Pellets Market Share, by End Use, 2019 & 2026 (USD Million)
    FIG. 11 Global Biomass Pellets Market share, by End Use, 2019 & 2026 (Kilo Tons)
    FIG. 12 Global Power Generation Biomass Pellets Market, 2016-2026 (USD Million)
    FIG. 13 Global Power Generation Biomass Pellets  Market, 2016-2026 (Kilo Tons)
    FIG. 14 Global  Industrial Heating Biomass Pellets Market, 2016-2026 (USD Million)
    FIG. 15 Global  Industrial Heating Biomass Pellets  Market, 2016-2026 (Kilo Tons)
    FIG. 16 Global Commercial and Domestic Heating Biomass Pellets Market, 2016-2026 (USD Million)
    FIG. 17 Global Commercial and Domestic Heating Biomass Pellets  Market, 2016-2026 (Kilo Tons)
    FIG. 18 Global Others Biomass Pellets Market, 2016-2026 (USD Million)
    FIG. 19 Global Others Biomass Pellets  Market, 2016-2026 (Kilo Tons)
    FIG. 20 Global Biomass Pellets Market Share, by Region, 2019 & 2026
    FIG. 21 Global Biomass Pellets Market Share, by Region, 2019 & 2026
    FIG. 22 North America Biomass Pellets Market, 2016-2026
    FIG. 23 North America Biomass Pellets  Market, 2016-2026 (Kilo Tons)
    FIG. 24 U.S. Biomass Pellets Market, 2016-2026
    FIG. 25 U.S. Biomass Pellets  Market, 2016-2026 (Kilo Tons)
    FIG. 26 Canada Biomass Pellets Market, 2016-2026
    FIG. 27 Canada Biomass Pellets  Market, 2016-2026 (Kilo Tons)
    FIG. 28 Europe Biomass Pellets Market, 2016-2026
    FIG. 29 Europe Biomass Pellets  Market, 2016-2026 (Kilo Tons)
    FIG. 30 Germany Biomass Pellets Market, 2016-2026
    FIG. 31 Germany Biomass Pellets  Market, 2016-2026 (Kilo Tons)
    FIG. 32 France Biomass Pellets Market, 2016-2026
    FIG. 33 France Biomass Pellets  Market, 2016-2026 (Kilo Tons)
    FIG. 34 U.K. Biomass Pellets Market, 2016-2026
    FIG. 35 U.K. Biomass Pellets  Market, 2016-2026 (Kilo Tons)
    FIG. 36 Italy Biomass Pellets Market, 2016-2026
    FIG. 37 Italy Biomass Pellets  Market, 2016-2026 (Kilo Tons)
    FIG. 38 Spain Biomass Pellets Market, 2016-2026
    FIG. 39 Spain Biomass Pellets  Market, 2016-2026 (Kilo Tons)
    FIG. 40 Rest of Europe Biomass Pellets Market, 2016-2026
    FIG. 41 Rest of Europe Biomass Pellets  Market, 2016-2026 (Kilo Tons)
    FIG. 42 Asia Pacific Biomass Pellets Market, 2016-2026
    FIG. 43 Asia Pacific Biomass Pellets  Market, 2016-2026 (Kilo Tons)
    FIG. 44 China Biomass Pellets Market, 2016-2026
    FIG. 45 China Biomass Pellets  Market, 2016-2026 (Kilo Tons)
    FIG. 46 Japan Biomass Pellets Market, 2016-2026
    FIG. 47 Japan Biomass Pellets  Market, 2016-2026 (Kilo Tons)
    FIG. 48 India Biomass Pellets Market, 2016-2026
    FIG. 49 India Biomass Pellets  Market, 2016-2026 (Kilo Tons)
    FIG. 50 South  Korea Biomass Pellets Market, 2016-2026
    FIG. 51 South  Korea Biomass Pellets  Market, 2016-2026 (Kilo Tons)
    FIG. 52 South-East Asia Biomass Pellets Market, 2016-2026
    FIG. 53 South-East Asia Biomass Pellets  Market, 2016-2026 (Kilo Tons)
    FIG. 54 Rest of Asia Pacific Biomass Pellets Market, 2016-2026
    FIG. 55 Rest of Asia Pacific Biomass Pellets  Market, 2016-2026 (Kilo Tons)
    FIG. 56 Latin America Biomass Pellets Market, 2016-2026
    FIG. 57 Latin America Biomass Pellets  Market, 2016-2026 (Kilo Tons)
    FIG. 58 Brazil Biomass Pellets Market, 2016-2026
    FIG. 59 Brazil Biomass Pellets  Market, 2016-2026 (Kilo Tons)
    FIG. 60 Mexico Biomass Pellets Market, 2016-2026
    FIG. 61 Mexico Biomass Pellets  Market, 2016-2026 (Kilo Tons)
    FIG. 62 Rest of Latin America Biomass Pellets Market, 2016-2026
    FIG. 63 Rest of Latin America Biomass Pellets  Market, 2016-2026 (Kilo Tons)
    FIG. 64 The Middle-East and Africa Biomass Pellets Market, 2016-2026
    FIG. 65 The Middle-East and Africa Biomass Pellets  Market, 2016-2026 (Kilo Tons)
    FIG. 66 GCC Countries Biomass Pellets Market, 2016-2026
    FIG. 67 GCC Countries Biomass Pellets  Market, 2016-2026 (Kilo Tons)
    FIG. 68 South Africa Biomass Pellets Market, 2016-2026
    FIG. 69 South Africa Biomass Pellets  Market, 2016-2026 (Kilo Tons)
    FIG. 70 Rest of Middle-East Africa Biomass Pellets Market, 2016-2026
    FIG. 71 Rest of Middle-East Africa Biomass Pellets  Market, 2016-2026 (Kilo Tons)
    FIG. 72 Global Biomass Pellets production and revenue, 2015-2025 (USD Million) (Kilo Tons)
    FIG. 73 North America Biomass Pellets production and revenue, 2015-2025 (USD Million) (Kilo Tons)
    FIG. 74 Europe Biomass Pellets production and revenue, 2015-2025 (USD Million) (Kilo Tons)
    FIG. 75 Asia Pacific Biomass Pellets production and revenue, 2015-2025 (USD Million) (Kilo Tons)
    FIG. 76 Latin America Biomass Pellets production and revenue, 2015-2025 (USD Million) (Kilo Tons)
    FIG. 77 Middle East and Africa Biomass Pellets production and revenue, 2015-2025 (USD Million) (Kilo Tons)
    FIG. 78 Competitor Market Share – Revenue
    FIG. 79 Competitor Market Share – Volume
    FIG. 80 Westervelt Renewable Energy LLC Revenue and Growth Rate
    FIG. 81 Westervelt Renewable Energy LLC Market Share
    FIG. 82 Enviva Biomass Revenue and Growth Rate
    FIG. 83 Enviva Biomass Market Share
    FIG. 84 Drax Biomass Inc. Revenue and Growth Rate
    FIG. 85 Drax Biomass Inc. Market Share
    FIG. 86 Renetech Inc. Revenue and Growth Rate
    FIG. 87 Renetech Inc. Market Share
    FIG. 88 Enviva Partners, LP Revenue and Growth Rate
    FIG. 89 Enviva Partners, LP Market Share
    FIG. 90 German Pellets GmgH Revenue and Growth Rate
    FIG. 91 German Pellets GmgH Market Share
    FIG. 92 AS Graanul Invest Revenue and Growth Rate
    FIG. 93 AS Graanul Invest Market Share
    FIG. 94 Pinnacle Renewable Energy Inc. Revenue and Growth Rate
    FIG. 95 Pinnacle Renewable Energy Inc. Market Share
    FIG. 96 Lignetics Of Idaho Inc. Revenue and Growth Rate
    FIG. 97 Lignetics Of Idaho Inc. Market Share
    FIG. 98 Zilkha Biomass Energy, LLC Revenue and Growth Rate
    FIG. 99 Zilkha Biomass Energy, LLC Market Share
    FIG. 100 Premium Pellets Ltd. Revenue and Growth Rate
    FIG. 101 Premium Pellets Ltd. Market Share
    FIG. 102 Fram Renewable Fuels Revenue and Growth Rate
    FIG. 103 Fram Renewable Fuels Market Share
    FIG. 104 Abellon Clean Energy Ltd. Revenue and Growth Rate
    FIG. 105 Abellon Clean Energy Ltd. Market Share
    FIG. 106 Subham Industries Revenue and Growth Rate
    FIG. 107 Subham Industries Market Share
    FIG. 108 Nishant Bioenergy Private Energy Revenue and Growth Rate
    FIG. 109 Nishant Bioenergy Private Energy Market Share
    FIG. 110 MVM Bio Green Energy Eco Equipment Revenue and Growth Rate
    FIG. 111 MVM Bio Green Energy Eco Equipment Market Share
    FIG. 112 Ecostan India Private Ltd. Revenue and Growth Rate
    FIG. 113 Ecostan India Private Ltd. Market Share
    FIG. 114 JP Green Fuels Revenue and Growth Rate
    FIG. 115 JP Green Fuels Market Share
    FIG. 116 Kushal Timber Private Ltd. Revenue and Growth Rate
    FIG. 117 Kushal Timber Private Ltd. Market Share
    FIG. 118 Forest Energy Corporation Revenue and Growth Rate
    FIG. 119 Forest Energy Corporation Market Share
    FIG. 120 Helius Energy Ltd. Revenue and Growth Rate
    FIG. 121 Helius Energy Ltd. Market Share
    FIG. 122 New England Wood Pellet. Revenue and Growth Rate
    FIG. 123 New England Wood Pellet. Market Share
    FIG. 124 Viridis Energy Inc Revenue and Growth Rate
    FIG. 125 Viridis Energy Inc Market Share
    FIG. 126 International WoodFuels LLC Revenue and Growth Rate
    FIG. 127 International WoodFuels LLC Market Share
    FIG. 128 Energex Revenue and Growth Rate
    FIG. 129 Energex Market Share
    FIG. 130 Market Dynamics
    FIG. 131 Global Biomass Pellets – Value Chain Analysis
    FIG. 132 Key Mandates and Regulations
    FIG. 133 Technology Roadmap and Timeline
    FIG. 134 Market Attractiveness Analysis – By Source
    FIG. 135 Market Attractiveness Analysis – By End Use
    FIG. 136 Market Attractiveness Analysis – By Region
    FIG. 137 Manufacturing Cost Structure of Biomass Pellets
    FIG. 138 Biomass Pellets Industrial Chain Analysis
    FIG. 139 Market Channel
    FIG. 140 Marketing Channel Development Trend
    FIG. 141 Growth in World Gross Product


    List of Tables

    TABLE 1 Global Biomass Pellets market, 2019 & 2026 (USD Million)
    TABLE 2 Global Biomass Pellets Market, by Source, 2016-2026 (USD Million)
    TABLE 3 Global Biomass Pellets Market, by Source, 2016-2026 (Kilo Tons)
    TABLE 4 Global Biomass Pellets Market, by End-Use, 2016-2026 (USD Million)
    TABLE 5 Global Biomass Pellets Market, by End-Use, 2016-2026 (Kilo Tons)
    TABLE 6 Global Biomass Pellets market, by region, 2016-2026 (USD Million)
    TABLE 7 Global Biomass Pellets market, by region, 2016-2026 (Kilo Tons)
    TABLE 8 North America Biomass Pellets Market, by Source, 2016-2026 (USD Million)
    TABLE 9 North America Biomass Pellets Market, by Source, 2016-2026 (Kilo Tons)
    TABLE 10 North America Biomass Pellets Market, by End-Use, 2016-2026 (USD Million)
    TABLE 11 North America Biomass Pellets Market, by End-Use, 2016-2026 (Kilo Tons)
    TABLE 12 Europe Biomass Pellets Market, by Source, 2016-2026 (USD Million)
    TABLE 13 Europe Biomass Pellets Market, by Source, 2016-2026 (Kilo Tons)
    TABLE 14 Europe Biomass Pellets Market, by End-Use, 2016-2026 (USD Million)
    TABLE 15 Europe Biomass Pellets Market, by End-Use, 2016-2026 (Kilo Tons)
    TABLE 16 Asia Pacific Biomass Pellets Market, by Source, 2016-2026 (USD Million)
    TABLE 17 Asia Pacific Biomass Pellets Market, by Source, 2016-2026 (Kilo Tons)
    TABLE 18 Asia Pacific Biomass Pellets Market, by End-Use, 2016-2026 (USD Million)
    TABLE 19 Asia Pacific Biomass Pellets Market, by End-Use, 2016-2026 (Kilo Tons)
    TABLE 20 Latin America Biomass Pellets Market, by Source, 2016-2026 (USD Million)
    TABLE 21 Latin America Biomass Pellets Market, by Source, 2016-2026 (Kilo Tons)
    TABLE 22 Latin America Biomass Pellets Market, by End-Use, 2016-2026 (USD Million)
    TABLE 23 Latin America Biomass Pellets Market, by End-Use, 2016-2026 (Kilo Tons)
    TABLE 24 The Middle-East and Africa Biomass Pellets Market, by Source, 2016-2026 (USD Million)
    TABLE 25 The Middle-East and Africa Biomass Pellets Market, by Source, 2016-2026 (Kilo Tons)
    TABLE 26 The Middle-East and Africa Biomass Pellets Market, by End-Use, 2016-2026 (USD Million)
    TABLE 27 The Middle-East and Africa Biomass Pellets Market, by End-Use, 2016-2026 (Kilo Tons)
    TABLE 28 North America Biomass Pellets Production, Consumption, Export, Import, 2016-2019
    TABLE 29 Europe Biomass Pellets Production, Consumption, Export, Import, 2016-2019
    TABLE 30 Asia Pacific Biomass Pellets Production, Consumption, Export, Import, 2016-2019
    TABLE 31 Latin America Biomass Pellets Production, Consumption, Export, Import, 2016-2019
    TABLE 32 Middle East & Africa Biomass Pellets Production, Consumption, Export, Import, 2016-2019
    TABLE 33 Global Biomass Pellets Market - Company Revenue Analysis 2016-2019 (USD Million)
    TABLE 34 Global Biomass Pellets Market - Company Revenue Share Analysis 2016-2019(%)
    TABLE 35 Global Biomass Pellets Market - Company Volume Analysis 2016-2019 (Kilo Tons)
    TABLE 36 Global Biomass Pellets Market - Company Volume Share Analysis 2016-2019(%)
    TABLE 37 Acquisitions and Mergers
    TABLE 38 New Product/Service Launch
    TABLE 39 Research & Development Activities
    TABLE 40 Market Drivers
    TABLE 41 Market Restraints
    TABLE 42 Market Opportunities
    TABLE 43 Production Base and Market Concentration Rate of Raw Material
    TABLE 44 Key Suppliers of Raw Materials
    TABLE 45 Raw Materials Sources of Biomass Pellets Major Manufacturers in 2016
    TABLE 46 Major Buyers of Biomass Pellets
    TABLE 47 Distributors/Traders of Biomass Pellets by Region

  • Industry Major Market Players

    • Westervelt Renewable Energy LLC
    •  Enviva Biomass
    •  Drax Biomass Inc.
    •  Renetech Inc.
    •  Enviva Partners
    •  LP
    •  German Pellets GmgH
    •  AS Graanul Invest