![]()
Search Market Research Report
Biodegradable Polymer Market Size, Share Global Analysis Report, 2020–2026

Biodegradable Polymer Market By Type (Polymers with Carbon Backbones, Polymers with Hydrolyzable Backbones, Natural Polymers) and By Application (Packaging, Agricultural, Medical, and Others): Global Industry Outlook, Market Size, Business Intelligence, Consumer Preferences, Statistical Surveys, Comprehensive Analysis, Historical Developments, Current Trends, and Forecast 2020–2026
Industry Insights
The Biodegradable Polymer market report analyzes and notifies the industry statistics at the global as well as regional and country levels in order to acquire a thorough perspective of the entire Biodegradable Polymer market. The historical and past insights are provided for FY 2016 to FY 2019 whereas projected trends are delivered for FY 2020 to FY 2026. The quantitative and numerical data is represented in terms of both volume (Kilo Tons) and value (USD Million) from FY 2016 – 2026.
This specialized and expertise-oriented industry research report scrutinizes the technical and commercial business outlook of the Biodegradable Polymer industry. The report analyzes and declares the historical and current trends analysis of the Biodegradable Polymer industry and subsequently recommends the projected trends anticipated to be observed in the Biodegradable Polymer market during the upcoming years.
 Key Insights from Primary Research
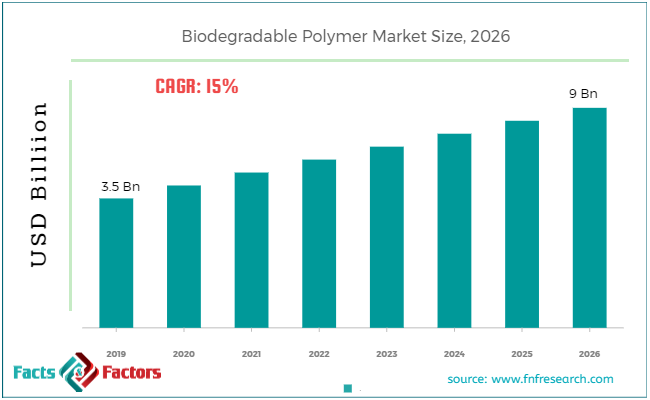
- As per the views shared by our primary respondents, the Biodegradable Polymer market is expected to grow at a CAGR of around 15%.
- Through the primary analysis. The market for Biodegradable Polymer was valued at around USD 3.5 Billion in 2019.
- The category of “Polymers with hydrolyzable backbone”, on the basis of type segmentation was among the top category that generated the maximum revenue share.
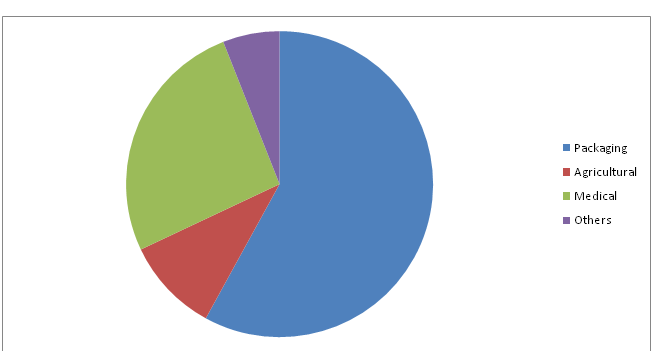
- The category of “Packaging”, on the basis of application segmentation, was considered to be the leading revenue generator in 2019.
Key Recommendations from Analysts
- As per our analysts, the biodegradable polymer market is growing steadily as it is not much popular among the masses.
- Several countries of Europe are switching to biodegradable product packaging owing to the consequences in the usage of plastic packaging and other products that are made up of harmful chemicals.
- The region of Asia Pacific is adopting the usage of biodegradable polymer packaging due to the growing economies and increasing demand of consumers in various sectors like the food industry, pharmaceutical industry, e-commerce, and many more.
- As the market is growing at a CAGR of around 15%, the biodegradable polymer market provides abundant chances for all the investors that are involved across the entire value chain.
- As per our analysts, there are plentiful chances for the use of biodegradable polymer in the field of “agriculture” and can prove to be a leading investment pocket that can provide multiple growth opportunities and revenue generation in the coming years.
Market Attractiveness – By End-User
The quantitative data is further underlined and reinforced by comprehensive qualitative data which comprises various across-the-board market dynamics. The rationales which directly or indirectly impact the Biodegradable Polymer industry are exemplified through parameters such as growth drivers, restraints, challenges, and opportunities among other impacting factors.
Throughout our research report, we have encompassed all the proven models and tools of industry analysis and extensively illustrated all the key business strategies and business models adopted in the Biodegradable Polymer industry. The report provides an all-inclusive and detailed competitive landscape prevalent in the Biodegradable Polymer market.
The report utilizes established industry analysis tools and models such as Porter’s Five Forces framework to analyze and recognize critical business strategies adopted by various stakeholders involved in the entire value chain of the Biodegradable Polymer industry. The Biodegradable Polymer market report additionally employs SWOT analysis and PESTLE analysis models for further in-depth analysis.
The report study further includes an in-depth analysis of industry players' market shares and provides an overview of leading players' market position in the Biodegradable Polymer sector. Key strategic developments in the Biodegradable Polymer market competitive landscape such as acquisitions & mergers, inaugurations of different products and services, partnerships & joint ventures, MoU agreements, VC & funding activities, R&D activities, and geographic expansion among other noteworthy activities by key players of the Biodegradable Polymer market are appropriately highlighted in the report.
Polymers are those compounds that consist of an extended link of monomers and are formed through chemical reactions with high molar mass. Biodegradable polymers are non-toxic and eco-friendly products that generally break down into simple, natural, and reusable products. These biodegradable polymers are in huge demand due to the rising concern for environmental conservation and the demand for eco-friendly products that cause less harm to the environment and other living things. Governments of many countries are encouraging their citizens to switch to a sustainable lifestyle and use biodegradable products. These biodegradable polymers are largely used in the field of packaging as there is a never-ending demand from consumers for various products that are generally packed, stored, and transported from one location to another.
The Biodegradable Polymer market research report delivers an acute valuation and taxonomy of the Biodegradable Polymer industry by practically splitting the market on the basis of different types, applications, and regions. Through the analysis of the historical and projected trends, all the segments and sub-segments were evaluated through the bottom-up approach, and different market sizes have been projected for FY 2020 to FY 2026. The regional segmentation of the Biodegradable Polymer industry includes the complete classification of all the major continents including North America, Latin America, Europe, Asia Pacific, and the Middle East & Africa. Further, country-wise data for the Biodegradable Polymer industry is provided for the leading economies of the world.
The Biodegradable Polymer market is segmented based on Type and Application. On the basis of type segmentation, the market is classified into Polymers with Carbon Backbones, Polymers with Hydrolyzable Backbones, and Natural Polymers. In terms of Application segmentation, the market is bifurcated into Packaging, Agricultural, Medical, and Others.
Report Scope
Report Attribute |
Details |
Market Size in 2019 |
USD 3.5 Billion |
Projected Market Size in 2026 |
USD 9 Billion |
CAGR Growth Rate |
15% CAGR |
Base Year |
2019 |
Forecast Years |
2020-2026 |
Key Market Players |
Cortec group, Mitsui Chemicals, BASF, BIOTEC GmbH& Co, Cereplast, MetabolixInc, FP International, Others , and others. |
Key Segment |
By Type, Application, and Region |
Major Regions Covered |
North America, Europe, Asia Pacific, Latin America, and the Middle East &, Africa |
Purchase Options |
Request customized purchase options to meet your research needs. Explore purchase options |
Some of the essential players operating in the Biodegradable Polymer market, but not restricted include:
- Cortec Group
- Mitsui Chemicals
- BASF
- BIOTEC GmbH& Co
- Cereplast
- MetabolixInc
- FP International
The taxonomy of the Biodegradable Polymer industry by its scope and segmentation is as follows:
By Type Segmentation Analysis (Customizable)
- Polymers with Carbon Backbones
- Polymers with Hydrolyzable Backbones
- Natural Polymers
By Application Segmentation Analysis (Customizable)
- Packaging
- Agricultural
- Medical
- Others
Regional Segmentation Analysis (Customizable)
- North America
- The U.S.
- Canada
- Europe
- Germany
- The UK
- France
- Spain
- Italy
- Rest of Europe
- Asia Pacific
- China
- Japan
- India
- South Korea
- Southeast Asia
- Rest of Asia Pacific
- Latin America
- Brazil
- Mexico
- Rest of Latin America
- Middle East & Africa
- GCC
- South Africa
- Rest of Middle East & Africa
Table of Content
Industry Major Market Players
- Cortec group
- Mitsui Chemicals
- BASF
- BIOTEC GmbH& Co
- Cereplast
- MetabolixInc
- FP International


Copyright © 2025 - 2026, All Rights Reserved, Facts and Factors