Search Market Research Report

Discover Our Latest Reports
Discover Our Featured Reports
Discover Top Selling Reports

Bio-Analytical Services Market Size, Share Global Analysis Report, 2020–2026

report img

Bio-Analytical Services Market By Type (Hyphenated Techniques, Chromatographic Methods, Nuclear Magnetic Resonance, Ligand Binding Assays, and Mass Spectrometry) and By Application (Small Molecule Analysis and Large Molecule Analysis): Global Industry Outlook, Market Size, Business Intelligence, Consumer Preferences, Statistical Surveys, Comprehensive Analysis, Historical Developments, Current Trends, and Forecast 2020–2026

Industry Insights

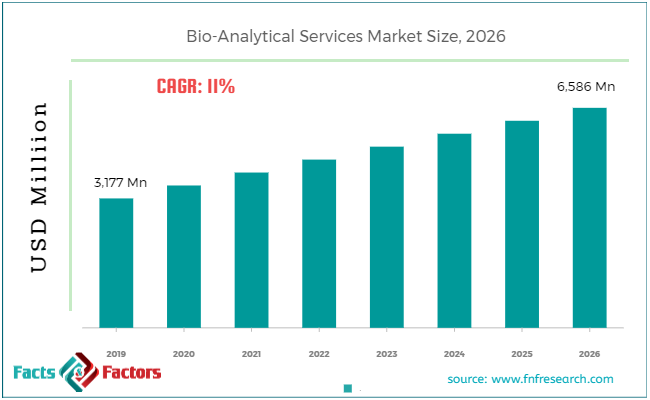
According to the report published by Facts & Factors, the global bio-analytical services market size was worth around USD 3177 million in 2019 and is predicted to grow around USD 6586 million by 2026 with a compound annual growth rate (CAGR) of roughly 11% between 2020 and 2026. The report analyzes the global Bio-Analytical Services market drivers, restraints/challenges, and the effect they have on the demands during the projection period. In addition, the report explores emerging opportunities in the Bio-Analytical Services market.

The Bio-Analytical Services market report analyzes and notifies the industry statistics at the global as well as regional and country levels in order to acquire a thorough perspective of the entire-Analytical Services market. The historical and past insights are provided for FY 2016 to FY 2019 whereas projected trends are delivered for FY 2020 to FY 2026. The quantitative and numerical data is represented in terms of value (USD Million) from FY 2016 – 2026.

Bio-Analytical Services Market Size

To know more about this report | Request Free Sample Copy

This specialized and expertise-oriented industry research report scrutinizes the technical and commercial business outlook of the Bio-Analytical Services industry. The report analyzes and declares the historical and current trends analysis of the Bio-Analytical Services industry and subsequently recommends the projected trends anticipated to be observed in the Bio-Analytical Services market during the upcoming years.

logoKey Insights from Primary Research

  • As per our primary respondents, the Analytical Services market is set to grow annually at a rate of around 12%.
  • It was established through primary research that the Bio-Analytical Services market was valued at around USD 3177 million in 2019.
  • After secondary research, we performed face-to-face interviews to validate our data. The insights interviewees declared that Small Molecule Analysis is the most used type for the global Bio-Analytical Services market.
  • On the basis of the type, Small Molecule analysis dominated the global Bio-Analytical Services market in 2019. It accounted for around 75% share of the total market in 2019.
  • The Chromatographic Methods, on the basis of type segmentation, was the leading revenue-generating category accounting for around 35% share, in 2019.

logoKey Recommendations from Analysts

  • Based on the exhaustive secondary research done by our team, the small molecule analysis type is anticipated to become the most demanding type in the upcoming years, owing to the growing demand for Bio-Analytical Services from the pharmaceutical industry for various end-use applications.
  • As per our analysts, North America recorded the highest market share of more than 32% by 2026, and the market is expected to bolster in this region, resulting in creating lucrative opportunities for new players.
  • Growing at a CAGR of around 12%, the Bio-Analytical Services market provides numerous opportunities for all of the involved stakeholders across the entire value chain.
  • Our analysts have identified small molecules and Chromatographic Methodscategories as the leading investment pockets for the Bio-Analytical Services market in terms of type and application segmentation respectively.
  • Our analysts recommend the emerging players focus on small molecules owing to the substantial growth of the Bio-Analytical Services industry, especially in APAC and Middle-eastern regions and the increased adaptation of chromatographic methods in the pharmaceutical industry.

logoMarket Attractiveness – By Type

Bio-Analytical Services Market

To know more about this report | Request Free Sample Copy

The quantitative data is further underlined and reinforced by comprehensive qualitative data which comprises various across-the-board market dynamics. The rationales which directly or indirectly impact the Bio-Analytical Services industry are exemplified through parameters such as growth drivers, restraints, challenges, and opportunities among other impacting factors.

Throughout our research report, we have encompassed all the proven models and tools of industry analysis and extensively illustrated all the key business strategies and business models adopted in the Bio-Analytical Services industry. The report provides an all-inclusive and detailed competitive landscape prevalent in the Bio-Analytical Services market.

The report utilizes established industry analysis tools and models such as Porter’s Five Forces framework to analyze and recognize critical business strategies adopted by various stakeholders involved in the entire value chain of the Bio-Analytical Services industry. The Bio-Analytical Services market report additionally employs SWOT analysis and PESTLE analysis models for further in-depth analysis.

The report study further includes an in-depth analysis of industry players' market shares and provides an overview of leading players' market position in the Bio-Analytical Services sector. Key strategic developments in the Bio-Analytical Services market competitive landscape such as acquisitions & mergers, inaugurations of different products and services, partnerships & joint ventures, MoU agreements, VC & funding activities, R&D activities, and geographic expansion among other noteworthy activities by key players of the Bio-Analytical Services market are appropriately highlighted in the report.

Bioanalysis is a segment of analytical chemistry dealing with the measurement of metabolites, concentration of biological molecules, proteins, macromolecules, and DNA. In recent times there is a surge in demand for bioanalytical services in the pharmaceutical industry owing to the difficulty in conducting these services in-house.

Further, the rising awareness related to disease across the world is anticipated to drive this market. Additionally, the huge investments of the government in the field of general health wellness during the forecast period are anticipated to fuel market growth. Moreover, the key players working in the pharmaceutical industry are heavily investing in the R&D of new drugs which will push the market growth even further.

logoReport Scope

Report Attribute

Details

Market Size in 2019

USD 3,177 Million

Projected Market Size in 2026

USD 6,586 Million

CAGR Growth Rate

11% CAGR

Base Year

2019

Forecast Years

2020-2026

Key Market Players

Covance Inc, ICON plc, Pharmaceutical Product Development LLC, Eurofins Scientific, KCAS, Charles River Laboratories International Inc, Intertek Group plc, Euro Diagnostica AB, InVentiv Health Clinical, Cambridge Biomedical, Caprion, BioAgilytix Labs, IMET, Nutrasource Diagnostics Inc, Q 2 Solutions, Absorption Systems LP, Ricerca, SGS United Kingdom Ltd, Dynakin, LKF, Particle Sciences, Celerion, Paraxel International Corporation, Worldwide Clinical Trials, Bioanalytical Laboratory Services, LGC, Sussex Research Laboratories Inc, Wuxi AppTec, SmithersAvanza, and others.

Key Segment

By Type, Application, and Region

Major Regions Covered

North America, Europe, Asia Pacific, Latin America, and the Middle East &, Africa

Purchase Options

Request customized purchase options to meet your research needs. Explore purchase options

logoRegional Overview:

The Bio-Analytical Services market research report delivers an acute valuation and taxonomy of the Bio-Analytical Services industry by practically splitting the market on the basis of different types, applications, and regions. Through the analysis of the historical and projected trends, all the segments and sub-segments were evaluated through the bottom-up approach, and different market sizes have been projected for FY 2020 to FY 2026.

The regional segmentation of the Bio-Analytical Services industry includes the complete classification of all the major continents including North America, Latin America, Europe, Asia Pacific, and the Middle East & Africa. Further, country-wise data for the Bio-Analytical Services industry is provided for the leading economies of the world.

The Bio-Analytical Services market is segmented based on Type and Application.  On the basis of type segmentation, the market is classified into Hyphenated Techniques, Chromatographic Methods, Nuclear Magnetic Resonance, Ligand Binding Assays, and Mass Spectrometry. In terms of Application segmentation, the market is bifurcated into Small Molecule Analysis and Large Molecule Analysis.

logoSome of the essential players operating in the Bio-Analytical Services market, but not restricted to include

  • Covance Inc
  •  ICON plc
  •  Pharmaceutical Product Development LLC
  •  Eurofins Scientific
  •  KCAS
  •  Charles River Laboratories International Inc
  •  Intertek Group plc
  •  Euro Diagnostica AB
  •  InVentiv Health Clinical
  •  Cambridge Biomedical
  •  Caption
  •  BioAgilytix Labs
  •  IMET
  •  Nutrasource Diagnostics Inc
  •  Q 2 Solutions
  •  Absorption Systems LP
  •  Ricerca
  •  SGS United Kingdom Ltd
  •  Dynakin
  •  LKF
  •  Particle Sciences
  •  Celerion
  •  Paraxel International Corporation
  •  Worldwide Clinical Trials
  • Bioanalytical Laboratory Services
  • LGC
  • Sussex Research Laboratories Inc
  • Wuxi AppTec
  • SmithersAvanza

The taxonomy of the Bio-Analytical Services industry by its scope and segmentation is as follows:

logo By Type Segmentation Analysis

  • Hyphenated Techniques
  • Chromatographic Methods
  • Nuclear Magnetic Resonance
  • Ligand Binding Assays
  • Mass Spectrometry

logo By Application Segmentation Analysis

  • Small Molecule Analysis
  • Large Molecule Analysis

logoGlobal Bio-Analytical Services Market: Regional Segmentation Analysis

  • North America
    • The U.S.
    • Canada
  • Europe
    • Germany
    • The UK
    • France
    • Spain
    • Italy
    • Rest of Europe
  • Asia Pacific
    • China
    • Japan
    • India
    • South Korea
    • Southeast Asia
    • Rest of Asia Pacific
  • Latin America
    • Brazil
    • Mexico
    • Rest of Latin America
  • Middle East & Africa
    • GCC
    • South Africa
    • Rest of the Middle East & Africa

Table of Content

  1. CHAPTER 1. Executive Summary
  2. CHAPTER 2. Bio-Analytical Services market – Type Analysis
    1. 2.1. Global Bio-Analytical Services Market – Type Overview
    2. 2.2. Global Bio-Analytical Services Market Share, by Type, 2019 & 2026 (USD Million)
    3. 2.3. Hyphenated Techniques
      1. 2.3.1. Global Hyphenated Techniques Bio-Analytical Services Market, 2016-2026 (USD Million)
    4. 2.4. Chromatographic Methods
      1. 2.4.1. Global Chromatographic Methods Bio-Analytical Services Market, 2016-2026 (USD Million)
    5. 2.5. Nuclear Magnetic Resonance
      1. 2.5.1. Global Nuclear Magnetic Resonance Bio-Analytical Services Market, 2016-2026 (USD Million)
    6. 2.6. Ligand Binding Assays
      1. 2.6.1. Global Ligand Binding Assays Bio-Analytical Services Market, 2016-2026 (USD Million)
    7. 2.7. Mass Spectrometry
      1. 2.7.1. Global Mass Spectrometry Bio-Analytical Services Market, 2016-2026 (USD Million)
  3. CHAPTER 3. Bio-Analytical Services market – End Users/ Application Analysis
    1. 3.1. Global Bio-Analytical Services Market – End Users/ Application Overview
    2. 3.2. Global Bio-Analytical Services Market Share, by End Users/ Application, 2019 & 2026 (USD Million)
    3. 3.3. Small Molecule Analysis
      1. 3.3.1. Global Small Molecule Analysis Bio-Analytical Services Market, 2016-2026 (USD Million)
    4. 3.4. Large Molecule Analysis
      1. 3.4.1. Global Large Molecule Analysis Bio-Analytical Services Market, 2016-2026 (USD Million)
  4. CHAPTER 4. Bio-Analytical Services market – Regional Analysis
    1. 4.1. Global Bio-Analytical Services Market Regional Overview
    2. 4.2. Global Bio-Analytical Services Market Share, by Region, 2019 & 2026 (Value)
    3. 4.3. North America
      1. 4.3.1. North America Bio-Analytical Services Market size and forecast, 2016-2026
      2. 4.3.2. North America Bio-Analytical Services Market, by Country, 2019 & 2026 (USD Million)
      3. 4.3.3. North America Bio-Analytical Services Market, by Type, 2016-2026
        1. 4.3.3.1. North America Bio-Analytical Services Market, by Type, 2016-2026 (USD Million)
      4. 4.3.4. North America Bio-Analytical Services Market, by End Users/ Application, 2016-2026
        1. 4.3.4.1. North America Bio-Analytical Services Market, by End Users/ Application, 2016-2026 (USD Million)
      5. 4.3.5. U.S.
        1. 4.3.5.1. U.S. Market size and forecast, 2016-2026 (USD Million)
      6. 4.3.6. Canada
        1. 4.3.6.1. Canada Market size and forecast, 2016-2026 (USD Million)
    4. 4.4. Europe
      1. 4.4.1. Europe Bio-Analytical Services Market size and forecast, 2016-2026
      2. 4.4.2. Europe Bio-Analytical Services Market, by Country, 2019 & 2026 (USD Million)
      3. 4.4.3. Europe Bio-Analytical Services Market, by Type, 2016-2026
        1. 4.4.3.1. Europe Bio-Analytical Services Market, by Type, 2016-2026 (USD Million)
      4. 4.4.4. Europe Bio-Analytical Services Market, by End Users/ Application, 2016-2026
        1. 4.4.4.1. Europe Bio-Analytical Services Market, by End Users/ Application, 2016-2026 (USD Million)
      5. 4.4.5. Germany
        1. 4.4.5.1. Germany Market size and forecast, 2016-2026 (USD Million)
      6. 4.4.6. France
        1. 4.4.6.1. France Market size and forecast, 2016-2026 (USD Million)
      7. 4.4.7. U.K.
        1. 4.4.7.1. U.K. Market size and forecast, 2016-2026 (USD Million)
      8. 4.4.8. Italy
        1. 4.4.8.1. Italy Market size and forecast, 2016-2026 (USD Million)
      9. 4.4.9. Spain
        1. 4.4.9.1. Spain Market size and forecast, 2016-2026 (USD Million)
      10. 4.4.10. Rest of Europe
        1. 4.4.10.1. Rest of Europe Market size and forecast, 2016-2026 (USD Million)
    5. 4.5. Asia Pacific
      1. 4.5.1. Asia Pacific Bio-Analytical Services Market size and forecast, 2016-2026
      2. 4.5.2. Asia Pacific Bio-Analytical Services Market, by Country, 2019 & 2026 (USD Million)
      3. 4.5.3. Asia Pacific Bio-Analytical Services Market, by Type, 2016-2026
        1. 4.5.3.1. Asia Pacific Bio-Analytical Services Market, by Type, 2016-2026 (USD Million)
      4. 4.5.4. Asia Pacific Bio-Analytical Services Market, by End Users/ Application, 2016-2026
        1. 4.5.4.1. Asia Pacific Bio-Analytical Services Market, by End Users/ Application, 2016-2026 (USD Million)
      5. 4.5.5. China
        1. 4.5.5.1. China Market size and forecast, 2016-2026 (USD Million)
      6. 4.5.6. Japan
        1. 4.5.6.1. Japan Market size and forecast, 2016-2026 (USD Million)
      7. 4.5.7. India
        1. 4.5.7.1. India Market size and forecast, 2016-2026 (USD Million)
      8. 4.5.8. South Korea
        1. 4.5.8.1. South Korea Market size and forecast, 2016-2026 (USD Million)
      9. 4.5.9. South-East Asia
        1. 4.5.9.1. South-East Asia Market size and forecast, 2016-2026 (USD Million)
      10. 4.5.10. Rest of Asia Pacific
        1. 4.5.10.1. Rest of Asia Pacific Market size and forecast, 2016-2026 (USD Million)
    6. 4.6. Latin America
      1. 4.6.1. Latin America Bio-Analytical Services Market size and forecast, 2016-2026
      2. 4.6.2. Latin America Bio-Analytical Services Market, by Country, 2019 & 2026 (USD Million)
      3. 4.6.3. Latin America Bio-Analytical Services Market, by Type, 2016-2026
        1. 4.6.3.1. Latin America Bio-Analytical Services Market, by Type, 2016-2026 (USD Million)
      4. 4.6.4. Latin America Bio-Analytical Services Market, by End Users/ Application, 2016-2026
        1. 4.6.4.1. Latin America Bio-Analytical Services Market, by End Users/ Application, 2016-2026 (USD Million)
      5. 4.6.5. Brazil
        1. 4.6.5.1. Brazil Market size and forecast, 2016-2026 (USD Million)
      6. 4.6.6. Mexico
        1. 4.6.6.1. Mexico Market size and forecast, 2016-2026 (USD Million)
      7. 4.6.7. Rest of Latin America
        1. 4.6.7.1. Rest of Latin America Market size and forecast, 2016-2026 (USD Million)
    7. 4.7. The Middle-East and Africa
      1. 4.7.1. The Middle-East and Africa Bio-Analytical Services Market size and forecast, 2016-2026
      2. 4.7.2. The Middle-East and Africa Bio-Analytical Services Market, by Country, 2019 & 2026 (USD Million)
      3. 4.7.3. The Middle-East and Africa Bio-Analytical Services Market, by Type, 2016-2026
        1. 4.7.3.1. The Middle-East and Africa Bio-Analytical Services Market, by Type, 2016-2026 (USD Million)
      4. 4.7.4. The Middle-East and Africa Bio-Analytical Services Market, by End Users/ Application, 2016-2026
        1. 4.7.4.1. The Middle-East and Africa Bio-Analytical Services Market, by End Users/ Application, 2016-2026 (USD Million)
      5. 4.7.5. GCC Countries
        1. 4.7.5.1. GCC Countries Market size and forecast, 2016-2026 (USD Million)
      6. 4.7.6. South Africa
        1. 4.7.6.1. South Africa Market size and forecast, 2016-2026 (USD Million)
      7. 4.7.7. Rest of Middle-East Africa
        1. 4.7.7.1. Rest of Middle-East Africa Market size and forecast, 2016-2026 (USD Million)
  5. CHAPTER 5. Bio-Analytical Services market – Competitive Landscape
    1. 5.1. Competitor Market Share – Revenue
    2. 5.2. Market Concentration Rate Analysis, Top 3 and Top 5 Players
    3. 5.3. Strategic Development
      1. 5.3.1. Acquisitions and Mergers
      2. 5.3.2. New Products
      3. 5.3.3. Research & Development Activities
  6. CHAPTER 6. Company Profiles
    1. 6.1. Covance Inc
      1. 6.1.1. Company Overview
      2. 6.1.2. Covance Inc Revenue and Gross Margin
      3. 6.1.3. Product portfolio
      4. 6.1.4. Recent initiatives
    2. 6.2. ICON plc
      1. 6.2.1. Company Overview
      2. 6.2.2. ICON plc Revenue and Gross Margin
      3. 6.2.3. Product portfolio
      4. 6.2.4. Recent initiatives
    3. 6.3. Pharmaceutical Product Development LLC
      1. 6.3.1. Company Overview
      2. 6.3.2. Pharmaceutical Product Development LLC Revenue and Gross Margin
      3. 6.3.3. Product portfolio
      4. 6.3.4. Recent initiatives
    4. 6.4. Eurofins Scientific
      1. 6.4.1. Company Overview
      2. 6.4.2. Eurofins Scientific Revenue and Gross Margin
      3. 6.4.3. Product portfolio
      4. 6.4.4. Recent initiatives
    5. 6.5. KCAS
      1. 6.5.1. Company Overview
      2. 6.5.2. KCAS Revenue and Gross Margin
      3. 6.5.3. Product portfolio
      4. 6.5.4. Recent initiatives
    6. 6.6. Charles River Laboratories International Inc
      1. 6.6.1. Company Overview
      2. 6.6.2. Charles River Laboratories International Inc Revenue and Gross Margin
      3. 6.6.3. Product portfolio
      4. 6.6.4. Recent initiatives
    7. 6.7. Intertek Group plc
      1. 6.7.1. Company Overview
      2. 6.7.2. Intertek Group plc Revenue and Gross Margin
      3. 6.7.3. Product portfolio
      4. 6.7.4. Recent initiatives
    8. 6.8. Euro Diagnostica AB
      1. 6.8.1. Company Overview
      2. 6.8.2. Euro Diagnostica AB Revenue and Gross Margin
      3. 6.8.3. Product portfolio
      4. 6.8.4. Recent initiatives
    9. 6.9. InVentiv Health Clinical
      1. 6.9.1. Company Overview
      2. 6.9.2. InVentiv Health Clinical Revenue and Gross Margin
      3. 6.9.3. Product portfolio
      4. 6.9.4. Recent initiatives
    10. 6.10. Cambridge Biomedical
      1. 6.10.1. Company Overview
      2. 6.10.2. Cambridge Biomedical Revenue and Gross Margin
      3. 6.10.3. Product portfolio
      4. 6.10.4. Recent initiatives
    11. 6.11. Caprion
      1. 6.11.1. Company Overview
      2. 6.11.2. Caprion Revenue and Gross Margin
      3. 6.11.3. Product portfolio
      4. 6.11.4. Recent initiatives
    12. 6.12. BioAgilytix Labs
      1. 6.12.1. Company Overview
      2. 6.12.2. BioAgilytix Labs Revenue and Gross Margin
      3. 6.12.3. Product portfolio
      4. 6.12.4. Recent initiatives
    13. 6.13. IMET
      1. 6.13.1. Company Overview
      2. 6.13.2. IMET Revenue and Gross Margin
      3. 6.13.3. Product portfolio
      4. 6.13.4. Recent initiatives
    14. 6.14. Nutrasource Diagnostics Inc
      1. 6.14.1. Company Overview
      2. 6.14.2. Nutrasource Diagnostics Inc Revenue and Gross Margin
      3. 6.14.3. Product portfolio
      4. 6.14.4. Recent initiatives
    15. 6.15. Q 2 Solutions
      1. 6.15.1. Company Overview
      2. 6.15.2. Q 2 Solutions Revenue and Gross Margin
      3. 6.15.3. Product portfolio
      4. 6.15.4. Recent initiatives
    16. 6.16. Absorption Systems LP
      1. 6.16.1. Company Overview
      2. 6.16.2. Absorption Systems LP Revenue and Gross Margin
      3. 6.16.3. Product portfolio
      4. 6.16.4. Recent initiatives
    17. 6.17. Ricerca
      1. 6.17.1. Company Overview
      2. 6.17.2. Ricerca Revenue and Gross Margin
      3. 6.17.3. Product portfolio
      4. 6.17.4. Recent initiatives
    18. 6.18. SGS United Kingdom Ltd
      1. 6.18.1. Company Overview
      2. 6.18.2. SGS United Kingdom Ltd Revenue and Gross Margin
      3. 6.18.3. Product portfolio
      4. 6.18.4. Recent initiatives
    19. 6.19. Dynakin
      1. 6.19.1. Company Overview
      2. 6.19.2. Dynakin Revenue and Gross Margin
      3. 6.19.3. Product portfolio
      4. 6.19.4. Recent initiatives
    20. 6.20. LKF
      1. 6.20.1. Company Overview
      2. 6.20.2. LKF Revenue and Gross Margin
      3. 6.20.3. Product portfolio
      4. 6.20.4. Recent initiatives
    21. 6.21. Particle Sciences
      1. 6.21.1. Company Overview
      2. 6.21.2. Particle Sciences Revenue and Gross Margin
      3. 6.21.3. Product portfolio
      4. 6.21.4. Recent initiatives
    22. 6.22. Celerion
      1. 6.22.1. Company Overview
      2. 6.22.2. Celerion Revenue and Gross Margin
      3. 6.22.3. Product portfolio
      4. 6.22.4. Recent initiatives
    23. 6.23. Paraxel International Corporation
      1. 6.23.1. Company Overview
      2. 6.23.2. Paraxel International Corporation Revenue and Gross Margin
      3. 6.23.3. Product portfolio
      4. 6.23.4. Recent initiatives
    24. 6.24. Worldwide Clinical Trials
      1. 6.24.1. Company Overview
      2. 6.24.2. Worldwide Clinical Trials Revenue and Gross Margin
      3. 6.24.3. Product portfolio
      4. 6.24.4. Recent initiatives
    25. 6.25. Bioanalytical Laboratory Services
      1. 6.25.1. Company Overview
      2. 6.25.2. Bioanalytical Laboratory Services Revenue and Gross Margin
      3. 6.25.3. Product portfolio
      4. 6.25.4. Recent initiatives
    26. 6.26. LGC
      1. 6.26.1. Company Overview
      2. 6.26.2. LGC Revenue and Gross Margin
      3. 6.26.3. Product portfolio
      4. 6.26.4. Recent initiatives
    27. 6.27. Sussex Research Laboratories Inc
      1. 6.27.1. Company Overview
      2. 6.27.2. Sussex Research Laboratories Inc Revenue and Gross Margin
      3. 6.27.3. Product portfolio
      4. 6.27.4. Recent initiatives
    28. 6.28. Wuxi AppTec
      1. 6.28.1. Company Overview
      2. 6.28.2. Wuxi AppTec Revenue and Gross Margin
      3. 6.28.3. Product portfolio
      4. 6.28.4. Recent initiatives
    29. 6.29. Smithers Avanza
      1. 6.29.1. Company Overview
      2. 6.29.2. Smithers Avanza Revenue and Gross Margin
      3. 6.29.3. Product portfolio
      4. 6.29.4. Recent initiatives
    30. 6.30. Others
      1. 6.30.1. Company Overview
      2. 6.30.2. Others Revenue and Gross Margin
      3. 6.30.3. Product portfolio
      4. 6.30.4. Recent initiatives
  7. CHAPTER 7. Bio-Analytical Services — Industry Analysis
    1. 7.1. Bio-Analytical Services Market – Key Trends
      1. 7.1.1. Market Drivers
      2. 7.1.2. Market Restraints
      3. 7.1.3. Market Opportunities
    2. 7.2. Value Chain Analysis
    3. 7.3. Technology Roadmap and Timeline
    4. 7.4. Bio-Analytical Services Market – Attractiveness Analysis
      1. 7.4.1. By Type
      2. 7.4.2. By End Users/ Application
      3. 7.4.3. By Region
  8. CHAPTER 8. Marketing Strategy Analysis, Distributors
    1. 8.1. Marketing Channel
    2. 8.2. Direct Marketing
    3. 8.3. Indirect Marketing
    4. 8.4. Marketing Channel Development Trend
    5. 8.5. Economic/Political Environmental Change
  9. CHAPTER 9. Report Conclusion
  10. CHAPTER 10. Research Approach & Methodology
    1. 10.1. Report Description
    2. 10.2. Research Scope
    3. 10.3. Research Methodology
      1. 10.3.1. Secondary Research
      2. 10.3.2. Primary Research
      3. 10.3.3. Models
        1. 10.3.3.1. Company Share Analysis Model
        2. 10.3.3.2. Revenue Based Modeling
        3. 10.3.3.3. Research Limitations

        List of Figures

        FIG. 1 Global Bio-Analytical Services Market, 2016-2026 (USD Million)
        FIG. 2 Global Bio-Analytical Services Market Share, by Type, 2019 & 2026 (USD Million)
        FIG. 3 Global Hyphenated Techniques Bio-Analytical Services Market, 2016-2026 (USD Million)
        FIG. 4 Global Chromatographic Methods Bio-Analytical Services Market, 2016-2026 (USD Million)
        FIG. 5 Global Nuclear Magnetic Resonance Bio-Analytical Services Market, 2016-2026 (USD Million)
        FIG. 6 Global Ligand Binding Assays Bio-Analytical Services Market, 2016-2026 (USD Million)
        FIG. 7 Global Mass Spectrometry Bio-Analytical Services Market, 2016-2026 (USD Million)
        FIG. 8 Global Bio-Analytical Services Market Share, by End Users/ Application, 2019 & 2026 (USD Million)
        FIG. 9 Global Small Molecule Analysis Bio-Analytical Services Market, 2016-2026 (USD Million)
        FIG. 10 Global Large Molecule Analysis Bio-Analytical Services Market, 2016-2026 (USD Million)
        FIG. 11 Global Bio-Analytical Services Market Share, by Region, 2019 & 2026
        FIG. 12 North America Bio-Analytical Services Market, 2016-2026
        FIG. 13 U.S. Bio-Analytical Services Market, 2016-2026
        FIG. 14 Canada Bio-Analytical Services Market, 2016-2026
        FIG. 15 Europe Bio-Analytical Services Market, 2016-2026
        FIG. 16 Germany Bio-Analytical Services Market, 2016-2026
        FIG. 17 France Bio-Analytical Services Market, 2016-2026
        FIG. 18 U.K. Bio-Analytical Services Market, 2016-2026
        FIG. 19 Italy Bio-Analytical Services Market, 2016-2026
        FIG. 20 Spain Bio-Analytical Services Market, 2016-2026
        FIG. 21 Rest of Europe Bio-Analytical Services Market, 2016-2026
        FIG. 22 Asia Pacific Bio-Analytical Services Market, 2016-2026
        FIG. 23 China Bio-Analytical Services Market, 2016-2026
        FIG. 24 Japan Bio-Analytical Services Market, 2016-2026
        FIG. 25 India Bio-Analytical Services Market, 2016-2026
        FIG. 26 South  Korea Bio-Analytical Services Market, 2016-2026
        FIG. 27 South-East Asia Bio-Analytical Services Market, 2016-2026
        FIG. 28 Rest of Asia Pacific Bio-Analytical Services Market, 2016-2026
        FIG. 29 Latin America Bio-Analytical Services Market, 2016-2026
        FIG. 30 Brazil Bio-Analytical Services Market, 2016-2026
        FIG. 31 Mexico Bio-Analytical Services Market, 2016-2026
        FIG. 32 Rest of Latin America Bio-Analytical Services Market, 2016-2026
        FIG. 33 The Middle-East and Africa Bio-Analytical Services Market, 2016-2026
        FIG. 34 GCC Countries Bio-Analytical Services Market, 2016-2026
        FIG. 35 South Africa Bio-Analytical Services Market, 2016-2026
        FIG. 36 Rest of Middle-East Africa Bio-Analytical Services Market, 2016-2026
        FIG. 37 Competitor Market Share – Revenue
        FIG. 38 Covance Inc Revenue and Growth Rate
        FIG. 39 Covance Inc Market Share
        FIG. 40 ICON plc Revenue and Growth Rate
        FIG. 41 ICON plc Market Share
        FIG. 42 Pharmaceutical Product Development LLC Revenue and Growth Rate
        FIG. 43 Pharmaceutical Product Development LLC Market Share
        FIG. 44 Eurofins Scientific Revenue and Growth Rate
        FIG. 45 Eurofins Scientific Market Share
        FIG. 46 KCAS Revenue and Growth Rate
        FIG. 47 KCAS Market Share
        FIG. 48 Charles River Laboratories International Inc Revenue and Growth Rate
        FIG. 49 Charles River Laboratories International Inc Market Share
        FIG. 50 Intertek Group plc Revenue and Growth Rate
        FIG. 51 Intertek Group plc Market Share
        FIG. 52 Euro Diagnostica AB Revenue and Growth Rate
        FIG. 53 Euro Diagnostica AB Market Share
        FIG. 54 InVentiv Health Clinical Revenue and Growth Rate
        FIG. 55 InVentiv Health Clinical Market Share
        FIG. 56 Cambridge Biomedical Revenue and Growth Rate
        FIG. 57 Cambridge Biomedical Market Share
        FIG. 58 Caprion Revenue and Growth Rate
        FIG. 59 Caprion Market Share
        FIG. 60 BioAgilytix Labs Revenue and Growth Rate
        FIG. 61 BioAgilytix Labs Market Share
        FIG. 62 IMET Revenue and Growth Rate
        FIG. 63 IMET Market Share
        FIG. 64 Nutrasource Diagnostics Inc Revenue and Growth Rate
        FIG. 65 Nutrasource Diagnostics Inc Market Share
        FIG. 66 Q 2 Solutions Revenue and Growth Rate
        FIG. 67 Q 2 Solutions Market Share
        FIG. 68 Absorption Systems LP Revenue and Growth Rate
        FIG. 69 Absorption Systems LP Market Share
        FIG. 70 Ricerca Revenue and Growth Rate
        FIG. 71 Ricerca Market Share
        FIG. 72 SGS United Kingdom Ltd Revenue and Growth Rate
        FIG. 73 SGS United Kingdom Ltd Market Share
        FIG. 74 Dynakin Revenue and Growth Rate
        FIG. 75 Dynakin Market Share
        FIG. 76 LKF Revenue and Growth Rate
        FIG. 77 LKF Market Share
        FIG. 78 Particle Sciences Revenue and Growth Rate
        FIG. 79 Particle Sciences Market Share
        FIG. 80 Celerion Revenue and Growth Rate
        FIG. 81 Celerion Market Share
        FIG. 82 Paraxel International Corporation Revenue and Growth Rate
        FIG. 83 Paraxel International Corporation Market Share
        FIG. 84 Worldwide Clinical Trials Revenue and Growth Rate
        FIG. 85 Worldwide Clinical Trials Market Share
        FIG. 86 Bioanalytical Laboratory Services Revenue and Growth Rate
        FIG. 87 Bioanalytical Laboratory Services Market Share
        FIG. 88 LGC Revenue and Growth Rate
        FIG. 89 LGC Market Share
        FIG. 90 Sussex Research Laboratories Inc Revenue and Growth Rate
        FIG. 91 Sussex Research Laboratories Inc Market Share
        FIG. 92 Wuxi AppTec Revenue and Growth Rate
        FIG. 93 Wuxi AppTec Market Share
        FIG. 94 Smithers Avanza Revenue and Growth Rate
        FIG. 95 Smithers Avanza Market Share
        FIG. 96 Others Revenue and Growth Rate
        FIG. 97 Others Market Share
        FIG. 98 Market Dynamics
        FIG. 99 Global Bio-Analytical Services – Value Chain Analysis
        FIG. 100 Technology Roadmap and Timeline
        FIG. 101 Market Attractiveness Analysis – By Type
        FIG. 102 Market Attractiveness Analysis – By End Users/ Application
        FIG. 103 Market Attractiveness Analysis – By Region
        FIG. 104 Market Channel
        FIG. 105 Marketing Channel Development Trend
        FIG. 106 Growth in World Gross Product, 2008-2019

        List of Tables

        TABLE 1 Global Bio-Analytical Services Market, 2019 & 2026 (USD Million)
        TABLE 2 Global Bio-Analytical Services market, by Type, 2016-2026 (USD Million)
        TABLE 3 Global Bio-Analytical Services market, by End Users/ Application, 2016-2026 (USD Million)
        TABLE 4 Global Bio-Analytical Services market, by Region, 2016-2026 (USD Million)
        TABLE 5 North America Bio-Analytical Services Market, by Type, 2016-2026 (USD Million)
        TABLE 6 North America Bio-Analytical Services Market, by End Users/ Application, 2016-2026 (USD Million)
        TABLE 7 Europe Bio-Analytical Services Market, by Type, 2016-2026 (USD Million)
        TABLE 8 Europe Bio-Analytical Services Market, by End Users/ Application, 2016-2026 (USD Million)
        TABLE 9 Asia Pacific Bio-Analytical Services Market, by Type, 2016-2026 (USD Million)
        TABLE 10 Asia Pacific Bio-Analytical Services Market, by End Users/ Application, 2016-2026 (USD Million)
        TABLE 11 Latin America Bio-Analytical Services Market, by Type, 2016-2026 (USD Million)
        TABLE 12 Latin America Bio-Analytical Services Market, by End Users/ Application, 2016-2026 (USD Million)
        TABLE 13 The Middle-East and Africa Bio-Analytical Services Market, by Type, 2016-2026 (USD Million)
        TABLE 14 The Middle-East and Africa Bio-Analytical Services Market, by End Users/ Application, 2016-2026 (USD Million)
        TABLE 15 Global Bio-Analytical Services Market - Company Revenue Analysis 2016-2019 (USD Million)
        TABLE 16 Global Bio-Analytical Services Market - Company Revenue Share Analysis 2016-2019(%)
        TABLE 17 Acquisitions and Mergers
        TABLE 18 New Product/Service Launch
        TABLE 19 Research & Development Activities
        TABLE 20 Market Drivers
        TABLE 21 Market Restraints
        TABLE 22 Market Opportunities

Industry Major Market Players

  • Covance Inc
  •  ICON plc
  •  Pharmaceutical Product Development LLC
  •  Eurofins Scientific
  •  KCAS
  •  Charles River Laboratories International Inc
  •  Intertek Group plc
  •  Euro Diagnostica AB
  •  InVentiv Health Clinical
  •  Cambridge Biomedical
  •  Caprion
  •  BioAgilytix Labs
  •  IMET
  •  Nutrasource Diagnostics Inc
  •  Q 2 Solutions
  •  Absorption Systems LP
  •  Ricerca
  •  SGS United Kingdom Ltd
  •  Dynakin
  •  LKF
  •  Particle Sciences
  •  Celerion
  •  Paraxel International Corporation
  •  Worldwide Clinical Trials