Search Market Research Report

Discover Our Latest Reports
Discover Our Featured Reports
Discover Top Selling Reports

Beverages Can Market Size, Share Global Analysis Report, 2020–2026

report img

Beverages Can Market By Type (Aluminium and Steel), By Application (Non-Alcoholic Beverages and Alcoholic Beverages): Global Industry Outlook, Market Size, Business Intelligence, Consumer Preferences, Statistical Surveys, Comprehensive Analysis, Historical Developments, Current Trends, and Forecast 2020–2026

Industry Insights

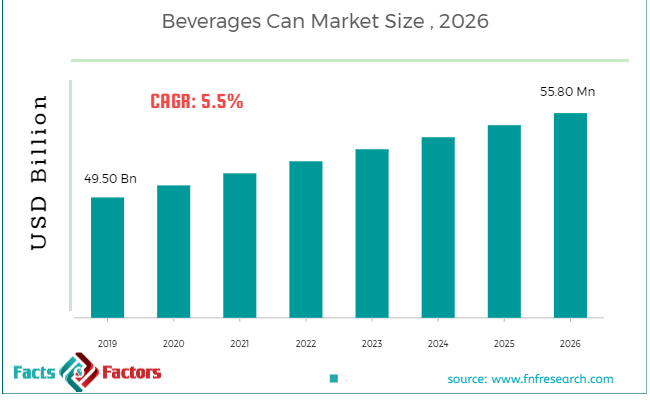
[175+ Pages Report] According to the report published by Facts Factors, the global beverages can market size was worth around USD 49.50 billion in 2019 and is predicted to grow to around USD 55.80 billion by 2026 with a compound annual growth rate (CAGR) of roughly 5.5% between 2020 and 2026. The report analyzes the global beverages can market drivers, restraints/challenges, and the effect they have on the demands during the projection period. In addition, the report explores emerging opportunities in the beverages can market.

Beverages Can Market

To know more about this report | Request Free Sample Copy

This specialized and expertise oriented industry research report scrutinizes the technical and commercial business outlook of the Beverage Can industry. The report analyzes and declares the historical and current trends analysis of the Beverage Can industry and subsequently recommends the projected trends anticipated to be observed in the Beverage Can market during the upcoming years.

The beverage can market report analyzes and notifies the industry statistics at the global as well as regional and country levels in order to acquire a thorough perspective of the entire Beverage Can market. The historical and past insights are provided for FY 2016 to FY 2019 whereas projected trends are delivered for FY 2020 to FY 2026. The quantitative and numerical data is represented in terms of volume (Billion Units) and value (USD Billion) from FY 2016 – 2026.

The quantitative data is further underlined and reinforced by comprehensive qualitative data which comprises various across-the-board market dynamics. The rationales which directly or indirectly impact the Beverage Can industry are exemplified through parameters such as growth drivers, restraints, challenges, and opportunities among other impacting factors.


logoKey Insights from Primary Research

  • As per the finding through primary interviews with industry experts, the North America beverage industry shows significant growth due to modern lifestyle, rising demand for canned beverages, growing consumer preference for premium beverages
  • Consumer choices and demand are changing continuously
  • Sports drinks and energy drinks are anticipated to exhibit significant opportunities for beverage cans in the coming years  
  • Innovative designs and production technologies are employed by beverage can developers
  • Increasing social acceptance of alcoholic beverages, urbanization, and recycled aluminum cans are the key industry trends

logoKey Recommendations from Analysts

  • Our research analyst suggests rising demand for long shelf-life organic beverages may drive the market demand during the forecast period
  • Promotion of metal packaging by regulatory bodies such as Metal Packaging Europe Association and national governments of Germany, France, and the UK are supporting the market growth in the region
  • Beverage cans in the U.S. are mainly used for premium beverages such as ready to drink coffee, energy drinks, and carbonated water        
  • The performance of the beverage can market is directly proportional to the performance of the beverage industry
  • The global beer market is growing significantly with the rising demand in the Asia Pacific region. This, in turn, is expected to offer market growth opportunities

logoMarket Snapshot

Beverages Can Market

To know more about this report | Request Free Sample Copy


Throughout our research report, we have encompassed all the proven models and tools of industry analysis and extensively illustrated all the key business strategies and business models adopted in the Beverage Can industry. The report provides an all-inclusive and detailed competitive landscape prevalent in the Beverage Can market.

The report utilizes established industry analysis tools and models such as Porter’s Five Forces framework to analyze and recognize critical business strategies adopted by various stakeholders involved in the entire value chain of the Beverage Can industry. The Beverage Can market report additionally employs SWOT analysis and PESTLE analysis models for further in-depth analysis.

The report study further includes an in-depth analysis of industry players' market shares and provides an overview of leading players' market position in the Beverage Can sector. Key strategic developments in the Beverage Can market competitive landscape such as acquisitions & mergers, inaugurations of different products and services, partnerships & joint ventures, MoU agreements, VC & funding activities, R&D activities, and geographic expansion among other noteworthy activities by key players of the Beverage Can market are appropriately highlighted in the report.

logoReport Scope

Report Attribute

Details

Market Size in 2019

USD 49.50 Billion

Projected Market Size in 2026

USD 55.80 Billion

CAGR Growth Rate

5.5% CAGR

Base Year

2019

Forecast Years

2020-2026

Key Market Players

Schott Glaswerke AG, Edmund Optics, Ohara Corporation, Hoya Corporation, CORNING, CDGM Glass Company, Nikon Corporation, and Others

Key Segment

By Type, Application, and Region

Major Regions Covered

North America, Europe, Asia Pacific, Latin America, and the Middle East & Africa

Purchase Options

Request customized purchase options to meet your research needs.Explore purchase options

The beverage can market in the emerging countries of the Asia Pacific region such as China, India, and Japan is growing significantly. Growing consumption of fruit juice and energy drinks among children is driving the market demand in emerging economies. Increasing social acceptance of alcoholic beverages, urbanization, increasing disposable income and various promotional programs undertaken by the manufacturer is anticipated to boost the growth of the beverage can market in India.

The growing number of health-conscious consumers in Japan prefer ready to drink coffee and tea for daily consumption. The increasing population of young workers and women is driving the growth of the soft drink market in Japan. This, in turn, is expected to boost the growth of the beverage can market in Japan during the forecast period.

logoSome of the essential players operating in the beverage can market, but not restricted to include

  •  Schott Glaswerke AG
  •  Edmund Optics
  •  Ohara Corporation
  •  Hoya Corporation
  •  CORNING
  •  CDGM Glass Company
  •  Nikon Corporation

The taxonomy of the Beverage Can industry by its scope and segmentation is as follows:

logo
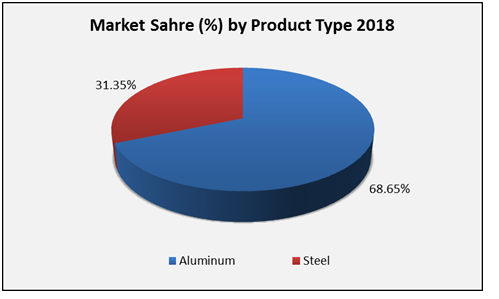
By Type Segmentation Analysis

  • Aluminium
  • Steel

logoBy Application Segmentation Analysis

  • Non-alcoholic beverages
  • Alcoholic beverages

logoBy Regional Segmentation Analysis

  • North America
    • The U.S.
    • Canada
  • Europe
    • Germany
    • The UK
    • France
    • Spain
    • Italy
    • Rest of Europe
  • Asia Pacific
    • China
    • Japan
    • India
    • South Korea
    • Southeast Asia
    • Rest of Asia Pacific
  • Latin America
    • Brazil
    • Mexico
    • Rest of Latin America
  • Middle East & Africa
    • GCC
    • South Africa
    • Rest of Middle East & Africa

Table of Content

  1. CHAPTER 1. Executive Summary
  2. CHAPTER 2. Beverages Can market – Type Analysis
    1. 2.1. Global Beverages Can Market – Type Overview
    2. 2.2. Global Beverages Can Market Share, by Type, 2018 & 2025 (USD Billion)
    3. 2.3. Global Beverages Can Market share, by Type, 2018 & 2025 (Billion Units)
    4. 2.4. Aluminium
      1. 2.4.1. Global Aluminium Beverages Can Market, 2016-2026 (USD Billion)
      2. 2.4.2. Global Aluminium Beverages Can Market, 2016-2026 (Billion Units)
    5. 2.5. Steel
      1. 2.5.1. Global Steel Beverages Can Market, 2016-2026 (USD Billion)
      2. 2.5.2. Global Steel Beverages Can Market, 2016-2026 (Billion Units)
  3. CHAPTER 3. Beverages Can market – Application Analysis
    1. 3.1. Global Beverages Can Market – Application Overview
    2. 3.2. Global Beverages Can Market Share, by Application, 2018 & 2025 (USD Billion)
    3. 3.3. Global Beverages Can Market share, by Application, 2018 & 2025 (Billion Units)
    4. 3.4. Non-alcoholic beverages
      1. 3.4.1. Global Non-alcoholic beverages Beverages Can Market, 2016-2026 (USD Billion)
      2. 3.4.2. Global Non-alcoholic beverages Beverages Can Market, 2016-2026 (Billion Units)
    5. 3.5. Alcoholic beverages
      1. 3.5.1. Global Alcoholic beverages Beverages Can Market, 2016-2026 (USD Billion)
      2. 3.5.2. Global Alcoholic beverages Beverages Can Market, 2016-2026 (Billion Units)
  4. CHAPTER 4. Beverages Can market – Regional Analysis
    1. 4.1. Global Beverages Can Market Regional Overview
    2. 4.2. Global Beverages Can Market Share, by Region, 2018 & 2025 (Value)
    3. 4.3. Global Beverages Can Market Share, by Region, 2018 & 2025 (Volume)
    4. 4.4. North America
      1. 4.4.1. North America Beverages Can Market size and forecast, 2016-2026
      2. 4.4.2. North America Beverages Can Market, by Country, 2018 - 2025 (USD Billion)
      3. 4.4.3. North America Market size and forecast, 2016-2026 (Billion Units)
      4. 4.4.4. North America Beverages Can Market, by Country, 2018 - 2025 (Billion Units)
      5. 4.4.5. North America Beverages Can Market, by Type, 2016-2026
        1. 4.4.5.1. North America Beverages Can Market, by Type, 2016-2026 (USD Billion)
        2. 4.4.5.2. North America Beverages Can Market, by Type, 2016-2026 (Billion Units)
      6. 4.4.6. North America Beverages Can Market, by Application, 2016-2026
        1. 4.4.6.1. North America Beverages Can Market, by Application, 2016-2026 (USD Billion)
        2. 4.4.6.2. North America Beverages Can Market, by Application, 2016-2026 (Billion Units)
      7. 4.4.7. U.S.
        1. 4.4.7.1. U.S. Market size and forecast, 2016-2026 (USD Billion)
        2. 4.4.7.2. U.S. Market size and forecast, 2016-2026 (Billion Units)
      8. 4.4.8. Canada
        1. 4.4.8.1. Canada Market size and forecast, 2016-2026 (USD Billion)
        2. 4.4.8.2. Canada Market size and forecast, 2016-2026 (Billion Units)
    5. 4.5. Europe
      1. 4.5.1. Europe Beverages Can Market size and forecast, 2016-2026
      2. 4.5.2. Europe Beverages Can Market, by Country, 2018 - 2025 (USD Billion)
      3. 4.5.3. Europe Market size and forecast, 2016-2026 (Billion Units)
      4. 4.5.4. Europe Beverages Can Market, by Country, 2018 - 2025 (Billion Units)
      5. 4.5.5. Europe Beverages Can Market, by Type, 2016-2026
        1. 4.5.5.1. Europe Beverages Can Market, by Type, 2016-2026 (USD Billion)
        2. 4.5.5.2. Europe Beverages Can Market, by Type, 2016-2026 (Billion Units)
      6. 4.5.6. Europe Beverages Can Market, by Application, 2016-2026
        1. 4.5.6.1. Europe Beverages Can Market, by Application, 2016-2026 (USD Billion)
        2. 4.5.6.2. Europe Beverages Can Market, by Application, 2016-2026 (Billion Units)
      7. 4.5.7. Germany
        1. 4.5.7.1. Germany Market size and forecast, 2016-2026 (USD Billion)
        2. 4.5.7.2. Germany Market size and forecast, 2016-2026 (Billion Units)
      8. 4.5.8. France
        1. 4.5.8.1. France Market size and forecast, 2016-2026 (USD Billion)
        2. 4.5.8.2. France Market size and forecast, 2016-2026 (Billion Units)
      9. 4.5.9. U.K.
        1. 4.5.9.1. U.K. Market size and forecast, 2016-2026 (USD Billion)
        2. 4.5.9.2. U.K. Market size and forecast, 2016-2026 (Billion Units)
      10. 4.5.10. Italy
        1. 4.5.10.1. Italy Market size and forecast, 2016-2026 (USD Billion)
        2. 4.5.10.2. Italy Market size and forecast, 2016-2026 (Billion Units)
      11. 4.5.11. Spain
        1. 4.5.11.1. Spain Market size and forecast, 2016-2026 (USD Billion)
        2. 4.5.11.2. Spain Market size and forecast, 2016-2026 (Billion Units)
      12. 4.5.12. Rest of Europe
        1. 4.5.12.1. Rest of Europe Market size and forecast, 2016-2026 (USD Billion)
        2. 4.5.12.2. Rest of Europe Market size and forecast, 2016-2026 (Billion Units)
    6. 4.6. Asia Pacific
      1. 4.6.1. Asia Pacific Beverages Can Market size and forecast, 2016-2026
      2. 4.6.2. Asia Pacific Beverages Can Market, by Country, 2018 - 2025 (USD Billion)
      3. 4.6.3. Asia Pacific Market size and forecast, 2016-2026 (Billion Units)
      4. 4.6.4. Asia Pacific Beverages Can Market, by Country, 2018 - 2025 (Billion Units)
      5. 4.6.5. Asia Pacific Beverages Can Market, by Type, 2016-2026
        1. 4.6.5.1. Asia Pacific Beverages Can Market, by Type, 2016-2026 (USD Billion)
        2. 4.6.5.2. Asia Pacific Beverages Can Market, by Type, 2016-2026 (Billion Units)
      6. 4.6.6. Asia Pacific Beverages Can Market, by Application, 2016-2026
        1. 4.6.6.1. Asia Pacific Beverages Can Market, by Application, 2016-2026 (USD Billion)
        2. 4.6.6.2. Asia Pacific Beverages Can Market, by Application, 2016-2026 (Billion Units)
      7. 4.6.7. China
        1. 4.6.7.1. China Market size and forecast, 2016-2026 (USD Billion)
        2. 4.6.7.2. China Market size and forecast, 2016-2026 (Billion Units)
      8. 4.6.8. Japan
        1. 4.6.8.1. Japan Market size and forecast, 2016-2026 (USD Billion)
        2. 4.6.8.2. Japan Market size and forecast, 2016-2026 (Billion Units)
      9. 4.6.9. India
        1. 4.6.9.1. India Market size and forecast, 2016-2026 (USD Billion)
        2. 4.6.9.2. India Market size and forecast, 2016-2026 (Billion Units)
      10. 4.6.10. South Korea
        1. 4.6.10.1. South Korea Market size and forecast, 2016-2026 (USD Billion)
        2. 4.6.10.2. South Korea Market size and forecast, 2016-2026 (Billion Units)
      11. 4.6.11. South-East Asia
        1. 4.6.11.1. South-East Asia Market size and forecast, 2016-2026 (USD Billion)
        2. 4.6.11.2. South-East Asia Market size and forecast, 2016-2026 (Billion Units)
      12. 4.6.12. Rest of Asia Pacific
        1. 4.6.12.1. Rest of Asia Pacific Market size and forecast, 2016-2026 (USD Billion)
        2. 4.6.12.2. Rest of Asia Pacific Market size and forecast, 2016-2026 (Billion Units)
    7. 4.7. Latin America
      1. 4.7.1. Latin America Beverages Can Market size and forecast, 2016-2026
      2. 4.7.2. Latin America Beverages Can Market, by Country, 2018 - 2025 (USD Billion)
      3. 4.7.3. Latin America Market size and forecast, 2016-2026 (Billion Units)
      4. 4.7.4. Latin America Beverages Can Market, by Country, 2018 - 2025 (Billion Units)
      5. 4.7.5. Latin America Beverages Can Market, by Type, 2016-2026
        1. 4.7.5.1. Latin America Beverages Can Market, by Type, 2016-2026 (USD Billion)
        2. 4.7.5.2. Latin America Beverages Can Market, by Type, 2016-2026 (Billion Units)
      6. 4.7.6. Latin America Beverages Can Market, by Application, 2016-2026
        1. 4.7.6.1. Latin America Beverages Can Market, by Application, 2016-2026 (USD Billion)
        2. 4.7.6.2. Latin America Beverages Can Market, by Application, 2016-2026 (Billion Units)
      7. 4.7.7. Brazil
        1. 4.7.7.1. Brazil Market size and forecast, 2016-2026 (USD Billion)
        2. 4.7.7.2. Brazil Market size and forecast, 2016-2026 (Billion Units)
      8. 4.7.8. Mexico
        1. 4.7.8.1. Mexico Market size and forecast, 2016-2026 (USD Billion)
        2. 4.7.8.2. Mexico Market size and forecast, 2016-2026 (Billion Units)
      9. 4.7.9. Rest of Latin America
        1. 4.7.9.1. Rest of Latin America Market size and forecast, 2016-2026 (USD Billion)
        2. 4.7.9.2. Rest of Latin America Market size and forecast, 2016-2026 (Billion Units)
    8. 4.8. The Middle-East and Africa
      1. 4.8.1. The Middle-East and Africa Beverages Can Market size and forecast, 2016-2026
      2. 4.8.2. The Middle-East and Africa Beverages Can Market, by Country, 2018 - 2025 (USD Billion)
      3. 4.8.3. The Middle-East and Africa Market size and forecast, 2016-2026 (Billion Units)
      4. 4.8.4. The Middle-East and Africa Beverages Can Market, by Country, 2018 - 2025 (Billion Units)
      5. 4.8.5. The Middle-East and Africa Beverages Can Market, by Type, 2016-2026
        1. 4.8.5.1. The Middle-East and Africa Beverages Can Market, by Type, 2016-2026 (USD Billion)
        2. 4.8.5.2. The Middle-East and Africa Beverages Can Market, by Type, 2016-2026 (Billion Units)
      6. 4.8.6. The Middle-East and Africa Beverages Can Market, by Application, 2016-2026
        1. 4.8.6.1. The Middle-East and Africa Beverages Can Market, by Application, 2016-2026 (USD Billion)
        2. 4.8.6.2. The Middle-East and Africa Beverages Can Market, by Application, 2016-2026 (Billion Units)
      7. 4.8.7. GCC Countries
        1. 4.8.7.1. GCC Countries Market size and forecast, 2016-2026 (USD Billion)
        2. 4.8.7.2. GCC Countries Market size and forecast, 2016-2026 (Billion Units)
      8. 4.8.8. South Africa
        1. 4.8.8.1. South Africa Market size and forecast, 2016-2026 (USD Billion)
        2. 4.8.8.2. South Africa Market size and forecast, 2016-2026 (Billion Units)
      9. 4.8.9. Rest of Middle-East Africa
        1. 4.8.9.1. Rest of Middle-East Africa Market size and forecast, 2016-2026 (USD Billion)
        2. 4.8.9.2. Rest of Middle-East Africa Market size and forecast, 2016-2026 (Billion Units)
  5. CHAPTER 5. Beverages Can Production, Consumption, Export, Import by Regions
    1. 5.1. Global Beverages Can production and revenue, 2015-2025 (USD Billion) (Billion Units)
    2. 5.2. Global Import and Export Analysis, by Region
  6. CHAPTER 6. Beverages Can market – Competitive Landscape
    1. 6.1. Competitor Market Share – Revenue
    2. 6.2. Market Concentration Rate Analysis, Top 3 and Top 5 Players
    3. 6.3. Competitor Market Share – Volume
    4. 6.4. Strategic Development
      1. 6.4.1. Acquisitions and Mergers
      2. 6.4.2. New Products
      3. 6.4.3. Research & Development Activities
  7. CHAPTER 7. Company Profiles
    1. 7.1. Schott Glaswerke AG
      1. 7.1.1. Company Overview
      2. 7.1.2. Schott Glaswerke AG Sales, Revenue, Price, and Gross Margin
      3. 7.1.3. Product portfolio
      4. 7.1.4. Recent initiatives
    2. 7.2. Ohara Corporation
      1. 7.2.1. Company Overview
      2. 7.2.2. Ohara Corporation Sales, Revenue, Price, and Gross Margin
      3. 7.2.3. Product portfolio
      4. 7.2.4. Recent initiatives
    3. 7.3. HOYA CORPORATION
      1. 7.3.1. Company Overview
      2. 7.3.2. HOYA CORPORATION Sales, Revenue, Price, and Gross Margin
      3. 7.3.3. Product portfolio
      4. 7.3.4. Recent initiatives
    4. 7.4. CDGM Glass Company
      1. 7.4.1. Company Overview
      2. 7.4.2. CDGM Glass Company Sales, Revenue, Price, and Gross Margin
      3. 7.4.3. Product portfolio
      4. 7.4.4. Recent initiatives
    5. 7.5. Edmund Optics
      1. 7.5.1. Company Overview
      2. 7.5.2. Edmund Optics Sales, Revenue, Price, and Gross Margin
      3. 7.5.3. Product portfolio
      4. 7.5.4. Recent initiatives
    6. 7.6. Nikon Corporation
      1. 7.6.1. Company Overview
      2. 7.6.2. Nikon Corporation Sales, Revenue, Price, and Gross Margin
      3. 7.6.3. Product portfolio
      4. 7.6.4. Recent initiatives
    7. 7.7. CORNING
      1. 7.7.1. Company Overview
      2. 7.7.2. CORNING Sales, Revenue, Price, and Gross Margin
      3. 7.7.3. Product portfolio
      4. 7.7.4. Recent initiatives
    8. 7.8. Others
      1. 7.8.1. Company Overview
      2. 7.8.2. Others Sales, Revenue, Price, and Gross Margin
      3. 7.8.3. Product portfolio
      4. 7.8.4. Recent initiatives
  8. CHAPTER 8. Beverages Can — Industry Analysis
    1. 8.1. Introduction and Taxonomy
    2. 8.2. Beverages Can Market – Key Trends
      1. 8.2.1. Market Drivers
      2. 8.2.2. Market Restraints
      3. 8.2.3. Market Opportunities
    3. 8.3. Value Chain Analysis
    4. 8.4. Key Mandates and Regulations
    5. 8.5. Technology Roadmap and Timeline
    6. 8.6. Beverages Can market – Attractiveness Analysis
      1. 8.6.1. By Type
      2. 8.6.2. By Application
      3. 8.6.3. By Region
  9. CHAPTER 9. Raw Material analysis
    1. 9.1. Beverages Can Key Raw Material Analysis
      1. 9.1.1. Key Raw Materials
      2. 9.1.2. Price Trend of Key Raw Materials
    2. 9.2. Key Suppliers of Raw Materials
    3. 9.3. Proportion of Manufacturing Cost Structure
      1. 9.3.1. Raw Materials
      2. 9.3.2. Labor Cost
    4. 9.4. Manufacturing Expenses Analysis of Beverages Can
  10. CHAPTER 10. Industrial Chain, Sourcing Strategy and Downstream Buyers
    1. 10.1. Beverages Can Industrial Chain Analysis
    2. 10.2. Upstream Raw Materials Sourcing
      1. 10.2.1. Risk Mitigation:
      2. 10.2.2. Supplier Relationships:
      3. 10.2.3. Business Processes:
      4. 10.2.4. Securing the Product:
    3. 10.3. Raw Materials Sources of Beverages Can Major Manufacturers in 2016
    4. 10.4. Downstream Buyers
    5. 10.5. Distributors/Traders List
  11. CHAPTER 11. Marketing Strategy Analysis, Distributors
    1. 11.1. Marketing Channel
    2. 11.2. Direct Marketing
    3. 11.3. Indirect Marketing
    4. 11.4. Marketing Channel Development Trend
    5. 11.5. Economic/Political Environmental Change
  12. CHAPTER 12. Report Conclusion
  13. CHAPTER 13. Research Approach & Methodology
    1. 13.1. Report Description
    2. 13.2. Research Scope
    3. 13.3. Research Methodology
      1. 13.3.1. Secondary Research
      2. 13.3.2. Primary Research
      3. 13.3.3. Models
        1. 13.3.3.1. Company Share Analysis Model
        2. 13.3.3.2. Revenue Based Modeling
        3. 13.3.3.3. Research Limitations

        List of Figures

        FIG. 1 Global Beverages Can Market, 2016-2026 (USD Billion)
        FIG. 2 Global Beverages Can Market Share, by Type, 2018 & 2025 (USD Billion)
        FIG. 3 Global Beverages Can Market share, by Type, 2018 & 2025 (Billion Units)
        FIG. 4 Global Aluminium Beverages Can Market, 2016-2026 (USD Billion)
        FIG. 5 Global Aluminium Beverages Can  Market, 2016-2026 (Billion Units)
        FIG. 6 Global Steel Beverages Can Market, 2016-2026 (USD Billion)
        FIG. 7 Global Steel Beverages Can  Market, 2016-2026 (Billion Units)
        FIG. 8 Global Beverages Can Market Share, by Application, 2018 & 2025 (USD Billion)
        FIG. 9 Global Beverages Can Market share, by Application, 2018 & 2025 (Billion Units)
        FIG. 10 Global Non-alcoholic beverages Beverages Can Market, 2016-2026 (USD Billion)
        FIG. 11 Global Non-alcoholic beverages Beverages Can  Market, 2016-2026 (Billion Units)
        FIG. 12 Global Alcoholic beverages Beverages Can Market, 2016-2026 (USD Billion)
        FIG. 13 Global Alcoholic beverages Beverages Can  Market, 2016-2026 (Billion Units)
        FIG. 14 Global Beverages Can Market Share, by Region, 2018 & 2025
        FIG. 15 Global Beverages Can Market Share, by Region, 2018 & 2025
        FIG. 16 North America Beverages Can Market, 2016-2026
        FIG. 17 North America Beverages Can  Market, 2016-2026 (Billion Units)
        FIG. 18 U.S. Beverages Can Market, 2016-2026
        FIG. 19 U.S. Beverages Can  Market, 2016-2026 (Billion Units)
        FIG. 20 Canada Beverages Can Market, 2016-2026
        FIG. 21 Canada Beverages Can  Market, 2016-2026 (Billion Units)
        FIG. 22 Europe Beverages Can Market, 2016-2026
        FIG. 23 Europe Beverages Can  Market, 2016-2026 (Billion Units)
        FIG. 24 Germany Beverages Can Market, 2016-2026
        FIG. 25 Germany Beverages Can  Market, 2016-2026 (Billion Units)
        FIG. 26 France Beverages Can Market, 2016-2026
        FIG. 27 France Beverages Can  Market, 2016-2026 (Billion Units)
        FIG. 28 U.K. Beverages Can Market, 2016-2026
        FIG. 29 U.K. Beverages Can  Market, 2016-2026 (Billion Units)
        FIG. 30 Italy Beverages Can Market, 2016-2026
        FIG. 31 Italy Beverages Can  Market, 2016-2026 (Billion Units)
        FIG. 32 Spain Beverages Can Market, 2016-2026
        FIG. 33 Spain Beverages Can  Market, 2016-2026 (Billion Units)
        FIG. 34 Rest of Europe Beverages Can Market, 2016-2026
        FIG. 35 Rest of Europe Beverages Can  Market, 2016-2026 (Billion Units)
        FIG. 36 Asia Pacific Beverages Can Market, 2016-2026
        FIG. 37 Asia Pacific Beverages Can  Market, 2016-2026 (Billion Units)
        FIG. 38 China Beverages Can Market, 2016-2026
        FIG. 39 China Beverages Can  Market, 2016-2026 (Billion Units)
        FIG. 40 Japan Beverages Can Market, 2016-2026
        FIG. 41 Japan Beverages Can  Market, 2016-2026 (Billion Units)
        FIG. 42 India Beverages Can Market, 2016-2026
        FIG. 43 India Beverages Can  Market, 2016-2026 (Billion Units)
        FIG. 44 South  Korea Beverages Can Market, 2016-2026
        FIG. 45 South  Korea Beverages Can  Market, 2016-2026 (Billion Units)
        FIG. 46 South-East Asia Beverages Can Market, 2016-2026
        FIG. 47 South-East Asia Beverages Can  Market, 2016-2026 (Billion Units)
        FIG. 48 Rest of Asia Pacific Beverages Can Market, 2016-2026
        FIG. 49 Rest of Asia Pacific Beverages Can  Market, 2016-2026 (Billion Units)
        FIG. 50 Latin America Beverages Can Market, 2016-2026
        FIG. 51 Latin America Beverages Can  Market, 2016-2026 (Billion Units)
        FIG. 52 Brazil Beverages Can Market, 2016-2026
        FIG. 53 Brazil Beverages Can  Market, 2016-2026 (Billion Units)
        FIG. 54 Mexico Beverages Can Market, 2016-2026
        FIG. 55 Mexico Beverages Can  Market, 2016-2026 (Billion Units)
        FIG. 56 Rest of Latin America Beverages Can Market, 2016-2026
        FIG. 57 Rest of Latin America Beverages Can  Market, 2016-2026 (Billion Units)
        FIG. 58 The Middle-East and Africa Beverages Can Market, 2016-2026
        FIG. 59 The Middle-East and Africa Beverages Can  Market, 2016-2026 (Billion Units)
        FIG. 60 GCC Countries Beverages Can Market, 2016-2026
        FIG. 61 GCC Countries Beverages Can  Market, 2016-2026 (Billion Units)
        FIG. 62 South Africa Beverages Can Market, 2016-2026
        FIG. 63 South Africa Beverages Can  Market, 2016-2026 (Billion Units)
        FIG. 64 Rest of Middle-East Africa Beverages Can Market, 2016-2026
        FIG. 65 Rest of Middle-East Africa Beverages Can  Market, 2016-2026 (Billion Units)
        FIG. 66 Global Beverages Can production and revenue, 2015-2025 (USD Billion) (Billion Units)
        FIG. 67 North America Beverages Can production and revenue, 2015-2025 (USD Billion) (Billion Units)
        FIG. 68 Europe Beverages Can production and revenue, 2015-2025 (USD Billion) (Billion Units)
        FIG. 69 Asia Pacific Beverages Can production and revenue, 2015-2025 (USD Billion) (Billion Units)
        FIG. 70 Latin America Beverages Can production and revenue, 2015-2025 (USD Billion) (Billion Units)
        FIG. 71 Middle East and Africa Beverages Can production and revenue, 2015-2025 (USD Billion) (Billion Units)
        FIG. 72 Competitor Market Share – Revenue
        FIG. 73 Competitor Market Share – Volume
        FIG. 74 Schott Glaswerke AG Revenue and Growth Rate
        FIG. 75 Schott Glaswerke AG Market Share
        FIG. 76 Ohara Corporation Revenue and Growth Rate
        FIG. 77 Ohara Corporation Market Share
        FIG. 78 HOYA CORPORATION Revenue and Growth Rate
        FIG. 79 HOYA CORPORATION Market Share
        FIG. 80 CDGM Glass Company Revenue and Growth Rate
        FIG. 81 CDGM Glass Company Market Share
        FIG. 82 Edmund Optics Revenue and Growth Rate
        FIG. 83 Edmund Optics Market Share
        FIG. 84 Nikon Corporation Revenue and Growth Rate
        FIG. 85 Nikon Corporation Market Share
        FIG. 86 CORNING Revenue and Growth Rate
        FIG. 87 CORNING Market Share
        FIG. 88 Others Revenue and Growth Rate
        FIG. 89 Others Market Share
        FIG. 90 Market Dynamics
        FIG. 91 Global Beverages Can – Value Chain Analysis
        FIG. 92 Key Mandates and Regulations
        FIG. 93 Technology Roadmap and Timeline
        FIG. 94 Market Attractiveness Analysis – By Type
        FIG. 95 Market Attractiveness Analysis – By Application
        FIG. 96 Market Attractiveness Analysis – By Region
        FIG. 97 Manufacturing Cost Structure of Beverages Can
        FIG. 98 Beverages Can Industrial Chain Analysis
        FIG. 99 Market Channel
        FIG. 100 Marketing Channel Development Trend
        FIG. 101 Growth in World Gross Product, 2008-2018

        List of Tables

        TABLE 1 Global Beverages Can market, 2018 & 2025 (USD Billion)
        TABLE 2 Global Beverages Can market, by Type, 2016-2026 (USD Billion)
        TABLE 3 Global Beverages Can market, by Type, 2016-2026 (Billion Units)
        TABLE 4 Global Beverages Can market, by Application, 2016-2026 (USD Billion)
        TABLE 5 Global Beverages Can market, by Application, 2016-2026 (Billion Units)
        TABLE 6 Global Beverages Can market, by region, 2016-2026 (USD Billion)
        TABLE 7 Global Beverages Can market, by region, 2016-2026 (Billion Units)
        TABLE 8 North America Beverages Can Market, by Type, 2016-2026 (USD Billion)
        TABLE 9 North America Beverages Can Market, by Type, 2016-2026 (Billion Units)
        TABLE 10 North America Beverages Can Market, by Application, 2016-2026 (USD Billion)
        TABLE 11 North America Beverages Can Market, by Application, 2016-2026 (Billion Units)
        TABLE 12 Europe Beverages Can Market, by Type, 2016-2026 (USD Billion)
        TABLE 13 Europe Beverages Can Market, by Type, 2016-2026 (Billion Units)
        TABLE 14 Europe Beverages Can Market, by Application, 2016-2026 (USD Billion)
        TABLE 15 Europe Beverages Can Market, by Application, 2016-2026 (Billion Units)
        TABLE 16 Asia Pacific Beverages Can Market, by Type, 2016-2026 (USD Billion)
        TABLE 17 Asia Pacific Beverages Can Market, by Type, 2016-2026 (Billion Units)
        TABLE 18 Asia Pacific Beverages Can Market, by Application, 2016-2026 (USD Billion)
        TABLE 19 Asia Pacific Beverages Can Market, by Application, 2016-2026 (Billion Units)
        TABLE 20 Latin America Beverages Can Market, by Type, 2016-2026 (USD Billion)
        TABLE 21 Latin America Beverages Can Market, by Type, 2016-2026 (Billion Units)
        TABLE 22 Latin America Beverages Can Market, by Application, 2016-2026 (USD Billion)
        TABLE 23 Latin America Beverages Can Market, by Application, 2016-2026 (Billion Units)
        TABLE 24 The Middle-East and Africa Beverages Can Market, by Type, 2016-2026 (USD Billion)
        TABLE 25 The Middle-East and Africa Beverages Can Market, by Type, 2016-2026 (Billion Units)
        TABLE 26 The Middle-East and Africa Beverages Can Market, by Application, 2016-2026 (USD Billion)
        TABLE 27 The Middle-East and Africa Beverages Can Market, by Application, 2016-2026 (Billion Units)
        TABLE 28 North America Beverages Can Production, Consumption, Export, Import, 2016-2019
        TABLE 29 Europe Beverages Can Production, Consumption, Export, Import, 2016-2019
        TABLE 30 Asia Pacific Beverages Can Production, Consumption, Export, Import, 2016-2019
        TABLE 31 Latin America Beverages Can Production, Consumption, Export, Import, 2016-2019
        TABLE 32 Middle East & Africa Beverages Can Production, Consumption, Export, Import, 2016-2019
        TABLE 33 Global Beverages Can Market - Company Revenue Analysis 2016-2019 (USD Billion)
        TABLE 34 Global Beverages Can Market - Company Revenue Share Analysis 2016-2019(%)
        TABLE 35 Global Beverages Can Market - Company Volume Analysis 2016-2019 (Billion Units)
        TABLE 36 Global Beverages Can Market - Company Volume Share Analysis 2016-2019(%)
        TABLE 37 Acquisitions and Mergers
        TABLE 38 New Product/Service Launch
        TABLE 39 Research & Development Activities
        TABLE 40 Market Drivers
        TABLE 41 Market Restraints
        TABLE 42 Market Opportunities
        TABLE 43 Production Base and Market Concentration Rate of Raw Material
        TABLE 44 Key Suppliers of Raw Materials
        TABLE 45 Raw Materials Sources of Beverages Can Major Manufacturers in 2016
        TABLE 46 Major Buyers of Beverages Can
        TABLE 47 Distributors/Traders of Beverages Can by Region
        

Industry Major Market Players

  •  Schott Glaswerke AG
  •  Edmund Optics
  •  Ohara Corporation
  •  Hoya Corporation
  •  CORNING
  •  CDGM Glass Company
  •  Nikon Corporation