![]()
Search Market Research Report
Banking BPS Market Size, Share Global Analysis Report, 2018 – 2027

Banking BPS Market By Service (Core Banking BPS, Securities Processing BPS, Mortgage & Loan BPS, and Payment Services BPS) and By Operations (Front Office, Back Office, and Middle Office): Global Industry Perspective, Comprehensive Analysis, and Forecast 2018 – 2027
Industry Insights
The report covers the forecast and analysis of the banking BPS market on a global and regional level. The study provides historical data from 2015 to 2018 along with a forecast from 2019 to 2027 based on revenue (USD Million). The study includes drivers and restraints of the banking BPS market along with the impact they have on the demand over the forecast period. Additionally, the report includes the study of opportunities available in the banking BPS market on a global level.
In order to give the users of this report a comprehensive view of the treasury software market, we have included a competitive landscape and an analysis of Porter’s Five Forces model for the market. The study encompasses a market attractiveness analysis, wherein all the segments are benchmarked based on their market size, growth rate, and general attractiveness.
The report provides a company market share analysis to give a broader overview of the key players in the market. In addition, the report also covers key strategic developments of the market including acquisitions & mergers, new service launches, agreements, partnerships, collaborations & joint ventures, research & development, and regional expansion of major participants involved in the market on a global and regional basis.
The study provides a decisive view of the banking BPS market by segmenting the market based on the service, operations, and regions. All the segments have been analyzed based on present and future trends and the market is estimated from 2019 to 2027. The regional segmentation includes the current and forecast demand for North America, Europe, Asia Pacific, Latin America, and the Middle East and Africa.
The inflation witnessed in the working population, a bulge in the disposable income, and a prominent surge in the personal finance & housing activities coupled with an increase in the penetration of ATM is set to spur the expansion of the banking BPS industry over the forecast timespan. Nevertheless, a mounting number of cybercrime and cyber-attacks are predicted to decimate the expansion of the banking BPS industry over the forecast timeline. However, technological breakthroughs can create lucrative growth avenues for the market over the forecast timeline and help in countering the negative impact of the hindrances on the overall industry progress.
On the basis of service, the industry is sectored into Core Banking BPS, Securities Processing BPS, Mortgage & Loan BPS, and Payment Services BPS. In terms of operations, the market is classified into Front Office, Back Office, and Middle Office.
 Report Scope
Report Attribute |
Details |
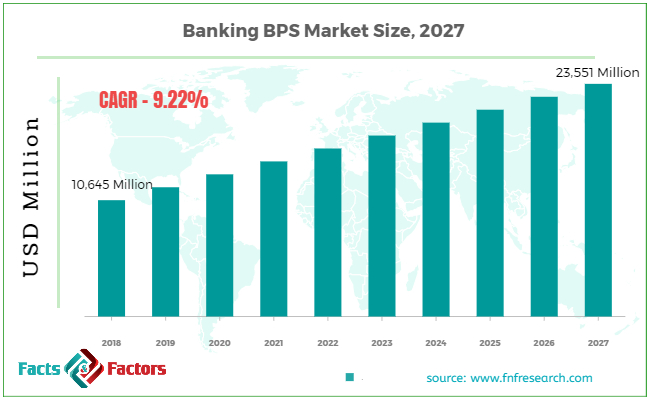
Market Size in 2018 |
USD 10,645 Million |
Projected Market Size in 2027 |
USD 23,551 Million |
CAGR Growth Rate |
9.22% CAGR |
Base Year |
2018 |
Forecast Years |
2018-2027 |
Key Market Players |
Atos, Tata BSS, Wipro, Avaloq, Cognizant, Genpact, NIIT, WNS, Concentrix, HCL Tech, Hexaware Technologies, FIS, Infosys, Capgemini, and SLK. |
Key Segment |
By Service, By Operations, By Region |
Major Regions Covered |
North America, Europe, Asia Pacific, Latin America, and the Middle East & Africa |
Purchase Options |
Request customized purchase options to meet your research needs. Explore purchase options |
Some of the key players in the market include
- Atos
- Tata BSS
- Wipro
- Avaloq
- Cognizant
- Genpact
- NIIT
- WNS
- Concentrix
- HCL Tech
- Hexaware Technologies
- FIS
- Infosys
- Capgemini
- SLK
This report segments the Banking BPS market as follows:
Global Banking BPS Market: By Service Segment Analysis
- Core Banking BPS
- Securities Processing BPS
- Portfolio Services BPS
- Trade Services BPS
- Mortgage & Loan BPS
- Origination Services BPS
- Mortgage and Loan BPS
- Administration BPS
- Payment Services BPS
- Cheque Processing BPS
- Credit Card Processing BPS
- EFT Services BPS
By Operations Segment Analysis
- Front Office
- Customer Management Services
- Document Management
- Sales and Marketing Outsourcing
- Back Office
- F&A Outsourcing
- Procurement
- Middle Office
- Insurance BPS
- Banking BPS
- Healthcare Providers BPS
Regional Segment Analysis
- North America
- U.S.
- Europe
- UK
- France
- Germany
- Asia Pacific
- China
- Japan
- India
- Latin America
- Brazil
- Middle East and Africa
Table of Content
Industry Major Market Players
- Atos
- Tata BSS
- Wipro
- Avaloq
- Cognizant
- Genpact
- NIIT
- WNS
- Concentrix
- HCL Tech
- Hexaware Technologies
- FIS
- Infosys
- Capgemini
- SLK


Copyright © 2025 - 2026, All Rights Reserved, Facts and Factors