Search Market Research Report

Discover Our Latest Reports
Discover Our Featured Reports
Discover Top Selling Reports

Away from Home Hand Soaps and Sanitizer Market Size, Share Global Analysis Report, 2020–2026

report img

Away from Home Hand Soaps and Sanitizer Market By Type (Soap, and Sanitizer), By Sales Channel (Online, and Offline), and By End Use (Ho-Re-Ca(Hotel Restaurants Cafes), Hospitals, Commercial, and Others): Global Industry Outlook, Market Size, Business Intelligence, Consumer Preferences, Statistical Surveys, Comprehensive Analysis, Historical Developments, Current Trends, and Forecast 2020–2026

Industry Insights

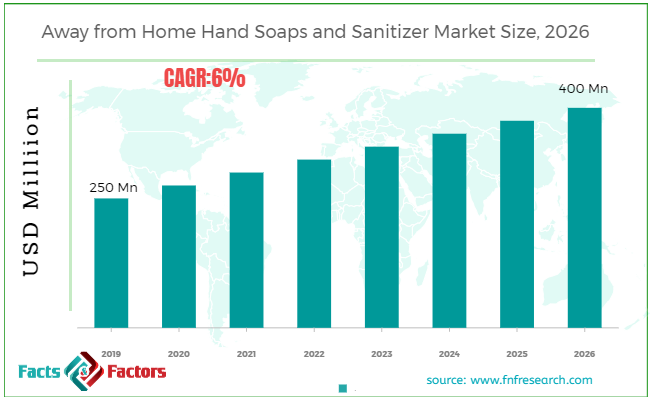
[175+ Pages Report] According to the report published by Facts Factors, the global away from home hand soaps and sanitizer market size was worth around USD 250 million in 2019 and is predicted to grow to around USD 400 million by 2026 with a compound annual growth rate (CAGR) of roughly 6% between 2019 and 2026. The report analyzes the global away from home hand soaps and sanitizer market drivers, restraints/challenges, and the effect they have on the demands during the projection period. In addition, the report explores emerging opportunities in the away from home hand soaps and sanitizer market.

The away from home hand soaps and sanitizer market report analyzes and notifies the industry statistics at the global as well as regional and country levels in order to acquire a thorough perspective of the entire Away from Home Hand Soaps and Sanitizer market. The historical and past insights are provided for FY 2016 to FY 2019 whereas projected trends are delivered for FY 2020 to FY 2026. The quantitative and numerical data is represented in terms of both volume (K Units) and value (USD Million) from FY 2016 – 2026.

Away from Home Hand Soaps and Sanitizer Market Size

To know more about this report | Request Free Sample Copy


logoKey Insights from Primary Research

  • On the basis of end-user segmentation, the “Hospitals” category contributed the projected share at more than 40%, in 2019.
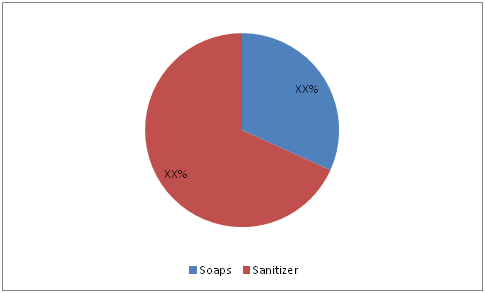
  • The “Sanitizer” category, on the basis of type segmentation, was the prominent revenue-generating category accounting for around 60% share, in 2019.
  • Our projected forecast elaborates that the global away from home hand soaps and sanitizer market is likely to reach around USD 400 Million by 2026.
  • According to our primary respondents, the global away from home hand soaps and sanitizer market is projected to grow per annum at a rate of around 6%.

logoKey Recommendations from Analysts

  • As per our analysts, an innovative packaging solution and dispensers with minimal human contact for hand sanitizers and liquid soap is estimated to fetch lucrative demand in the forthcoming time.
  • Alcohol-based hand sanitizers are having a negative impact on the hands. Due to this end, buyers may shift to emollient-based non-alcoholic hand sanitizers or other substitute options. The shift of consumers to substitute products may hinder the growth of the most common alcohol sanitizers in the forecasted period.
  • Our analysts have recognized “Saniitizer” and “Hospitals & Healthcare Centers” groups as the prominent profit options for global away from home hand soaps and sanitizer.
  • The COVID-19 pandemic has surged the demand for hand sanitizers and soap The coronavirus is the virus with the protein layer outside sanitizer and soap breaking that lipid layer to remove the virus.

logoAway From Home Hand Soaps And Sanitizer Market Share – By End-User

Away from Home Hand Soaps and Sanitizer Market

To know more about this report | Request Free Sample Copy


The quantitative data is further underlined and reinforced by comprehensive qualitative data which comprises various across-the-board market dynamics. The rationales which directly or indirectly impact the Away from Home Hand Soaps and Sanitizer industry are exemplified through parameters such as growth drivers, restraints, challenges, and opportunities among other impacting factors.

Throughout our research report, we have encompassed all the proven models and tools of industry analysis and extensively illustrated all the key business strategies and business models adopted in the Away from Home Hand Soaps and Sanitizer industry. The report provides an all-inclusive and detailed competitive landscape prevalent in the Away from Home Hand Soaps and Sanitizer market.

The report utilizes established industry analysis tools and models such as Porter’s Five Forces framework to analyze and recognize critical business strategies adopted by various stakeholders involved in the entire value chain of the Away from Home Hand Soaps and Sanitizer industry. The Away from Home Hand Soaps and Sanitizer market report additionally employs SWOT analysis and PESTLE analysis models for further in-depth analysis.

The report study further includes an in-depth analysis of industry players' market shares and provides an overview of leading players' market position in the Away from Home Hand Soaps and Sanitizer sector. Key strategic developments in the Away from Home Hand Soaps and Sanitizer market competitive landscape such as acquisitions & mergers, inaugurations of different products and services, partnerships & joint ventures, MoU agreements, VC & funding activities, R&D activities, and geographic expansion among other noteworthy activities by key players of the Away from Home Hand Soaps and Sanitizer market are appropriately highlighted in the report.

The Away from Home Hand Soaps and Sanitizer market research report delivers an acute valuation and taxonomy of the Away from Home Hand Soaps and Sanitizer industry by practically splitting the market on the basis of different types, applications, and regions. Through the analysis of the historical and projected trends, all the segments and sub-segments were evaluated through the bottom-up approach, and different market sizes have been projected for FY 2020 to FY 2026.

logoReport Scope

Report Attribute

Details

Market Size in 2019

USD 250 Million

Projected Market Size in 2026

USD 400 Million

CAGR Growth Rate

6% CAGR

Base Year

2019

Forecast Years

2020-2026

Key Market Players

SHenkel Corporation, BODE Chemie GmbH, Ecolab, Reckitt Benckiser Group, HAGLEITNER, Gojo, Phagogène (Christeyns), MP Hygiene, Deb Group, PZ Cussons, Baylis & Harding, Kimberly Clark, Proeco Quimicas, Sanilec, Dr. Schumacher GmbH, orochemie GmbH + Co. KG, CCM GMBH, Sagrotan, Tana Chemie, Wyritol ( PROVEN ), Techniclean, Saraya Co. Ltd., Lancopharm Cleenol, Selden Research, Kutol Products Company, Carex, Katrin, Cuticura, Vi-Jon Laboratories Inc., Garnier, Rubella, Rentokil Initial, Angelini Pharma, Mirius, Diversey, Inc, The Himalaya Drug Company, Essity, QUIMXEL, DYDSA, DISARP SA, VIJUSA, Proquimia s.a., Eurosanex, and Euroquimica., and Others

Key Segment

By Type, Sales, End-User, and Region

Major Regions Covered

North America, Europe, Asia Pacific, Latin America, and the Middle East & Africa

Purchase Options

Request customized purchase options to meet your research needs. Explore purchase options

The regional segmentation of the Away from Home Hand Soaps and Sanitizer industry includes the complete classification of all the major continents including North America, Latin America, Europe, Asia Pacific, and the Middle East & Africa. Further, country-wise data for the Away from Home Hand Soaps and Sanitizer industry is provided for the leading economies of the world.

The away from home hand soaps and sanitizer market is segmented based on type, sales channel, and end use.  On the basis of type segmentation, the market is classified into soap, and sanitizer. In terms of sales channel segmentation, the market is bifurcated into online, and offline. Based on the end user the market is bifurcated into Ho-Re-Ca(Hotel Restaurants Cafes), hospitals, commercial, and others.

logoSome of the essential players operating in the Away from Home Hand Soaps and Sanitizer market, but not restricted to include

  •  Henkel Corporation
  •  BODE Chemie GmbH
  •  Ecolab
  •  Reckitt Benckiser Group
  •  HAGLEITNER
  •  Gojo
  •  Phagogène (Christeyns)
  •  MP Hygiene
  •  Deb Group
  •  PZ Cussons
  •  Baylis & Harding
  •  Kimberly Clark
  •  Proeco Quimicas
  •  Sanilec
  •  Dr. Schumacher GmbH
  •  orochemie GmbH + Co. KG
  •  CCM GMBH
  •  Sagrotan
  •  Tana Chemie
  •  Wyritol ( PROVEN )
  •  Techniclean
  •  Saraya Co. Ltd.
  •  Lancopharm        Cleenol
  •  Selden Research

The taxonomy of the Away from Home Hand Soaps and Sanitizer industry by its scope and segmentation is as follows:

logo By Type Segmentation Analysis (Customizable)

  • Soap
  • Sanitizer

logo By Sales Channel Segmentation Analysis (Customizable)

  • Online
  • Offline

logo By End-User Segmentation Analysis (Customizable)

  • Ho-Re-Ca(Hotel Restaurants Cafes)
  • Hospitals
  • Commercial
  • Others

logo Regional Segmentation Analysis (Customizable)

  • North America
    • The U.S.
    • Canada
  • Europe
    • Germany
    • The UK
    • France
    • Spain
    • Italy
    • Rest of Europe
  • Asia Pacific
    • China
    • Japan
    • India
    • South Korea
    • Southeast Asia
    • Rest of Asia Pacific
  • Latin America
    • Brazil
    • Mexico
    • Rest of Latin America
  • Middle East & Africa
    • GCC
    • South Africa
    • Rest of Middle East & Africa

Table of Content

  1. Chapter 1 Executive Summary
    1. 1.1. Introduction of Away From Home Hand Soaps and Sanitizer
    2. 1.2. Global Away From Home Hand Soaps and Sanitizer Market, 2019 & 2026 (USD Million)
    3. 1.3. Global Away From Home Hand Soaps and Sanitizer Market, 2016 – 2026 (USD Million) (K Units)
    4. 1.4. Global Away From Home Hand Soaps and Sanitizer Market Absolute Revenue Opportunity, 2016 – 2026 (USD Million)
    5. 1.5. Global Away From Home Hand Soaps and Sanitizer Market Incremental Revenue Opportunity, 2020 – 2026 (USD Million)
  2. Chapter 2 Away From Home Hand Soaps and Sanitizer Market – Type Analysis
    1. 2.1. Global Away From Home Hand Soaps and Sanitizer Market – Type Overview
    2. 2.2. Global Away From Home Hand Soaps and Sanitizer Market Share, by Type, 2019 & 2026 (USD Million)
    3. 2.3. Global Away From Home Hand Soaps and Sanitizer Market share, by Type, 2019 & 2026 (K Units)
    4. 2.4. Soap
      1. 2.4.1. Global Soap Away From Home Hand Soaps and Sanitizer Market, 2016 – 2026 (USD Million)
      2. 2.4.2. Global Soap Away From Home Hand Soaps and Sanitizer Market, 2016 – 2026 (K Units)
    5. 2.5. Sanitizer
      1. 2.5.1. Global Sanitizer Away From Home Hand Soaps and Sanitizer Market, 2016 – 2026 (USD Million)
      2. 2.5.2. Global Sanitizer Away From Home Hand Soaps and Sanitizer Market, 2016 – 2026 (K Units)
  3. Chapter 3 Away From Home Hand Soaps and Sanitizer Market – Sales Channel Analysis
    1. 3.1. Global Away From Home Hand Soaps and Sanitizer Market – Sales Channel Overview
    2. 3.2. Global Away From Home Hand Soaps and Sanitizer Market Share, by Sales Channel, 2019 & 2026 (USD Million)
    3. 3.3. Global Away From Home Hand Soaps and Sanitizer Market share, by Sales Channel, 2019 & 2026 (K Units)
    4. 3.4. Online
      1. 3.4.1. Global Online Away From Home Hand Soaps and Sanitizer Market, 2016 – 2026 (USD Million)
      2. 3.4.2. Global Online Away From Home Hand Soaps and Sanitizer Market, 2016 – 2026 (K Units)
    5. 3.5. Offline
      1. 3.5.1. Global Offline Away From Home Hand Soaps and Sanitizer Market, 2016 – 2026 (USD Million)
      2. 3.5.2. Global Offline Away From Home Hand Soaps and Sanitizer Market, 2016 – 2026 (K Units)
  4. Chapter 4 Away From Home Hand Soaps and Sanitizer Market – End Use Analysis
    1. 4.1. Global Away From Home Hand Soaps and Sanitizer Market – End Use Overview
    2. 4.2. Global Away From Home Hand Soaps and Sanitizer Market Share, by End Use, 2019 & 2026 (USD Million)
    3. 4.3. Global Away From Home Hand Soaps and Sanitizer Market share, by End Use, 2019 & 2026 (K Units)
    4. 4.4. Ho-Re-Ca (Hotel Restaurants Cafes)
      1. 4.4.1. Global Ho-Re-Ca (Hotel Restaurants Cafes) Away From Home Hand Soaps and Sanitizer Market, 2016 – 2026 (USD Million)
      2. 4.4.2. Global Ho-Re-Ca (Hotel Restaurants Cafes) Away From Home Hand Soaps and Sanitizer Market, 2016 – 2026 (K Units)
    5. 4.5. Hospitals
      1. 4.5.1. Global Hospitals Away From Home Hand Soaps and Sanitizer Market, 2016 – 2026 (USD Million)
      2. 4.5.2. Global Hospitals Away From Home Hand Soaps and Sanitizer Market, 2016 – 2026 (K Units)
    6. 4.6. Commercial
      1. 4.6.1. Global Commercial Away From Home Hand Soaps and Sanitizer Market, 2016 – 2026 (USD Million)
      2. 4.6.2. Global Commercial Away From Home Hand Soaps and Sanitizer Market, 2016 – 2026 (K Units)
    7. 4.7. Others
      1. 4.7.1. Global Others Away From Home Hand Soaps and Sanitizer Market, 2016 – 2026 (USD Million)
      2. 4.7.2. Global Others Away From Home Hand Soaps and Sanitizer Market, 2016 – 2026 (K Units)
  5. Chapter 5 Away From Home Hand Soaps and Sanitizer Market – Regional Analysis
    1. 5.1. Global Away From Home Hand Soaps and Sanitizer Market Regional Overview
    2. 5.2. Global Away From Home Hand Soaps and Sanitizer Market Share, by Region, 2019 & 2026 (USD Million)
    3. 5.3. Global Away From Home Hand Soaps and Sanitizer Market Share, by Region, 2019 & 2026 (K Units)
    4. 5.4. North America
      1. 5.4.1. North America Away From Home Hand Soaps and Sanitizer Market, 2016 – 2026 (USD Million)
        1. 5.4.1.1. North America Away From Home Hand Soaps and Sanitizer Market, by Country, 2016 – 2026 (USD Million)
      2. 5.4.2. North America Market, 2016 – 2026 (K Units)
        1. 5.4.2.1. North America Away From Home Hand Soaps and Sanitizer Market, by Country, 2016 – 2026 (K Units)
      3. 5.4.3. North America Away From Home Hand Soaps and Sanitizer Market, by Type, 2016 – 2026
        1. 5.4.3.1. North America Away From Home Hand Soaps and Sanitizer Market, by Type, 2016 – 2026 (USD Million)
        2. 5.4.3.2. North America Away From Home Hand Soaps and Sanitizer Market, by Type, 2016 – 2026 (K Units)
      4. 5.4.4. North America Away From Home Hand Soaps and Sanitizer Market, by Sales Channel, 2016 – 2026
        1. 5.4.4.1. North America Away From Home Hand Soaps and Sanitizer Market, by Sales Channel, 2016 – 2026 (USD Million)
        2. 5.4.4.2. North America Away From Home Hand Soaps and Sanitizer Market, by Sales Channel, 2016 – 2026 (K Units)
      5. 5.4.5. North America Away From Home Hand Soaps and Sanitizer Market, by End Use, 2016 – 2026
        1. 5.4.5.1. North America Away From Home Hand Soaps and Sanitizer Market, by End Use, 2016 – 2026 (USD Million)
        2. 5.4.5.2. North America Away From Home Hand Soaps and Sanitizer Market, by End Use, 2016 – 2026 (K Units)
      6. 5.4.6. U.S.
        1. 5.4.6.1. U.S. Away From Home Hand Soaps and Sanitizer Market, 2016 – 2026 (USD Million)
        2. 5.4.6.2. U.S. Away From Home Hand Soaps and Sanitizer Market, 2016 – 2026 (K Units)
      7. 5.4.7. Canada
        1. 5.4.7.1. Canada Away From Home Hand Soaps and Sanitizer Market, 2016 – 2026 (USD Million)
        2. 5.4.7.2. Canada Away From Home Hand Soaps and Sanitizer Market, 2016 – 2026 (K Units)
    5. 5.5. Europe
      1. 5.5.1. Europe Away From Home Hand Soaps and Sanitizer Market, 2016 – 2026 (USD Million)
        1. 5.5.1.1. Europe Away From Home Hand Soaps and Sanitizer Market, by Country, 2016 – 2026 (USD Million)
      2. 5.5.2. Europe Market, 2016 – 2026 (K Units)
        1. 5.5.2.1. Europe Away From Home Hand Soaps and Sanitizer Market, by Country, 2016 – 2026 (K Units)
      3. 5.5.3. Europe Away From Home Hand Soaps and Sanitizer Market, by Type, 2016 – 2026
        1. 5.5.3.1. Europe Away From Home Hand Soaps and Sanitizer Market, by Type, 2016 – 2026 (USD Million)
        2. 5.5.3.2. Europe Away From Home Hand Soaps and Sanitizer Market, by Type, 2016 – 2026 (K Units)
      4. 5.5.4. Europe Away From Home Hand Soaps and Sanitizer Market, by Sales Channel, 2016 – 2026
        1. 5.5.4.1. Europe Away From Home Hand Soaps and Sanitizer Market, by Sales Channel, 2016 – 2026 (USD Million)
        2. 5.5.4.2. Europe Away From Home Hand Soaps and Sanitizer Market, by Sales Channel, 2016 – 2026 (K Units)
      5. 5.5.5. Europe Away From Home Hand Soaps and Sanitizer Market, by End Use, 2016 – 2026
        1. 5.5.5.1. Europe Away From Home Hand Soaps and Sanitizer Market, by End Use, 2016 – 2026 (USD Million)
        2. 5.5.5.2. Europe Away From Home Hand Soaps and Sanitizer Market, by End Use, 2016 – 2026 (K Units)
      6. 5.5.6. Germany
        1. 5.5.6.1. Germany Away From Home Hand Soaps and Sanitizer Market, 2016 – 2026 (USD Million)
        2. 5.5.6.2. Germany Away From Home Hand Soaps and Sanitizer Market, 2016 – 2026 (K Units)
      7. 5.5.7. France
        1. 5.5.7.1. France Away From Home Hand Soaps and Sanitizer Market, 2016 – 2026 (USD Million)
        2. 5.5.7.2. France Away From Home Hand Soaps and Sanitizer Market, 2016 – 2026 (K Units)
      8. 5.5.8. U.K.
        1. 5.5.8.1. U.K. Away From Home Hand Soaps and Sanitizer Market, 2016 – 2026 (USD Million)
        2. 5.5.8.2. U.K. Away From Home Hand Soaps and Sanitizer Market, 2016 – 2026 (K Units)
      9. 5.5.9. Italy
        1. 5.5.9.1. Italy Away From Home Hand Soaps and Sanitizer Market, 2016 – 2026 (USD Million)
        2. 5.5.9.2. Italy Away From Home Hand Soaps and Sanitizer Market, 2016 – 2026 (K Units)
      10. 5.5.10. Spain
        1. 5.5.10.1. Spain Away From Home Hand Soaps and Sanitizer Market, 2016 – 2026 (USD Million)
        2. 5.5.10.2. Spain Away From Home Hand Soaps and Sanitizer Market, 2016 – 2026 (K Units)
      11. 5.5.11. Rest of Europe
        1. 5.5.11.1. Rest of Europe Away From Home Hand Soaps and Sanitizer Market, 2016 – 2026 (USD Million)
        2. 5.5.11.2. Rest of Europe Away From Home Hand Soaps and Sanitizer Market, 2016 – 2026 (K Units)
    6. 5.6. Asia Pacific
      1. 5.6.1. Asia Pacific Away From Home Hand Soaps and Sanitizer Market, 2016 – 2026 (USD Million)
        1. 5.6.1.1. Asia Pacific Away From Home Hand Soaps and Sanitizer Market, by Country, 2016 – 2026 (USD Million)
      2. 5.6.2. Asia Pacific Market, 2016 – 2026 (K Units)
        1. 5.6.2.1. Asia Pacific Away From Home Hand Soaps and Sanitizer Market, by Country, 2016 – 2026 (K Units)
      3. 5.6.3. Asia Pacific Away From Home Hand Soaps and Sanitizer Market, by Type, 2016 – 2026
        1. 5.6.3.1. Asia Pacific Away From Home Hand Soaps and Sanitizer Market, by Type, 2016 – 2026 (USD Million)
        2. 5.6.3.2. Asia Pacific Away From Home Hand Soaps and Sanitizer Market, by Type, 2016 – 2026 (K Units)
      4. 5.6.4. Asia Pacific Away From Home Hand Soaps and Sanitizer Market, by Sales Channel, 2016 – 2026
        1. 5.6.4.1. Asia Pacific Away From Home Hand Soaps and Sanitizer Market, by Sales Channel, 2016 – 2026 (USD Million)
        2. 5.6.4.2. Asia Pacific Away From Home Hand Soaps and Sanitizer Market, by Sales Channel, 2016 – 2026 (K Units)
      5. 5.6.5. Asia Pacific Away From Home Hand Soaps and Sanitizer Market, by End Use, 2016 – 2026
        1. 5.6.5.1. Asia Pacific Away From Home Hand Soaps and Sanitizer Market, by End Use, 2016 – 2026 (USD Million)
        2. 5.6.5.2. Asia Pacific Away From Home Hand Soaps and Sanitizer Market, by End Use, 2016 – 2026 (K Units)
      6. 5.6.6. China
        1. 5.6.6.1. China Away From Home Hand Soaps and Sanitizer Market, 2016 – 2026 (USD Million)
        2. 5.6.6.2. China Away From Home Hand Soaps and Sanitizer Market, 2016 – 2026 (K Units)
      7. 5.6.7. Japan
        1. 5.6.7.1. Japan Away From Home Hand Soaps and Sanitizer Market, 2016 – 2026 (USD Million)
        2. 5.6.7.2. Japan Away From Home Hand Soaps and Sanitizer Market, 2016 – 2026 (K Units)
      8. 5.6.8. India
        1. 5.6.8.1. India Away From Home Hand Soaps and Sanitizer Market, 2016 – 2026 (USD Million)
        2. 5.6.8.2. India Away From Home Hand Soaps and Sanitizer Market, 2016 – 2026 (K Units)
      9. 5.6.9. South Korea
        1. 5.6.9.1. South Korea Away From Home Hand Soaps and Sanitizer Market, 2016 – 2026 (USD Million)
        2. 5.6.9.2. South Korea Away From Home Hand Soaps and Sanitizer Market, 2016 – 2026 (K Units)
      10. 5.6.10. South-East Asia
        1. 5.6.10.1. South-East Asia Away From Home Hand Soaps and Sanitizer Market, 2016 – 2026 (USD Million)
        2. 5.6.10.2. South-East Asia Away From Home Hand Soaps and Sanitizer Market, 2016 – 2026 (K Units)
      11. 5.6.11. Rest of Asia Pacific
        1. 5.6.11.1. Rest of Asia Pacific Away From Home Hand Soaps and Sanitizer Market, 2016 – 2026 (USD Million)
        2. 5.6.11.2. Rest of Asia Pacific Away From Home Hand Soaps and Sanitizer Market, 2016 – 2026 (K Units)
    7. 5.7. Latin America
      1. 5.7.1. Latin America Away From Home Hand Soaps and Sanitizer Market, 2016 – 2026 (USD Million)
        1. 5.7.1.1. Latin America Away From Home Hand Soaps and Sanitizer Market, by Country, 2016 – 2026 (USD Million)
      2. 5.7.2. Latin America Market, 2016 – 2026 (K Units)
        1. 5.7.2.1. Latin America Away From Home Hand Soaps and Sanitizer Market, by Country, 2016 – 2026 (K Units)
      3. 5.7.3. Latin America Away From Home Hand Soaps and Sanitizer Market, by Type, 2016 – 2026
        1. 5.7.3.1. Latin America Away From Home Hand Soaps and Sanitizer Market, by Type, 2016 – 2026 (USD Million)
        2. 5.7.3.2. Latin America Away From Home Hand Soaps and Sanitizer Market, by Type, 2016 – 2026 (K Units)
      4. 5.7.4. Latin America Away From Home Hand Soaps and Sanitizer Market, by Sales Channel, 2016 – 2026
        1. 5.7.4.1. Latin America Away From Home Hand Soaps and Sanitizer Market, by Sales Channel, 2016 – 2026 (USD Million)
        2. 5.7.4.2. Latin America Away From Home Hand Soaps and Sanitizer Market, by Sales Channel, 2016 – 2026 (K Units)
      5. 5.7.5. Latin America Away From Home Hand Soaps and Sanitizer Market, by End Use, 2016 – 2026
        1. 5.7.5.1. Latin America Away From Home Hand Soaps and Sanitizer Market, by End Use, 2016 – 2026 (USD Million)
        2. 5.7.5.2. Latin America Away From Home Hand Soaps and Sanitizer Market, by End Use, 2016 – 2026 (K Units)
      6. 5.7.6. Brazil
        1. 5.7.6.1. Brazil Away From Home Hand Soaps and Sanitizer Market, 2016 – 2026 (USD Million)
        2. 5.7.6.2. Brazil Away From Home Hand Soaps and Sanitizer Market, 2016 – 2026 (K Units)
      7. 5.7.7. Mexico
        1. 5.7.7.1. Mexico Away From Home Hand Soaps and Sanitizer Market, 2016 – 2026 (USD Million)
        2. 5.7.7.2. Mexico Away From Home Hand Soaps and Sanitizer Market, 2016 – 2026 (K Units)
      8. 5.7.8. Rest of Latin America
        1. 5.7.8.1. Rest of Latin America Away From Home Hand Soaps and Sanitizer Market, 2016 – 2026 (USD Million)
        2. 5.7.8.2. Rest of Latin America Away From Home Hand Soaps and Sanitizer Market, 2016 – 2026 (K Units)
    8. 5.8. The Middle-East and Africa
      1. 5.8.1. The Middle-East and Africa Away From Home Hand Soaps and Sanitizer Market, 2016 – 2026 (USD Million)
        1. 5.8.1.1. The Middle-East and Africa Away From Home Hand Soaps and Sanitizer Market, by Country, 2016 – 2026 (USD Million)
      2. 5.8.2. The Middle-East and Africa Market, 2016 – 2026 (K Units)
        1. 5.8.2.1. The Middle-East and Africa Away From Home Hand Soaps and Sanitizer Market, by Country, 2016 – 2026 (K Units)
      3. 5.8.3. The Middle-East and Africa Away From Home Hand Soaps and Sanitizer Market, by Type, 2016 – 2026
        1. 5.8.3.1. The Middle-East and Africa Away From Home Hand Soaps and Sanitizer Market, by Type, 2016 – 2026 (USD Million)
        2. 5.8.3.2. The Middle-East and Africa Away From Home Hand Soaps and Sanitizer Market, by Type, 2016 – 2026 (K Units)
      4. 5.8.4. The Middle-East and Africa Away From Home Hand Soaps and Sanitizer Market, by Sales Channel, 2016 – 2026
        1. 5.8.4.1. The Middle-East and Africa Away From Home Hand Soaps and Sanitizer Market, by Sales Channel, 2016 – 2026 (USD Million)
        2. 5.8.4.2. The Middle-East and Africa Away From Home Hand Soaps and Sanitizer Market, by Sales Channel, 2016 – 2026 (K Units)
      5. 5.8.5. The Middle-East and Africa Away From Home Hand Soaps and Sanitizer Market, by End Use, 2016 – 2026
        1. 5.8.5.1. The Middle-East and Africa Away From Home Hand Soaps and Sanitizer Market, by End Use, 2016 – 2026 (USD Million)
        2. 5.8.5.2. The Middle-East and Africa Away From Home Hand Soaps and Sanitizer Market, by End Use, 2016 – 2026 (K Units)
      6. 5.8.6. GCC Countries
        1. 5.8.6.1. GCC Countries Away From Home Hand Soaps and Sanitizer Market, 2016 – 2026 (USD Million)
        2. 5.8.6.2. GCC Countries Away From Home Hand Soaps and Sanitizer Market, 2016 – 2026 (K Units)
      7. 5.8.7. South Africa
        1. 5.8.7.1. South Africa Away From Home Hand Soaps and Sanitizer Market, 2016 – 2026 (USD Million)
        2. 5.8.7.2. South Africa Away From Home Hand Soaps and Sanitizer Market, 2016 – 2026 (K Units)
      8. 5.8.8. Rest of Middle-East Africa
        1. 5.8.8.1. Rest of Middle-East Africa Away From Home Hand Soaps and Sanitizer Market, 2016 – 2026 (USD Million)
        2. 5.8.8.2. Rest of Middle-East Africa Away From Home Hand Soaps and Sanitizer Market, 2016 – 2026 (K Units)
  6. Chapter 6 Away From Home Hand Soaps and Sanitizer Production, Consumption, Export, Import by Regions
    1. 6.1. Global Away From Home Hand Soaps and Sanitizer Production and Consumption, 2016 – 2026 (K Units)
    2. 6.2. Global Import and Export Analysis, by Region
  7. Chapter 7 Away From Home Hand Soaps and Sanitizer Market – Competitive Landscape
    1. 7.1. Competitor Market Share – Revenue
    2. 7.2. Market Concentration Rate Analysis, Top 3 and Top 5 Players
    3. 7.3. Competitor Market Share – Volume
    4. 7.4. Strategic Developments
      1. 7.4.1. Acquisitions and Mergers
      2. 7.4.2. New Products
      3. 7.4.3. Research & Development Activities
  8. Chapter 8 Company Profiles
    1. 8.1. Henkel Corporation
      1. 8.1.1. Company Overview
      2. 8.1.2. Product/Service Portfolio
      3. 8.1.3. Henkel Corporation Sales, Revenue, Price, and Gross Margin
      4. 8.1.4. Henkel Corporation Revenue and Growth Rate
      5. 8.1.5. Henkel Corporation Market Share
      6. 8.1.6. Recent Initiatives, Funding/VC Activities, and Technological Innovations
    2. 8.2. BODE Chemie GmbH
      1. 8.2.1. Company Overview
      2. 8.2.2. Product/Service Portfolio
      3. 8.2.3. BODE Chemie GmbH Sales, Revenue, Price, and Gross Margin
      4. 8.2.4. BODE Chemie GmbH Revenue and Growth Rate
      5. 8.2.5. BODE Chemie GmbH Market Share
      6. 8.2.6. Recent Initiatives, Funding/VC Activities, and Technological Innovations
    3. 8.3. Ecolab
      1. 8.3.1. Company Overview
      2. 8.3.2. Product/Service Portfolio
      3. 8.3.3. Ecolab Sales, Revenue, Price, and Gross Margin
      4. 8.3.4. Ecolab Revenue and Growth Rate
      5. 8.3.5. Ecolab Market Share
      6. 8.3.6. Recent Initiatives, Funding/VC Activities, and Technological Innovations
    4. 8.4. Reckitt Benckiser Group
      1. 8.4.1. Company Overview
      2. 8.4.2. Product/Service Portfolio
      3. 8.4.3. Reckitt Benckiser Group Sales, Revenue, Price, and Gross Margin
      4. 8.4.4. Reckitt Benckiser Group Revenue and Growth Rate
      5. 8.4.5. Reckitt Benckiser Group Market Share
      6. 8.4.6. Recent Initiatives, Funding/VC Activities, and Technological Innovations
    5. 8.5. HAGLEITNER
      1. 8.5.1. Company Overview
      2. 8.5.2. Product/Service Portfolio
      3. 8.5.3. HAGLEITNER Sales, Revenue, Price, and Gross Margin
      4. 8.5.4. HAGLEITNER Revenue and Growth Rate
      5. 8.5.5. HAGLEITNER Market Share
      6. 8.5.6. Recent Initiatives, Funding/VC Activities, and Technological Innovations
    6. 8.6. Gojo
      1. 8.6.1. Company Overview
      2. 8.6.2. Product/Service Portfolio
      3. 8.6.3. Gojo Sales, Revenue, Price, and Gross Margin
      4. 8.6.4. Gojo Revenue and Growth Rate
      5. 8.6.5. Gojo Market Share
      6. 8.6.6. Recent Initiatives, Funding/VC Activities, and Technological Innovations
    7. 8.7. Phagogène (Christeyns)
      1. 8.7.1. Company Overview
      2. 8.7.2. Product/Service Portfolio
      3. 8.7.3. Phagogène (Christeyns) Sales, Revenue, Price, and Gross Margin
      4. 8.7.4. Phagogène (Christeyns) Revenue and Growth Rate
      5. 8.7.5. Phagogène (Christeyns) Market Share
      6. 8.7.6. Recent Initiatives, Funding/VC Activities, and Technological Innovations
    8. 8.8. MP Hygiene
      1. 8.8.1. Company Overview
      2. 8.8.2. Product/Service Portfolio
      3. 8.8.3. MP Hygiene Sales, Revenue, Price, and Gross Margin
      4. 8.8.4. MP Hygiene Revenue and Growth Rate
      5. 8.8.5. MP Hygiene Market Share
      6. 8.8.6. Recent Initiatives, Funding/VC Activities, and Technological Innovations
    9. 8.9. Deb Group
      1. 8.9.1. Company Overview
      2. 8.9.2. Product/Service Portfolio
      3. 8.9.3. Deb Group Sales, Revenue, Price, and Gross Margin
      4. 8.9.4. Deb Group Revenue and Growth Rate
      5. 8.9.5. Deb Group Market Share
      6. 8.9.6. Recent Initiatives, Funding/VC Activities, and Technological Innovations
    10. 8.10. PZ Cussons
      1. 8.10.1. Company Overview
      2. 8.10.2. Product/Service Portfolio
      3. 8.10.3. PZ Cussons Sales, Revenue, Price, and Gross Margin
      4. 8.10.4. PZ Cussons Revenue and Growth Rate
      5. 8.10.5. PZ Cussons Market Share
      6. 8.10.6. Recent Initiatives, Funding/VC Activities, and Technological Innovations
    11. 8.11. Baylis & Harding
      1. 8.11.1. Company Overview
      2. 8.11.2. Product/Service Portfolio
      3. 8.11.3. Baylis & Harding Sales, Revenue, Price, and Gross Margin
      4. 8.11.4. Baylis & Harding Revenue and Growth Rate
      5. 8.11.5. Baylis & Harding Market Share
      6. 8.11.6. Recent Initiatives, Funding/VC Activities, and Technological Innovations
    12. 8.12. Kimberly Clark
      1. 8.12.1. Company Overview
      2. 8.12.2. Product/Service Portfolio
      3. 8.12.3. Kimberly Clark Sales, Revenue, Price, and Gross Margin
      4. 8.12.4. Kimberly Clark Revenue and Growth Rate
      5. 8.12.5. Kimberly Clark Market Share
      6. 8.12.6. Recent Initiatives, Funding/VC Activities, and Technological Innovations
    13. 8.13. Proeco Quimicas
      1. 8.13.1. Company Overview
      2. 8.13.2. Product/Service Portfolio
      3. 8.13.3. Proeco Quimicas Sales, Revenue, Price, and Gross Margin
      4. 8.13.4. Proeco Quimicas Revenue and Growth Rate
      5. 8.13.5. Proeco Quimicas Market Share
      6. 8.13.6. Recent Initiatives, Funding/VC Activities, and Technological Innovations
    14. 8.14. Sanilec
      1. 8.14.1. Company Overview
      2. 8.14.2. Product/Service Portfolio
      3. 8.14.3. Sanilec Sales, Revenue, Price, and Gross Margin
      4. 8.14.4. Sanilec Revenue and Growth Rate
      5. 8.14.5. Sanilec Market Share
      6. 8.14.6. Recent Initiatives, Funding/VC Activities, and Technological Innovations
    15. 8.15. Dr. Schumacher GmbH
      1. 8.15.1. Company Overview
      2. 8.15.2. Product/Service Portfolio
      3. 8.15.3. Dr. Schumacher GmbH Sales, Revenue, Price, and Gross Margin
      4. 8.15.4. Dr. Schumacher GmbH Revenue and Growth Rate
      5. 8.15.5. Dr. Schumacher GmbH Market Share
      6. 8.15.6. Recent Initiatives, Funding/VC Activities, and Technological Innovations
    16. 8.16. orochemie GmbH + Co. KG
      1. 8.16.1. Company Overview
      2. 8.16.2. Product/Service Portfolio
      3. 8.16.3. orochemie GmbH + Co. KG Sales, Revenue, Price, and Gross Margin
      4. 8.16.4. orochemie GmbH + Co. KG Revenue and Growth Rate
      5. 8.16.5. orochemie GmbH + Co. KG Market Share
      6. 8.16.6. Recent Initiatives, Funding/VC Activities, and Technological Innovations
    17. 8.17. CCM GMBH
      1. 8.17.1. Company Overview
      2. 8.17.2. Product/Service Portfolio
      3. 8.17.3. CCM GMBH Sales, Revenue, Price, and Gross Margin
      4. 8.17.4. CCM GMBH Revenue and Growth Rate
      5. 8.17.5. CCM GMBH Market Share
      6. 8.17.6. Recent Initiatives, Funding/VC Activities, and Technological Innovations
    18. 8.18. Sagrotan
      1. 8.18.1. Company Overview
      2. 8.18.2. Product/Service Portfolio
      3. 8.18.3. Sagrotan Sales, Revenue, Price, and Gross Margin
      4. 8.18.4. Sagrotan Revenue and Growth Rate
      5. 8.18.5. Sagrotan Market Share
      6. 8.18.6. Recent Initiatives, Funding/VC Activities, and Technological Innovations
    19. 8.19. Tana Chemie, Wyritol ( PROVEN )
      1. 8.19.1. Company Overview
      2. 8.19.2. Product/Service Portfolio
      3. 8.19.3. Tana Chemie, Wyritol ( PROVEN ) Sales, Revenue, Price, and Gross Margin
      4. 8.19.4. Tana Chemie, Wyritol ( PROVEN ) Revenue and Growth Rate
      5. 8.19.5. Tana Chemie, Wyritol ( PROVEN ) Market Share
      6. 8.19.6. Recent Initiatives, Funding/VC Activities, and Technological Innovations
    20. 8.20. Techniclean, Saraya Co. Ltd.
      1. 8.20.1. Company Overview
      2. 8.20.2. Product/Service Portfolio
      3. 8.20.3. Techniclean, Saraya Co. Ltd. Sales, Revenue, Price, and Gross Margin
      4. 8.20.4. Techniclean, Saraya Co. Ltd. Revenue and Growth Rate
      5. 8.20.5. Techniclean, Saraya Co. Ltd. Market Share
      6. 8.20.6. Recent Initiatives, Funding/VC Activities, and Technological Innovations
    21. 8.21. Lancopharm Cleenol
      1. 8.21.1. Company Overview
      2. 8.21.2. Product/Service Portfolio
      3. 8.21.3. Lancopharm Cleenol Sales, Revenue, Price, and Gross Margin
      4. 8.21.4. Lancopharm Cleenol Revenue and Growth Rate
      5. 8.21.5. Lancopharm Cleenol Market Share
      6. 8.21.6. Recent Initiatives, Funding/VC Activities, and Technological Innovations
    22. 8.22. Selden Research
      1. 8.22.1. Company Overview
      2. 8.22.2. Product/Service Portfolio
      3. 8.22.3. Selden Research Sales, Revenue, Price, and Gross Margin
      4. 8.22.4. Selden Research Revenue and Growth Rate
      5. 8.22.5. Selden Research Market Share
      6. 8.22.6. Recent Initiatives, Funding/VC Activities, and Technological Innovations
    23. 8.23. Kutol Products Company
      1. 8.23.1. Company Overview
      2. 8.23.2. Product/Service Portfolio
      3. 8.23.3. Kutol Products Company Sales, Revenue, Price, and Gross Margin
      4. 8.23.4. Kutol Products Company Revenue and Growth Rate
      5. 8.23.5. Kutol Products Company Market Share
      6. 8.23.6. Recent Initiatives, Funding/VC Activities, and Technological Innovations
    24. 8.24. Carex
      1. 8.24.1. Company Overview
      2. 8.24.2. Product/Service Portfolio
      3. 8.24.3. Carex Sales, Revenue, Price, and Gross Margin
      4. 8.24.4. Carex Revenue and Growth Rate
      5. 8.24.5. Carex Market Share
      6. 8.24.6. Recent Initiatives, Funding/VC Activities, and Technological Innovations
    25. 8.25. Katrin
      1. 8.25.1. Company Overview
      2. 8.25.2. Product/Service Portfolio
      3. 8.25.3. Katrin Sales, Revenue, Price, and Gross Margin
      4. 8.25.4. Katrin Revenue and Growth Rate
      5. 8.25.5. Katrin Market Share
      6. 8.25.6. Recent Initiatives, Funding/VC Activities, and Technological Innovations
    26. 8.26. Cuticura
      1. 8.26.1. Company Overview
      2. 8.26.2. Product/Service Portfolio
      3. 8.26.3. Cuticura Sales, Revenue, Price, and Gross Margin
      4. 8.26.4. Cuticura Revenue and Growth Rate
      5. 8.26.5. Cuticura Market Share
      6. 8.26.6. Recent Initiatives, Funding/VC Activities, and Technological Innovations
    27. 8.27. Vi-Jon Laboratories Inc.
      1. 8.27.1. Company Overview
      2. 8.27.2. Product/Service Portfolio
      3. 8.27.3. Vi-Jon Laboratories Inc. Sales, Revenue, Price, and Gross Margin
      4. 8.27.4. Vi-Jon Laboratories Inc. Revenue and Growth Rate
      5. 8.27.5. Vi-Jon Laboratories Inc. Market Share
      6. 8.27.6. Recent Initiatives, Funding/VC Activities, and Technological Innovations
    28. 8.28. Garnier
      1. 8.28.1. Company Overview
      2. 8.28.2. Product/Service Portfolio
      3. 8.28.3. Garnier Sales, Revenue, Price, and Gross Margin
      4. 8.28.4. Garnier Revenue and Growth Rate
      5. 8.28.5. Garnier Market Share
      6. 8.28.6. Recent Initiatives, Funding/VC Activities, and Technological Innovations
    29. 8.29. Rubella
      1. 8.29.1. Company Overview
      2. 8.29.2. Product/Service Portfolio
      3. 8.29.3. Rubella Sales, Revenue, Price, and Gross Margin
      4. 8.29.4. Rubella Revenue and Growth Rate
      5. 8.29.5. Rubella Market Share
      6. 8.29.6. Recent Initiatives, Funding/VC Activities, and Technological Innovations
    30. 8.30. Rentokil Initial
      1. 8.30.1. Company Overview
      2. 8.30.2. Product/Service Portfolio
      3. 8.30.3. Rentokil Initial Sales, Revenue, Price, and Gross Margin
      4. 8.30.4. Rentokil Initial Revenue and Growth Rate
      5. 8.30.5. Rentokil Initial Market Share
      6. 8.30.6. Recent Initiatives, Funding/VC Activities, and Technological Innovations
    31. 8.31. Angelini Pharma
      1. 8.31.1. Company Overview
      2. 8.31.2. Product/Service Portfolio
      3. 8.31.3. Angelini Pharma Sales, Revenue, Price, and Gross Margin
      4. 8.31.4. Angelini Pharma Revenue and Growth Rate
      5. 8.31.5. Angelini Pharma Market Share
      6. 8.31.6. Recent Initiatives, Funding/VC Activities, and Technological Innovations
    32. 8.32. Mirius
      1. 8.32.1. Company Overview
      2. 8.32.2. Product/Service Portfolio
      3. 8.32.3. Mirius Sales, Revenue, Price, and Gross Margin
      4. 8.32.4. Mirius Revenue and Growth Rate
      5. 8.32.5. Mirius Market Share
      6. 8.32.6. Recent Initiatives, Funding/VC Activities, and Technological Innovations
    33. 8.33. Diversey, Inc
      1. 8.33.1. Company Overview
      2. 8.33.2. Product/Service Portfolio
      3. 8.33.3. Diversey, Inc Sales, Revenue, Price, and Gross Margin
      4. 8.33.4. Diversey, Inc Revenue and Growth Rate
      5. 8.33.5. Diversey, Inc Market Share
      6. 8.33.6. Recent Initiatives, Funding/VC Activities, and Technological Innovations
    34. 8.34. The Himalaya Drug Company
      1. 8.34.1. Company Overview
      2. 8.34.2. Product/Service Portfolio
      3. 8.34.3. The Himalaya Drug Company Sales, Revenue, Price, and Gross Margin
      4. 8.34.4. The Himalaya Drug Company Revenue and Growth Rate
      5. 8.34.5. The Himalaya Drug Company Market Share
      6. 8.34.6. Recent Initiatives, Funding/VC Activities, and Technological Innovations
    35. 8.35. Essity
      1. 8.35.1. Company Overview
      2. 8.35.2. Product/Service Portfolio
      3. 8.35.3. Essity Sales, Revenue, Price, and Gross Margin
      4. 8.35.4. Essity Revenue and Growth Rate
      5. 8.35.5. Essity Market Share
      6. 8.35.6. Recent Initiatives, Funding/VC Activities, and Technological Innovations
    36. 8.36. QUIMXEL
      1. 8.36.1. Company Overview
      2. 8.36.2. Product/Service Portfolio
      3. 8.36.3. QUIMXEL Sales, Revenue, Price, and Gross Margin
      4. 8.36.4. QUIMXEL Revenue and Growth Rate
      5. 8.36.5. QUIMXEL Market Share
      6. 8.36.6. Recent Initiatives, Funding/VC Activities, and Technological Innovations
    37. 8.37. DYDSA
      1. 8.37.1. Company Overview
      2. 8.37.2. Product/Service Portfolio
      3. 8.37.3. DYDSA Sales, Revenue, Price, and Gross Margin
      4. 8.37.4. DYDSA Revenue and Growth Rate
      5. 8.37.5. DYDSA Market Share
      6. 8.37.6. Recent Initiatives, Funding/VC Activities, and Technological Innovations
    38. 8.38. DISARP SA
      1. 8.38.1. Company Overview
      2. 8.38.2. Product/Service Portfolio
      3. 8.38.3. DISARP SA Sales, Revenue, Price, and Gross Margin
      4. 8.38.4. DISARP SA Revenue and Growth Rate
      5. 8.38.5. DISARP SA Market Share
      6. 8.38.6. Recent Initiatives, Funding/VC Activities, and Technological Innovations
    39. 8.39. VIJUSA
      1. 8.39.1. Company Overview
      2. 8.39.2. Product/Service Portfolio
      3. 8.39.3. VIJUSA Sales, Revenue, Price, and Gross Margin
      4. 8.39.4. VIJUSA Revenue and Growth Rate
      5. 8.39.5. VIJUSA Market Share
      6. 8.39.6. Recent Initiatives, Funding/VC Activities, and Technological Innovations
    40. 8.40. Proquimia s.a.
      1. 8.40.1. Company Overview
      2. 8.40.2. Product/Service Portfolio
      3. 8.40.3. Proquimia s.a. Sales, Revenue, Price, and Gross Margin
      4. 8.40.4. Proquimia s.a. Revenue and Growth Rate
      5. 8.40.5. Proquimia s.a. Market Share
      6. 8.40.6. Recent Initiatives, Funding/VC Activities, and Technological Innovations
    41. 8.41. Eurosanex
      1. 8.41.1. Company Overview
      2. 8.41.2. Product/Service Portfolio
      3. 8.41.3. Eurosanex Sales, Revenue, Price, and Gross Margin
      4. 8.41.4. Eurosanex Revenue and Growth Rate
      5. 8.41.5. Eurosanex Market Share
      6. 8.41.6. Recent Initiatives, Funding/VC Activities, and Technological Innovations
    42. 8.42. Euroquimica
      1. 8.42.1. Company Overview
      2. 8.42.2. Product/Service Portfolio
      3. 8.42.3. Euroquimica Sales, Revenue, Price, and Gross Margin
      4. 8.42.4. Euroquimica Revenue and Growth Rate
      5. 8.42.5. Euroquimica Market Share
      6. 8.42.6. Recent Initiatives, Funding/VC Activities, and Technological Innovations
  9. Chapter 9 Away From Home Hand Soaps and Sanitizer — Industry Analysis
    1. 9.1. Introduction and Taxonomy
    2. 9.2. Away From Home Hand Soaps and Sanitizer Market – Key Trends
      1. 9.2.1. Market Drivers
      2. 9.2.2. Market Restraints
      3. 9.2.3. Market Opportunities
    3. 9.3. Value Chain Analysis
    4. 9.4. Key Mandates and Regulations
    5. 9.5. Technology Roadmap and Timeline
    6. 9.6. Away From Home Hand Soaps and Sanitizer Market – Attractiveness Analysis
      1. 9.6.1. By Type
      2. 9.6.2. By Sales Channel
      3. 9.6.3. By End Use
      4. 9.6.4. By Region
  10. Chapter 10 Raw Material Analysis
    1. 10.1. Away From Home Hand Soaps and Sanitizer Key Raw Material Analysis
      1. 10.1.1. Key Raw Materials
      2. 10.1.2. Price Trend of Key Raw Materials
    2. 10.2. Key Suppliers of Raw Materials
    3. 10.3. Proportion of Manufacturing Cost Structure
      1. 10.3.1. Raw Materials Cost
      2. 10.3.2. Labor Cost
      3. 10.3.3. Manufacturing Expenses
      4. 10.3.4. Miscellaneous Expenses
    4. 10.4. Manufacturing Cost Analysis of Away From Home Hand Soaps and Sanitizer
  11. Chapter 11 Industrial Chain, Sourcing Strategy, and Downstream Buyers
    1. 11.1. Away From Home Hand Soaps and Sanitizer Industrial Chain Analysis
    2. 11.2. Upstream Raw Materials Sourcing
      1. 11.2.1. Risk Mitigation:
      2. 11.2.2. Supplier Relationships:
      3. 11.2.3. Business Processes:
      4. 11.2.4. Securing the Product:
    3. 11.3. Raw Materials Sources of Away From Home Hand Soaps and Sanitizer Major Manufacturers
    4. 11.4. Downstream Buyers
    5. 11.5. Distributors/Traders List
  12. Chapter 12 Marketing Strategy Analysis, Distributors
    1. 12.1. Marketing Channel
    2. 12.2. Direct Marketing
    3. 12.3. Indirect Marketing
    4. 12.4. Marketing Channel Development Trends
    5. 12.5. Economic/Political Environmental Change
  13. Chapter 13 Report Conclusion & Key Insights
    1. 13.1. Key Insights from Primary Interviews & Surveys Respondents
    2. 13.2. Key Takeaways from Analysts, Consultants, and Industry Leaders
  14. Chapter 14 Research Approach & Methodology
    1. 14.1. Report Description
    2. 14.2. Research Scope
    3. 14.3. Research Methodology
      1. 14.3.1. Secondary Research
      2. 14.3.2. Primary Research
      3. 14.3.3. Statistical Models
        1. 14.3.3.1. Company Share Analysis Model
        2. 14.3.3.2. Revenue Based Modeling
      4. 14.3.4. Research Limitations

      List of Figures

      Fig.1 Product Picture of Away From Home Hand Soaps and Sanitizer
      Fig.2 Global Away From Home Hand Soaps and Sanitizer Market, 2016 – 2026 (USD Million)
      Fig.3 Global Away From Home Hand Soaps and Sanitizer Market, 2016 – 2026 (K Units)
      Fig.4 Global Away From Home Hand Soaps and Sanitizer Market Absolute Revenue Opportunity, 2016 – 2026 (USD Million)
      Fig.5 Global Away From Home Hand Soaps and Sanitizer Market Incremental Revenue Opportunity, 2020 – 2026 (USD Million)
      Fig.6 Global Away From Home Hand Soaps and Sanitizer Market Share, by Type, 2019 & 2026 (USD Million)
      Fig.7 Global Away From Home Hand Soaps and Sanitizer Market Share, by Type, 2019 & 2026 (K Units)
      Fig.8 Global Soap Away From Home Hand Soaps and Sanitizer Market, 2016 – 2026 (USD Million)
      Fig.9 Global Soap Away From Home Hand Soaps and Sanitizer Market, 2016 – 2026 (K Units)
      Fig.10 Global Sanitizer Away From Home Hand Soaps and Sanitizer Market, 2016 – 2026 (USD Million)
      Fig.11 Global Sanitizer Away From Home Hand Soaps and Sanitizer Market, 2016 – 2026 (K Units)
      Fig.12 Global Away From Home Hand Soaps and Sanitizer Market Share, by Sales Channel, 2019 & 2026 (USD Million)
      Fig.13 Global Away From Home Hand Soaps and Sanitizer Market Share, by Sales Channel, 2019 & 2026 (K Units)
      Fig.14 Global Online Away From Home Hand Soaps and Sanitizer Market, 2016 – 2026 (USD Million)
      Fig.15 Global Online Away From Home Hand Soaps and Sanitizer Market, 2016 – 2026 (K Units)
      Fig.16 Global Offline Away From Home Hand Soaps and Sanitizer Market, 2016 – 2026 (USD Million)
      Fig.17 Global Offline Away From Home Hand Soaps and Sanitizer Market, 2016 – 2026 (K Units)
      Fig.18 Global Away From Home Hand Soaps and Sanitizer Market Share, by End Use, 2019 & 2026 (USD Million)
      Fig.19 Global Away From Home Hand Soaps and Sanitizer Market Share, by End Use, 2019 & 2026 (K Units)
      Fig.20 Global Ho-Re-Ca (Hotel Restaurants Cafes) Away From Home Hand Soaps and Sanitizer Market, 2016 – 2026 (USD Million)
      Fig.21 Global Ho-Re-Ca (Hotel Restaurants Cafes) Away From Home Hand Soaps and Sanitizer Market, 2016 – 2026 (K Units)
      Fig.22 Global Hospitals Away From Home Hand Soaps and Sanitizer Market, 2016 – 2026 (USD Million)
      Fig.23 Global Hospitals Away From Home Hand Soaps and Sanitizer Market, 2016 – 2026 (K Units)
      Fig.24 Global Commercial Away From Home Hand Soaps and Sanitizer Market, 2016 – 2026 (USD Million)
      Fig.25 Global Commercial Away From Home Hand Soaps and Sanitizer Market, 2016 – 2026 (K Units)
      Fig.26 Global Others Away From Home Hand Soaps and Sanitizer Market, 2016 – 2026 (USD Million)
      Fig.27 Global Others Away From Home Hand Soaps and Sanitizer Market, 2016 – 2026 (K Units)
      Fig.28 Global Away From Home Hand Soaps and Sanitizer Market Share, by Region, 2019 & 2026 (USD Million)
      Fig.29 Global Away From Home Hand Soaps and Sanitizer Market Share, by Region, 2019 & 2026 (K Units)
      Fig.30 North America Away From Home Hand Soaps and Sanitizer Market, 2016 – 2026 (USD Million)
      Fig.31 North America Away From Home Hand Soaps and Sanitizer Market, 2016 – 2026 (K Units)
      Fig.32 U.S. Away From Home Hand Soaps and Sanitizer Market, 2016 – 2026 (USD Million)
      Fig.33 U.S. Away From Home Hand Soaps and Sanitizer  Market, 2016 – 2026 (K Units)
      Fig.34 Canada Away From Home Hand Soaps and Sanitizer Market, 2016 – 2026 (USD Million)
      Fig.35 Canada Away From Home Hand Soaps and Sanitizer  Market, 2016 – 2026 (K Units)
      Fig.36 Europe Away From Home Hand Soaps and Sanitizer Market, 2016 – 2026 (USD Million)
      Fig.37 Europe Away From Home Hand Soaps and Sanitizer Market, 2016 – 2026 (K Units)
      Fig.38 Germany Away From Home Hand Soaps and Sanitizer Market, 2016 – 2026 (USD Million)
      Fig.39 Germany Away From Home Hand Soaps and Sanitizer  Market, 2016 – 2026 (K Units)
      Fig.40 France Away From Home Hand Soaps and Sanitizer Market, 2016 – 2026 (USD Million)
      Fig.41 France Away From Home Hand Soaps and Sanitizer  Market, 2016 – 2026 (K Units)
      Fig.42 U.K. Away From Home Hand Soaps and Sanitizer Market, 2016 – 2026 (USD Million)
      Fig.43 U.K. Away From Home Hand Soaps and Sanitizer  Market, 2016 – 2026 (K Units)
      Fig.44 Italy Away From Home Hand Soaps and Sanitizer Market, 2016 – 2026 (USD Million)
      Fig.45 Italy Away From Home Hand Soaps and Sanitizer  Market, 2016 – 2026 (K Units)
      Fig.46 Spain Away From Home Hand Soaps and Sanitizer Market, 2016 – 2026 (USD Million)
      Fig.47 Spain Away From Home Hand Soaps and Sanitizer  Market, 2016 – 2026 (K Units)
      Fig.48 Rest of Europe Away From Home Hand Soaps and Sanitizer Market, 2016 – 2026 (USD Million)
      Fig.49 Rest of Europe Away From Home Hand Soaps and Sanitizer  Market, 2016 – 2026 (K Units)
      Fig.50 Asia Pacific Away From Home Hand Soaps and Sanitizer Market, 2016 – 2026 (USD Million)
      Fig.51 Asia Pacific Away From Home Hand Soaps and Sanitizer Market, 2016 – 2026 (K Units)
      Fig.52 China Away From Home Hand Soaps and Sanitizer Market, 2016 – 2026 (USD Million)
      Fig.53 China Away From Home Hand Soaps and Sanitizer  Market, 2016 – 2026 (K Units)
      Fig.54 Japan Away From Home Hand Soaps and Sanitizer Market, 2016 – 2026 (USD Million)
      Fig.55 Japan Away From Home Hand Soaps and Sanitizer  Market, 2016 – 2026 (K Units)
      Fig.56 India Away From Home Hand Soaps and Sanitizer Market, 2016 – 2026 (USD Million)
      Fig.57 India Away From Home Hand Soaps and Sanitizer  Market, 2016 – 2026 (K Units)
      Fig.58 South  Korea Away From Home Hand Soaps and Sanitizer Market, 2016 – 2026 (USD Million)
      Fig.59 South  Korea Away From Home Hand Soaps and Sanitizer  Market, 2016 – 2026 (K Units)
      Fig.60 South-East Asia Away From Home Hand Soaps and Sanitizer Market, 2016 – 2026 (USD Million)
      Fig.61 South-East Asia Away From Home Hand Soaps and Sanitizer  Market, 2016 – 2026 (K Units)
      Fig.62 Rest of Asia Pacific Away From Home Hand Soaps and Sanitizer Market, 2016 – 2026 (USD Million)
      Fig.63 Rest of Asia Pacific Away From Home Hand Soaps and Sanitizer  Market, 2016 – 2026 (K Units)
      Fig.64 Latin America Away From Home Hand Soaps and Sanitizer Market, 2016 – 2026 (USD Million)
      Fig.65 Latin America Away From Home Hand Soaps and Sanitizer Market, 2016 – 2026 (K Units)
      Fig.66 Brazil Away From Home Hand Soaps and Sanitizer Market, 2016 – 2026 (USD Million)
      Fig.67 Brazil Away From Home Hand Soaps and Sanitizer  Market, 2016 – 2026 (K Units)
      Fig.68 Mexico Away From Home Hand Soaps and Sanitizer Market, 2016 – 2026 (USD Million)
      Fig.69 Mexico Away From Home Hand Soaps and Sanitizer  Market, 2016 – 2026 (K Units)
      Fig.70 Rest of Latin America Away From Home Hand Soaps and Sanitizer Market, 2016 – 2026 (USD Million)
      Fig.71 Rest of Latin America Away From Home Hand Soaps and Sanitizer  Market, 2016 – 2026 (K Units)
      Fig.72 The Middle-East and Africa Away From Home Hand Soaps and Sanitizer Market, 2016 – 2026 (USD Million)
      Fig.73 The Middle-East and Africa Away From Home Hand Soaps and Sanitizer Market, 2016 – 2026 (K Units)
      Fig.74 GCC Countries Away From Home Hand Soaps and Sanitizer Market, 2016 – 2026 (USD Million)
      Fig.75 GCC Countries Away From Home Hand Soaps and Sanitizer  Market, 2016 – 2026 (K Units)
      Fig.76 South Africa Away From Home Hand Soaps and Sanitizer Market, 2016 – 2026 (USD Million)
      Fig.77 South Africa Away From Home Hand Soaps and Sanitizer  Market, 2016 – 2026 (K Units)
      Fig.78 Rest of Middle-East Africa Away From Home Hand Soaps and Sanitizer Market, 2016 – 2026 (USD Million)
      Fig.79 Rest of Middle-East Africa Away From Home Hand Soaps and Sanitizer  Market, 2016 – 2026 (K Units)
      Fig.80 Global Away From Home Hand Soaps and Sanitizer Production and Consumption, 2016 – 2026 (K Units)
      Fig.81 North America Away From Home Hand Soaps and Sanitizer Production and Consumption, 2016 – 2026 (USD Million) (K Units)
      Fig.82 Europe Away From Home Hand Soaps and Sanitizer Production and Consumption, 2016 – 2026 (USD Million) (K Units)
      Fig.83 Asia Pacific Away From Home Hand Soaps and Sanitizer Production and Consumption, 2016 – 2026 (USD Million) (K Units)
      Fig.84 Latin America Away From Home Hand Soaps and Sanitizer Production and Consumption, 2016 – 2026 (USD Million) (K Units)
      Fig.85 The Middle-East and Africa Away From Home Hand Soaps and Sanitizer Production and Consumption, 2016 – 2026 (USD Million) (K Units)
      Fig.86 Competitor Market Share – Revenue
      Fig.87 Competitor Market Share – Volume
      Fig.88 Henkel Corporation Revenue and Growth Rate
      Fig.89 Henkel Corporation Market Share
      Fig.90 BODE Chemie GmbH Revenue and Growth Rate
      Fig.91 BODE Chemie GmbH Market Share
      Fig.92 Ecolab Revenue and Growth Rate
      Fig.93 Ecolab Market Share
      Fig.94 Reckitt Benckiser Group Revenue and Growth Rate
      Fig.95 Reckitt Benckiser Group Market Share
      Fig.96 HAGLEITNER Revenue and Growth Rate
      Fig.97 HAGLEITNER Market Share
      Fig.98 Gojo Revenue and Growth Rate
      Fig.99 Gojo Market Share
      Fig.100 Phagogène (Christeyns) Revenue and Growth Rate
      Fig.101 Phagogène (Christeyns) Market Share
      Fig.102 MP Hygiene Revenue and Growth Rate
      Fig.103 MP Hygiene Market Share
      Fig.104 Deb Group Revenue and Growth Rate
      Fig.105 Deb Group Market Share
      Fig.106 PZ Cussons Revenue and Growth Rate
      Fig.107 PZ Cussons Market Share
      Fig.108 Baylis & Harding Revenue and Growth Rate
      Fig.109 Baylis & Harding Market Share
      Fig.110 Kimberly Clark Revenue and Growth Rate
      Fig.111 Kimberly Clark Market Share
      Fig.112 Proeco Quimicas Revenue and Growth Rate
      Fig.113 Proeco Quimicas Market Share
      Fig.114 Sanilec Revenue and Growth Rate
      Fig.115 Sanilec Market Share
      Fig.116 Dr. Schumacher GmbH Revenue and Growth Rate
      Fig.117 Dr. Schumacher GmbH Market Share
      Fig.118 orochemie GmbH + Co. KG Revenue and Growth Rate
      Fig.119 orochemie GmbH + Co. KG Market Share
      Fig.120 CCM GMBH Revenue and Growth Rate
      Fig.121 CCM GMBH Market Share
      Fig.122 Sagrotan Revenue and Growth Rate
      Fig.123 Sagrotan Market Share
      Fig.124 Tana Chemie, Wyritol ( PROVEN ) Revenue and Growth Rate
      Fig.125 Tana Chemie, Wyritol ( PROVEN ) Market Share
      Fig.126 Techniclean, Saraya Co. Ltd. Revenue and Growth Rate
      Fig.127 Techniclean, Saraya Co. Ltd. Market Share 
      Fig.128 Lancopharm        Cleenol Revenue and Growth Rate
      Fig.129 Lancopharm        Cleenol Market Share
      Fig.130 Selden Research Revenue and Growth Rate
      Fig.131 Selden Research Market Share
      Fig.132 Kutol Products Company Revenue and Growth Rate
      Fig.133 Kutol Products Company Market Share
      Fig.134 Carex Revenue and Growth Rate
      Fig.135 Carex Market Share
      Fig.136 Katrin Revenue and Growth Rate
      Fig.137 Katrin Market Share
      Fig.138 Cuticura Revenue and Growth Rate
      Fig.139 Cuticura Market Share
      Fig.140 Vi-Jon Laboratories Inc. Revenue and Growth Rate
      Fig.141 Vi-Jon Laboratories Inc. Market Share
      Fig.142 Garnier Revenue and Growth Rate
      Fig.143 Garnier Market Share
      Fig.144 Rubella Revenue and Growth Rate
      Fig.145 Rubella Market Share
      Fig.146 Rentokil Initial Revenue and Growth Rate
      Fig.147 Rentokil Initial Market Share
      Fig.148 Angelini Pharma Revenue and Growth Rate
      Fig.149 Angelini Pharma Market Share
      Fig.150 Mirius Revenue and Growth Rate
      Fig.151 Mirius Market Share
      Fig.152 Diversey, Inc Revenue and Growth Rate
      Fig.153 Diversey, Inc Market Share
      Fig.154 The Himalaya Drug Company Revenue and Growth Rate
      Fig.155 The Himalaya Drug Company Market Share
      Fig.156 Essity Revenue and Growth Rate
      Fig.157 Essity Market Share
      Fig.158 QUIMXEL Revenue and Growth Rate
      Fig.159 QUIMXEL Market Share
      Fig.160 DYDSA Revenue and Growth Rate
      Fig.161 DYDSA Market Share
      Fig.162 DISARP SA Revenue and Growth Rate
      Fig.163 DISARP SA Market Share
      Fig.164 VIJUSA Revenue and Growth Rate
      Fig.165 VIJUSA Market Share
      Fig.166 Proquimia s.a. Revenue and Growth Rate
      Fig.167 Proquimia s.a. Market Share
      Fig.168 Eurosanex Revenue and Growth Rate
      Fig.169 Eurosanex Market Share
      Fig.170 Euroquimica Revenue and Growth Rate
      Fig.171 Euroquimica Market Share
      Fig.172 Market Dynamics
      Fig.173 Global Away From Home Hand Soaps and Sanitizer – Value Chain Analysis
      Fig.174 Key Mandates and Regulations
      Fig.175 Technology Roadmap and Timeline
      Fig.176 Market Attractiveness Analysis – By Type
      Fig.177 Market Attractiveness Analysis – By Sales Channel
      Fig.178 Market Attractiveness Analysis – By End Use
      Fig.179 Market Attractiveness Analysis – By Region
      Fig.180 Manufacturing Cost Structure of Away From Home Hand Soaps and Sanitizer
      Fig.181 Away From Home Hand Soaps and Sanitizer Industrial Chain Analysis
      Fig.182 Market Channels
      Fig.183 Marketing Channel Development Trend
      Fig.184 Growth in World Gross Product, 2008-2018

      List of Tables

      Table 1 Global Away From Home Hand Soaps and Sanitizer Market, 2019 & 2026 (USD Million)
      Table 2 Global Away From Home Hand Soaps and Sanitizer Market, by Type, 2016 – 2026 (USD Million)
      Table 3 Global Away From Home Hand Soaps and Sanitizer Market, by Type, 2016 – 2026 (K Units)
      Table 4 Global Away From Home Hand Soaps and Sanitizer Market, by Sales Channel, 2016 – 2026 (USD Million)
      Table 5 Global Away From Home Hand Soaps and Sanitizer Market, by Sales Channel, 2016 – 2026 (K Units)
      Table 6 Global Away From Home Hand Soaps and Sanitizer Market, by End Use, 2016 – 2026 (USD Million)
      Table 7 Global Away From Home Hand Soaps and Sanitizer Market, by End Use, 2016 – 2026 (K Units)
      Table 8 Global Away From Home Hand Soaps and Sanitizer Market, by Region, 2016 – 2026 (USD Million)
      Table 9 Global Away From Home Hand Soaps and Sanitizer Market, by Region, 2016 – 2026 (K Units)
      Table 10 North America Away From Home Hand Soaps and Sanitizer Market, by Country, 2016 – 2026 (USD Million)
      Table 11 North America Away From Home Hand Soaps and Sanitizer Market, by Country, 2016 – 2026 (K Units)
      Table 12 North America Away From Home Hand Soaps and Sanitizer Market, by Type, 2016 – 2026 (USD Million)
      Table 13 North America Away From Home Hand Soaps and Sanitizer Market, by Type, 2016 – 2026 (K Units)
      Table 14 North America Away From Home Hand Soaps and Sanitizer Market, by Sales Channel, 2016 – 2026 (USD Million)
      Table 15 North America Away From Home Hand Soaps and Sanitizer Market, by Sales Channel, 2016 – 2026 (K Units)
      Table 16 North America Away From Home Hand Soaps and Sanitizer Market, by End Use, 2016 – 2026 (USD Million)
      Table 17 North America Away From Home Hand Soaps and Sanitizer Market, by End Use, 2016 – 2026 (K Units)
      Table 18 Europe Away From Home Hand Soaps and Sanitizer Market, by Country, 2016 – 2026 (USD Million)
      Table 19 Europe Away From Home Hand Soaps and Sanitizer Market, by Country, 2016 – 2026 (K Units)
      Table 20 Europe Away From Home Hand Soaps and Sanitizer Market, by Type, 2016 – 2026 (USD Million)
      Table 21 Europe Away From Home Hand Soaps and Sanitizer Market, by Type, 2016 – 2026 (K Units)
      Table 22 Europe Away From Home Hand Soaps and Sanitizer Market, by Sales Channel, 2016 – 2026 (USD Million)
      Table 23 Europe Away From Home Hand Soaps and Sanitizer Market, by Sales Channel, 2016 – 2026 (K Units)
      Table 24 Europe Away From Home Hand Soaps and Sanitizer Market, by End Use, 2016 – 2026 (USD Million)
      Table 25 Europe Away From Home Hand Soaps and Sanitizer Market, by End Use, 2016 – 2026 (K Units)
      Table 26 Asia Pacific Away From Home Hand Soaps and Sanitizer Market, by Country, 2016 – 2026 (USD Million)
      Table 27 Asia Pacific Away From Home Hand Soaps and Sanitizer Market, by Country, 2016 – 2026 (K Units)
      Table 28 Asia Pacific Away From Home Hand Soaps and Sanitizer Market, by Type, 2016 – 2026 (USD Million)
      Table 29 Asia Pacific Away From Home Hand Soaps and Sanitizer Market, by Type, 2016 – 2026 (K Units)
      Table 30 Asia Pacific Away From Home Hand Soaps and Sanitizer Market, by Sales Channel, 2016 – 2026 (USD Million)
      Table 31 Asia Pacific Away From Home Hand Soaps and Sanitizer Market, by Sales Channel, 2016 – 2026 (K Units)
      Table 32 Asia Pacific Away From Home Hand Soaps and Sanitizer Market, by End Use, 2016 – 2026 (USD Million)
      Table 33 Asia Pacific Away From Home Hand Soaps and Sanitizer Market, by End Use, 2016 – 2026 (K Units)
      Table 34 Latin America Away From Home Hand Soaps and Sanitizer Market, by Country, 2016 – 2026 (USD Million)
      Table 35 Latin America Away From Home Hand Soaps and Sanitizer Market, by Country, 2016 – 2026 (K Units)
      Table 36 Latin America Away From Home Hand Soaps and Sanitizer Market, by Type, 2016 – 2026 (USD Million)
      Table 37 Latin America Away From Home Hand Soaps and Sanitizer Market, by Type, 2016 – 2026 (K Units)
      Table 38 Latin America Away From Home Hand Soaps and Sanitizer Market, by Sales Channel, 2016 – 2026 (USD Million)
      Table 39 Latin America Away From Home Hand Soaps and Sanitizer Market, by Sales Channel, 2016 – 2026 (K Units)
      Table 40 Latin America Away From Home Hand Soaps and Sanitizer Market, by End Use, 2016 – 2026 (USD Million)
      Table 41 Latin America Away From Home Hand Soaps and Sanitizer Market, by End Use, 2016 – 2026 (K Units)
      Table 42 The Middle-East and Africa Away From Home Hand Soaps and Sanitizer Market, by Country, 2016 – 2026 (USD Million)
      Table 43 The Middle-East and Africa Away From Home Hand Soaps and Sanitizer Market, by Country, 2016 – 2026 (K Units)
      Table 44 The Middle-East and Africa Away From Home Hand Soaps and Sanitizer Market, by Type, 2016 – 2026 (USD Million)
      Table 45 The Middle-East and Africa Away From Home Hand Soaps and Sanitizer Market, by Type, 2016 – 2026 (K Units)
      Table 46 The Middle-East and Africa Away From Home Hand Soaps and Sanitizer Market, by Sales Channel, 2016 – 2026 (USD Million)
      Table 47 The Middle-East and Africa Away From Home Hand Soaps and Sanitizer Market, by Sales Channel, 2016 – 2026 (K Units)
      Table 48 The Middle-East and Africa Away From Home Hand Soaps and Sanitizer Market, by End Use, 2016 – 2026 (USD Million)
      Table 49 The Middle-East and Africa Away From Home Hand Soaps and Sanitizer Market, by End Use, 2016 – 2026 (K Units)
      Table 50 North America Away From Home Hand Soaps and Sanitizer Production, Consumption, Export, Import, 2016 – 2019
      Table 51 Europe Away From Home Hand Soaps and Sanitizer Production, Consumption, Export, Import, 2016 – 2019
      Table 52 Asia Pacific Away From Home Hand Soaps and Sanitizer Production, Consumption, Export, Import, 2016 – 2019
      Table 53 Latin America Away From Home Hand Soaps and Sanitizer Production, Consumption, Export, Import, 2016 – 2019
      Table 54 The Middle-East and Africa Away From Home Hand Soaps and Sanitizer Production, Consumption, Export, Import, 2016 – 2019
      Table 55 Global Away From Home Hand Soaps and Sanitizer Market - Company Revenue Analysis, 2016 – 2019 (USD Million)
      Table 56 Global Away From Home Hand Soaps and Sanitizer Market - Company Revenue Share Analysis, 2016 – 2019 (%)
      Table 57 Global Away From Home Hand Soaps and Sanitizer Market - Company Volume Analysis, 2016 – 2019 (K Units)
      Table 58 Global Away From Home Hand Soaps and Sanitizer Market - Company Volume Share Analysis, 2016 – 2019 (%)
      Table 59 Acquisitions and Mergers
      Table 60 Market Drivers – Impact Analysis
      Table 61 Market Restraints
      Table 62 Market Opportunities
      Table 63 Production Base and Market Concentration Rate of Raw Material
      Table 64 Key Suppliers of Raw Materials
      Table 65 Raw Materials Sources of Away From Home Hand Soaps and Sanitizer Major Manufacturers
      Table 66 Major Buyers of Away From Home Hand Soaps and Sanitizer
      Table 67 Distributors/Traders of Away From Home Hand Soaps and Sanitizer by Region

Industry Major Market Players

  •  Henkel Corporation
  •  BODE Chemie GmbH
  •  Ecolab
  •  Reckitt Benckiser Group
  •  HAGLEITNER
  •  Gojo
  •  Phagogène (Christeyns)
  •  MP Hygiene
  •  Deb Group
  •  PZ Cussons
  •  Baylis & Harding
  •  Kimberly Clark
  •  Proeco Quimicas
  •  Sanilec
  •  Dr. Schumacher GmbH
  •  orochemie GmbH + Co. KG
  •  CCM GMBH
  •  Sagrotan
  •  Tana Chemie
  •  Wyritol ( PROVEN )
  •  Techniclean
  •  Saraya Co. Ltd.
  •  Lancopharm        Cleenol
  •  Selden Research