Search Market Research Report

Discover Our Latest Reports
Discover Our Featured Reports
Discover Top Selling Reports

Automotive Pumps Market Size, Share Global Analysis Report, 2021 - 2026

report img

Automotive Pumps Market By Pump Type (Transmission Pump, Fuel Pump, Oil Pump, Steering Pump, Water Pump, Windshield Pump, Vacuum Pump, & Injection Pump), By Sales Channel (OEM & Aftermarket), By Technology (Mechanical Pump & Electrical Pump), By Vehicle Type (Passenger Cars, Light Commercial Vehicles, &Heavy Commercial Vehicles), And By Regions - Global & Regional Industry Perspective, Comprehensive Analysis, and Forecast 2021 - 2026

Industry Insights

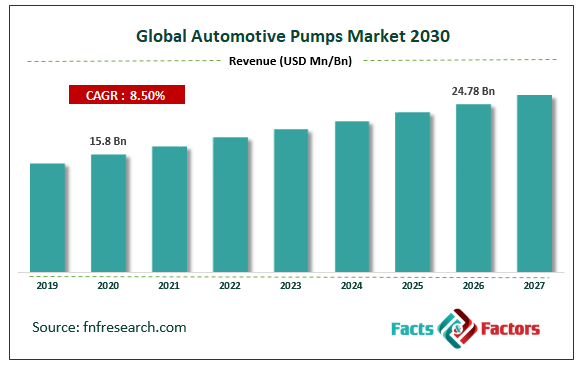
[197+ Pages Report] The latest finding surrounding the “Global Automotive Pumps Market” has recently been published by Facts & Factors in a neatly packaged and comprehensive read. We at Facts & Factors estimate that the automotive pumps market will reach a projected value of USD 24.78 Billion in the year 2026 with a growth rate of 8.5% CAGR from an initial value of USD 15.8 Billion in the year 2020.

Global Automotive Pumps Market Size

To know more about this report | Request Free Sample Copy

logoMarket Overview

The automotive pump is responsible for transferring fuel from one part of the fuel tank to the carburetor or fuel injector of the internal combustion engine for the functioning of the Rankine cycle. Internal combustion engines often incorporate a low-pressure mechanical pump whereas fuel injected pumps are often integrated in systems that are mounted on specially mounted brackets often bolted inside the fuel tank. The fuel that is regularized in these is highly controlled and needs to be within a set range for the smooth functioning of the engine. While a fuel pump is not completely necessary for the easy functioning of the engine, the longer shelf life of the engines is often found to be the case when a fuel pump is equipped.

logoIndustry Growth Factors

The primary driving factors for the global automotive pumps market are the introduction of highly modified technologies coupled with the rising demand for fuel efficiency and higher operating capabilities to name a few. Additionally, factors relating to higher efficiency and optimum performance will further increase the footprint of the global automotive market during the forecast period. Moreover, steady growth in the sales of production of electric vehicles and an ongoing trend of electrification of internal engines are further expected to open new revenue opportunities for the global automotive pumps market during the forecast period. The market is further projected to be plagued by EPS and driven by wire technologies which are further expected to fuel the growth of the global automotive pumps market during the forecast period to a higher overview.

Rising demand for environmentally friendly automobiles and an increase in vehicular demand are expected to trigger a domino effect regarding the sales of automotive pumps during the forecast period. A generalized expansion of the automotive sector coupled with the rising technological advancements will further increase the footprint of the global automotive pumps market during the forecast period. Rising disposable cash among consumers and rising awareness about pump-mounted automobiles being the highly beneficial component will further boost the growth of the global automotive pumps market during the forecast period. However, a higher cost of implementation and the high technical skillset required for installation and maintenance purposes will decrease the market value of the global automotive market during the forecast period.

logoSegmentation Analysis

The global automotive pumps market is segmented into pump type, sales channel, technology, vehicle type, and regions.

On the basis of pump type, the global automotive pumps market can be broken down into transmission pump, fuel pump, oil pump, steering pump, water pump, windshield pump, vacuum pump, and injection pump. The segment pertaining to the fuel pump is expected to witness the largest market share during the advent of the forecast owing to the critical functionality of the latter component coupled with rising demand for fuel-efficient vehicles.

On the basis of sales channels, the global automotive pumps market can be divided into OEM and aftermarket. The OEMS segment is expected to occupy the largest market share during the advent of the forecast owing to the rising investment rounds pertaining to product R&D in attempts to develop superior products coupled with the rising amount of products that cater to a wider branch of consumers to name a few.

On the basis of technology, the global automotive pumps market can be fragmented into mechanical pumps and electrical pumps. The electrical pumps category is expected to gain a reasonable market share during the advent of the forecast owing to innovative designs in fuel pump designs due to integrated usage of smart electronics coupled with rising demand for electric vehicles over the forecast period.

On the basis of vehicle type, the global automotive pumps market is expected to be segmented into passenger cars, light commercial vehicles, and heavy commercial vehicles. The segment pertaining to passenger cars is expected to witness the largest market share during the advent of the forecast owing to the rising demand for passenger vehicles during the forecast period coupled with rising income levels among consumers and an increased per capita income per consumer to name a few.

logo Report Scope

Report Attribute

Details

Market Size in 2020

USD 15.8 Billion

Projected Market Size in 2026

USD 24.78 Billion

CAGR Growth Rate

8.5%

Base Year

2020

Forecast Years

2021-2026

Key Market Players

Seiki Co. LTD, Denso Corporation, Johnson Electric, Robert Bosch Gmbh, Magna International, Aisin Seiki Co. Ltd., Delphi Automotive, TRW Automotive, KSPG AG, Mikuni Corporation, SHW, Concentric AB, Hella Co., Continental AG, JTEKT Corporation, MagnetiMarelli, and Pricol Ltd., among others.

Key Segments

Pump Type, Sales Channel, Technology, Vehicle Type, and Region

Major Regions Covered

North America, Europe, Asia Pacific, Latin America, and Middle East & Africa

Purchase Options

Request customized purchase options to meet your research needs. Explore purchase options

logo Regional Analysis

Europe is expected to witness the largest market share during the advent of the forecast in terms of global revenue contribution. Contributing factors for the dominant market share can be credited to Europe’s current prowess in vehicular production and sales coupled with the early adoption of electrification of vehicles to name a few. Additionally, stringent vehicular policies aimed at reducing pollution controls measures coupled with increased vehicular production are expected to increase the footprint of the automotive pumps market during the forecast period. Government-based incentives for setting up local production plants will further increase a surge of inflow of automotive pumps during the forecast period.

logo Competitive Players

The key market players for the global automotive pumps market are:

  • Seiki Co. LTD
  • Denso Corporation
  • Johnson Electric
  • Robert Bosch Gmbh
  • Magna International
  • Aisin Seiki Co. Ltd.
  • Delphi Automotive
  • TRW Automotive
  • KSPG AG
  • Mikuni Corporation
  • SHW
  • Concentric AB
  • Hella Co.
  • Continental AG
  • JTEKT Corporation
  • MagnetiMarelli
  • Pricol Ltd.

logo By Pump Type Segment Analysis

  • Transmission Pump
  • Fuel Pump
  • Oil Pump
  • Steering Pump
  • Water Pump
  • Windshield Pump
  • Vacuum Pump
  • Injection Pump

logo By Sales ChannelSegment Analysis

  • OEM
  • Aftermarket

logo By TechnologySegment Analysis

  • Mechanical Pump
  • Electrical Pump

logo By Vehicle TypeSegment Analysis

  • Passenger Cars
  • Light Commercial Vehicles
  • Heavy Commercial Vehicles

logo By Regional Segment Analysis

  • North America
    • U.S.
    • Canada
  • Europe
    • UK
    • France
    • Germany
    • Italy
    • Spain
    • Rest of Europe
  • Asia Pacific
    • China
    • Japan
    • India
    • South Korea
    • Southeast Asia
    • Rest of Asia Pacific
  • Latin America
    • Brazil
    • Mexico
    • Rest of Latin America
  • Middle East and Africa
    • GCC Countries
    • South Africa
    • Rest of MEA

Table of Content

  1. Chapter 1 Executive Summary
    1. 1.1. Introduction of Automotive Pumps
    2. 1.2. Global Automotive Pumps Market, 2019 & 2026 (USD Billion)
    3. 1.3. Global Automotive Pumps Market, 2016 – 2026 (USD Billion)
    4. 1.4. Global Automotive Pumps Market Absolute Revenue Opportunity, 2016 – 2026 (USD Billion)
    5. 1.5. Global Automotive Pumps Market Incremental Revenue Opportunity, 2020 – 2026 (USD Billion)
  2. Chapter 2 Automotive Pumps Market – Pump Type Analysis
    1. 2.1. Global Automotive Pumps Market – Pump Type Overview
    2. 2.2. Global Automotive Pumps Market Share, by Pump Type, 2019 & 2026 (USD Billion)
    3. 2.3. Transmission Pump
      1. 2.3.1. Global Transmission Pump Automotive Pumps Market, 2016 – 2026 (USD Billion)
    4. 2.4. Fuel Pump
      1. 2.4.1. Global Fuel Pump Automotive Pumps Market, 2016 – 2026 (USD Billion)
    5. 2.5. Oil Pump
      1. 2.5.1. Global Oil Pump Automotive Pumps Market, 2016 – 2026 (USD Billion)
    6. 2.6. Steering Pump
      1. 2.6.1. Global Steering Pump Automotive Pumps Market, 2016 – 2026 (USD Billion)
    7. 2.7. Water Pump
      1. 2.7.1. Global Water Pump Automotive Pumps Market, 2016 – 2026 (USD Billion)
    8. 2.8. Windshield Pump
      1. 2.8.1. Global Windshield Pump Automotive Pumps Market, 2016 – 2026 (USD Billion)
    9. 2.9. Vacuum Pump
      1. 2.9.1. Global Vacuum Pump Automotive Pumps Market, 2016 – 2026 (USD Billion)
    10. 2.10. Injection Pump
      1. 2.10.1. Global Injection Pump Automotive Pumps Market, 2016 – 2026 (USD Billion)
  3. Chapter 3 Automotive Pumps Market – Sales Channel Analysis
    1. 3.1. Global Automotive Pumps Market – Sales Channel Overview
    2. 3.2. Global Automotive Pumps Market Share, by Sales Channel, 2019 & 2026 (USD Billion)
    3. 3.3. OEM
      1. 3.3.1. Global OEM Automotive Pumps Market, 2016 – 2026 (USD Billion)
    4. 3.4. Aftermarket
      1. 3.4.1. Global Aftermarket Automotive Pumps Market, 2016 – 2026 (USD Billion)
  4. Chapter 4 Automotive Pumps Market – Technology Analysis
    1. 4.1. Global Automotive Pumps Market – Technology Overview
    2. 4.2. Global Automotive Pumps Market Share, by Technology, 2019 & 2026 (USD Billion)
    3. 4.3. Mechanical Pump
      1. 4.3.1. Global Mechanical Pump Automotive Pumps Market, 2016 – 2026 (USD Billion)
    4. 4.4. Electrical Pump
      1. 4.4.1. Global Electrical Pump Automotive Pumps Market, 2016 – 2026 (USD Billion)
  5. Chapter 5 Automotive Pumps Market – Vehicle Type Analysis
    1. 5.1. Global Automotive Pumps Market – Vehicle Type Overview
    2. 5.2. Global Automotive Pumps Market Share, by Vehicle Type, 2019 & 2026 (USD Billion)
    3. 5.3. Passenger Cars
      1. 5.3.1. Global Passenger Cars Automotive Pumps Market, 2016 – 2026 (USD Billion)
    4. 5.4. Light Commercial Vehicles
      1. 5.4.1. Global Light Commercial Vehicles Automotive Pumps Market, 2016 – 2026 (USD Billion)
    5. 5.5. Heavy Commercial Vehicles
      1. 5.5.1. Global Heavy Commercial Vehicles Automotive Pumps Market, 2016 – 2026 (USD Billion)
  6. Chapter 6 Automotive Pumps Market – Regional Analysis
    1. 6.1. Global Automotive Pumps Market Regional Overview
    2. 6.2. Global Automotive Pumps Market Share, by Region, 2019 & 2026 (USD Billion)
    3. 6.3. North America
      1. 6.3.1. North America Automotive Pumps Market, 2016 – 2026 (USD Billion)
        1. 6.3.1.1. North America Automotive Pumps Market, by Country, 2016 - 2026 (USD Billion)
      2. 6.3.2. North America Automotive Pumps Market, by Pump Type, 2016 – 2026
        1. 6.3.2.1. North America Automotive Pumps Market, by Pump Type, 2016 – 2026 (USD Billion)
      3. 6.3.3. North America Automotive Pumps Market, by Sales Channel, 2016 – 2026
        1. 6.3.3.1. North America Automotive Pumps Market, by Sales Channel, 2016 – 2026 (USD Billion)
      4. 6.3.4. North America Automotive Pumps Market, by Technology, 2016 – 2026
        1. 6.3.4.1. North America Automotive Pumps Market, by Technology, 2016 – 2026 (USD Billion)
      5. 6.3.5. North America Automotive Pumps Market, by Vehicle Type, 2016 – 2026
        1. 6.3.5.1. North America Automotive Pumps Market, by Vehicle Type, 2016 – 2026 (USD Billion)
      6. 6.3.6. U.S.
        1. 6.3.6.1. U.S. Automotive Pumps Market, 2016 – 2026 (USD Billion)
      7. 6.3.7. Canada
        1. 6.3.7.1. Canada Automotive Pumps Market, 2016 – 2026 (USD Billion)
    4. 6.4. Europe
      1. 6.4.1. Europe Automotive Pumps Market, 2016 – 2026 (USD Billion)
        1. 6.4.1.1. Europe Automotive Pumps Market, by Country, 2016 - 2026 (USD Billion)
      2. 6.4.2. Europe Automotive Pumps Market, by Pump Type, 2016 – 2026
        1. 6.4.2.1. Europe Automotive Pumps Market, by Pump Type, 2016 – 2026 (USD Billion)
      3. 6.4.3. Europe Automotive Pumps Market, by Sales Channel, 2016 – 2026
        1. 6.4.3.1. Europe Automotive Pumps Market, by Sales Channel, 2016 – 2026 (USD Billion)
      4. 6.4.4. Europe Automotive Pumps Market, by Technology, 2016 – 2026
        1. 6.4.4.1. Europe Automotive Pumps Market, by Technology, 2016 – 2026 (USD Billion)
      5. 6.4.5. Europe Automotive Pumps Market, by Vehicle Type, 2016 – 2026
        1. 6.4.5.1. Europe Automotive Pumps Market, by Vehicle Type, 2016 – 2026 (USD Billion)
      6. 6.4.6. Germany
        1. 6.4.6.1. Germany Automotive Pumps Market, 2016 – 2026 (USD Billion)
      7. 6.4.7. France
        1. 6.4.7.1. France Automotive Pumps Market, 2016 – 2026 (USD Billion)
      8. 6.4.8. U.K.
        1. 6.4.8.1. U.K. Automotive Pumps Market, 2016 – 2026 (USD Billion)
      9. 6.4.9. Italy
        1. 6.4.9.1. Italy Automotive Pumps Market, 2016 – 2026 (USD Billion)
      10. 6.4.10. Spain
        1. 6.4.10.1. Spain Automotive Pumps Market, 2016 – 2026 (USD Billion)
      11. 6.4.11. Rest of Europe
        1. 6.4.11.1. Rest of Europe Automotive Pumps Market, 2016 – 2026 (USD Billion)
    5. 6.5. Asia Pacific
      1. 6.5.1. Asia Pacific Automotive Pumps Market, 2016 – 2026 (USD Billion)
        1. 6.5.1.1. Asia Pacific Automotive Pumps Market, by Country, 2016 - 2026 (USD Billion)
      2. 6.5.2. Asia Pacific Automotive Pumps Market, by Pump Type, 2016 – 2026
        1. 6.5.2.1. Asia Pacific Automotive Pumps Market, by Pump Type, 2016 – 2026 (USD Billion)
      3. 6.5.3. Asia Pacific Automotive Pumps Market, by Sales Channel, 2016 – 2026
        1. 6.5.3.1. Asia Pacific Automotive Pumps Market, by Sales Channel, 2016 – 2026 (USD Billion)
      4. 6.5.4. Asia Pacific Automotive Pumps Market, by Technology, 2016 – 2026
        1. 6.5.4.1. Asia Pacific Automotive Pumps Market, by Technology, 2016 – 2026 (USD Billion)
      5. 6.5.5. Asia Pacific Automotive Pumps Market, by Vehicle Type, 2016 – 2026
        1. 6.5.5.1. Asia Pacific Automotive Pumps Market, by Vehicle Type, 2016 – 2026 (USD Billion)
      6. 6.5.6. China
        1. 6.5.6.1. China Automotive Pumps Market, 2016 – 2026 (USD Billion)
      7. 6.5.7. Japan
        1. 6.5.7.1. Japan Automotive Pumps Market, 2016 – 2026 (USD Billion)
      8. 6.5.8. India
        1. 6.5.8.1. India Automotive Pumps Market, 2016 – 2026 (USD Billion)
      9. 6.5.9. South Korea
        1. 6.5.9.1. South Korea Automotive Pumps Market, 2016 – 2026 (USD Billion)
      10. 6.5.10. South-East Asia
        1. 6.5.10.1. South-East Asia Automotive Pumps Market, 2016 – 2026 (USD Billion)
      11. 6.5.11. Rest of Asia Pacific
        1. 6.5.11.1. Rest of Asia Pacific Automotive Pumps Market, 2016 – 2026 (USD Billion)
    6. 6.6. Latin America
      1. 6.6.1. Latin America Automotive Pumps Market, 2016 – 2026 (USD Billion)
        1. 6.6.1.1. Latin America Automotive Pumps Market, by Country, 2016 - 2026 (USD Billion)
      2. 6.6.2. Latin America Automotive Pumps Market, by Pump Type, 2016 – 2026
        1. 6.6.2.1. Latin America Automotive Pumps Market, by Pump Type, 2016 – 2026 (USD Billion)
      3. 6.6.3. Latin America Automotive Pumps Market, by Sales Channel, 2016 – 2026
        1. 6.6.3.1. Latin America Automotive Pumps Market, by Sales Channel, 2016 – 2026 (USD Billion)
      4. 6.6.4. Latin America Automotive Pumps Market, by Technology, 2016 – 2026
        1. 6.6.4.1. Latin America Automotive Pumps Market, by Technology, 2016 – 2026 (USD Billion)
      5. 6.6.5. Latin America Automotive Pumps Market, by Vehicle Type, 2016 – 2026
        1. 6.6.5.1. Latin America Automotive Pumps Market, by Vehicle Type, 2016 – 2026 (USD Billion)
      6. 6.6.6. Brazil
        1. 6.6.6.1. Brazil Automotive Pumps Market, 2016 – 2026 (USD Billion)
      7. 6.6.7. Mexico
        1. 6.6.7.1. Mexico Automotive Pumps Market, 2016 – 2026 (USD Billion)
      8. 6.6.8. Rest of Latin America
        1. 6.6.8.1. Rest of Latin America Automotive Pumps Market, 2016 – 2026 (USD Billion)
    7. 6.7. The Middle-East and Africa
      1. 6.7.1. The Middle-East and Africa Automotive Pumps Market, 2016 – 2026 (USD Billion)
        1. 6.7.1.1. The Middle-East and Africa Automotive Pumps Market, by Country, 2016 - 2026 (USD Billion)
      2. 6.7.2. The Middle-East and Africa Automotive Pumps Market, by Pump Type, 2016 – 2026
        1. 6.7.2.1. The Middle-East and Africa Automotive Pumps Market, by Pump Type, 2016 – 2026 (USD Billion)
      3. 6.7.3. The Middle-East and Africa Automotive Pumps Market, by Sales Channel, 2016 – 2026
        1. 6.7.3.1. The Middle-East and Africa Automotive Pumps Market, by Sales Channel, 2016 – 2026 (USD Billion)
      4. 6.7.4. The Middle-East and Africa Automotive Pumps Market, by Technology, 2016 – 2026
        1. 6.7.4.1. The Middle-East and Africa Automotive Pumps Market, by Technology, 2016 – 2026 (USD Billion)
      5. 6.7.5. The Middle-East and Africa Automotive Pumps Market, by Vehicle Type, 2016 – 2026
        1. 6.7.5.1. The Middle-East and Africa Automotive Pumps Market, by Vehicle Type, 2016 – 2026 (USD Billion)
      6. 6.7.6. GCC Countries
        1. 6.7.6.1. GCC Countries Automotive Pumps Market, 2016 – 2026 (USD Billion)
      7. 6.7.7. South Africa
        1. 6.7.7.1. South Africa Automotive Pumps Market, 2016 – 2026 (USD Billion)
      8. 6.7.8. Rest of Middle-East Africa
        1. 6.7.8.1. Rest of Middle-East Africa Automotive Pumps Market, 2016 – 2026 (USD Billion)
  7. Chapter 7 Automotive PumpsMarket – Competitive Landscape
    1. 7.1. Competitor Market Share – Revenue
    2. 7.2. Market Concentration Rate Analysis, Top 3 and Top 5 Players
    3. 7.3. Strategic Developments
      1. 7.3.1. Acquisitions and Mergers
      2. 7.3.2. New Products
      3. 7.3.3. Research & Development Activities
  8. Chapter 8 Company Profiles
    1. 8.1. Seiki Co. LTD
      1. 8.1.1. Company Overview
      2. 8.1.2. Product/Service Portfolio
      3. 8.1.3. Seiki Co. LTD Sales, Revenue, and Gross Margin
      4. 8.1.4. Seiki Co. LTD Revenue and Growth Rate
      5. 8.1.5. Seiki Co. LTD Market Share
      6. 8.1.6. Recent Initiatives, Funding/VC Activities, and Technological Innovations
    2. 8.2. Denso Corporation
      1. 8.2.1. Company Overview
      2. 8.2.2. Product/Service Portfolio
      3. 8.2.3. Denso Corporation Sales, Revenue, and Gross Margin
      4. 8.2.4. Denso Corporation Revenue and Growth Rate
      5. 8.2.5. Denso Corporation Market Share
      6. 8.2.6. Recent Initiatives, Funding/VC Activities, and Technological Innovations
    3. 8.3. Johnson Electric
      1. 8.3.1. Company Overview
      2. 8.3.2. Product/Service Portfolio
      3. 8.3.3. Johnson Electric Sales, Revenue, and Gross Margin
      4. 8.3.4. Johnson Electric Revenue and Growth Rate
      5. 8.3.5. Johnson Electric Market Share
      6. 8.3.6. Recent Initiatives, Funding/VC Activities, and Technological Innovations
    4. 8.4. Robert Bosch Gmbh
      1. 8.4.1. Company Overview
      2. 8.4.2. Product/Service Portfolio
      3. 8.4.3. Robert Bosch Gmbh Sales, Revenue, and Gross Margin
      4. 8.4.4. Robert Bosch Gmbh Revenue and Growth Rate
      5. 8.4.5. Robert Bosch Gmbh Market Share
      6. 8.4.6. Recent Initiatives, Funding/VC Activities, and Technological Innovations
    5. 8.5. Magna International
      1. 8.5.1. Company Overview
      2. 8.5.2. Product/Service Portfolio
      3. 8.5.3. Magna International Sales, Revenue, and Gross Margin
      4. 8.5.4. Magna International Revenue and Growth Rate
      5. 8.5.5. Magna International Market Share
      6. 8.5.6. Recent Initiatives, Funding/VC Activities, and Technological Innovations
    6. 8.6. Aisin Seiki Co. Ltd
      1. 8.6.1. Company Overview
      2. 8.6.2. Product/Service Portfolio
      3. 8.6.3. Aisin Seiki Co. Ltd Sales, Revenue, and Gross Margin
      4. 8.6.4. Aisin Seiki Co. Ltd Revenue and Growth Rate
      5. 8.6.5. Aisin Seiki Co. Ltd Market Share
      6. 8.6.6. Recent Initiatives, Funding/VC Activities, and Technological Innovations
    7. 8.7. Delphi Automotive
      1. 8.7.1. Company Overview
      2. 8.7.2. Product/Service Portfolio
      3. 8.7.3. Delphi Automotive Sales, Revenue, and Gross Margin
      4. 8.7.4. Delphi Automotive Revenue and Growth Rate
      5. 8.7.5. Delphi Automotive Market Share
      6. 8.7.6. Recent Initiatives, Funding/VC Activities, and Technological Innovations
    8. 8.8. TRW Automotive
      1. 8.8.1. Company Overview
      2. 8.8.2. Product/Service Portfolio
      3. 8.8.3. TRW Automotive Sales, Revenue, and Gross Margin
      4. 8.8.4. TRW Automotive Revenue and Growth Rate
      5. 8.8.5. TRW Automotive Market Share
      6. 8.8.6. Recent Initiatives, Funding/VC Activities, and Technological Innovations
    9. 8.9. KSPG AG
      1. 8.9.1. Company Overview
      2. 8.9.2. Product/Service Portfolio
      3. 8.9.3. KSPG AG Sales, Revenue, and Gross Margin
      4. 8.9.4. KSPG AG Revenue and Growth Rate
      5. 8.9.5. KSPG AG Market Share
      6. 8.9.6. Recent Initiatives, Funding/VC Activities, and Technological Innovations
    10. 8.10. Mikuni Corporation
      1. 8.10.1. Company Overview
      2. 8.10.2. Product/Service Portfolio
      3. 8.10.3. Mikuni Corporation Sales, Revenue, and Gross Margin
      4. 8.10.4. Mikuni Corporation Revenue and Growth Rate
      5. 8.10.5. Mikuni Corporation Market Share
      6. 8.10.6. Recent Initiatives, Funding/VC Activities, and Technological Innovations
    11. 8.11. SHW
      1. 8.11.1. Company Overview
      2. 8.11.2. Product/Service Portfolio
      3. 8.11.3. SHW Sales, Revenue, and Gross Margin
      4. 8.11.4. SHW Revenue and Growth Rate
      5. 8.11.5. SHW Market Share
      6. 8.11.6. Recent Initiatives, Funding/VC Activities, and Technological Innovations
    12. 8.12. Concentric AB
      1. 8.12.1. Company Overview
      2. 8.12.2. Product/Service Portfolio
      3. 8.12.3. Concentric AB Sales, Revenue, and Gross Margin
      4. 8.12.4. Concentric AB Revenue and Growth Rate
      5. 8.12.5. Concentric AB Market Share
      6. 8.12.6. Recent Initiatives, Funding/VC Activities, and Technological Innovations
    13. 8.13. Hella Co
      1. 8.13.1. Company Overview
      2. 8.13.2. Product/Service Portfolio
      3. 8.13.3. Hella Co Sales, Revenue, and Gross Margin
      4. 8.13.4. Hella Co Revenue and Growth Rate
      5. 8.13.5. Hella Co Market Share
      6. 8.13.6. Recent Initiatives, Funding/VC Activities, and Technological Innovations
    14. 8.14. Continental AG
      1. 8.14.1. Company Overview
      2. 8.14.2. Product/Service Portfolio
      3. 8.14.3. Continental AG Sales, Revenue, and Gross Margin
      4. 8.14.4. Continental AG Revenue and Growth Rate
      5. 8.14.5. Continental AG Market Share
      6. 8.14.6. Recent Initiatives, Funding/VC Activities, and Technological Innovations
    15. 8.15. JTEKT Corporation
      1. 8.15.1. Company Overview
      2. 8.15.2. Product/Service Portfolio
      3. 8.15.3. JTEKT Corporation Sales, Revenue, and Gross Margin
      4. 8.15.4. JTEKT Corporation Revenue and Growth Rate
      5. 8.15.5. JTEKT Corporation Market Share
      6. 8.15.6. Recent Initiatives, Funding/VC Activities, and Technological Innovations
    16. 8.16. Magneti Marelli
      1. 8.16.1. Company Overview
      2. 8.16.2. Product/Service Portfolio
      3. 8.16.3. Magneti Marelli Sales, Revenue, and Gross Margin
      4. 8.16.4. Magneti Marelli Revenue and Growth Rate
      5. 8.16.5. Magneti Marelli Market Share
      6. 8.16.6. Recent Initiatives, Funding/VC Activities, and Technological Innovations
    17. 8.17. Pricol Ltd
      1. 8.17.1. Company Overview
      2. 8.17.2. Product/Service Portfolio
      3. 8.17.3. Pricol Ltd Sales, Revenue, and Gross Margin
      4. 8.17.4. Pricol Ltd Revenue and Growth Rate
      5. 8.17.5. Pricol Ltd Market Share
      6. 8.17.6. Recent Initiatives, Funding/VC Activities, and Technological Innovations
  9. Chapter 9 Automotive Pumps — Industry Analysis
    1. 9.1. Introduction and Taxonomy
    2. 9.2. Automotive Pumps Market – Key Trends
      1. 9.2.1. Market Drivers
      2. 9.2.2. Market Restraints
      3. 9.2.3. Market Opportunities
    3. 9.3. Value Chain Analysis
    4. 9.4. Key Mandates and Regulations
    5. 9.5. Technology Roadmap and Timeline
    6. 9.6. Automotive Pumps Market – Attractiveness Analysis
      1. 9.6.1. By Pump Type
      2. 9.6.2. By Sales Channel
      3. 9.6.3. By Technology
      4. 9.6.4. By Vehicle Type
      5. 9.6.5. By Region
  10. Chapter 10 Industrial Chain, Sourcing Strategy, and Downstream Buyers
    1. 10.1. Automotive Pumps Industrial Chain Analysis
    2. 10.2. Downstream Buyers
    3. 10.3. Distributors/Traders List
  11. Chapter 11 Marketing Strategy Analysis
    1. 11.1. Marketing Channel
    2. 11.2. Direct Marketing
    3. 11.3. Indirect Marketing
    4. 11.4. Marketing Channel Development Trends
    5. 11.5. Economic/Political Environmental Change
  12. Chapter 12 Report Conclusion & Key Insights
    1. 12.1. Key Insights from Primary Interviews & Surveys Respondents
    2. 12.2. Key Takeaways from Analysts, Consultants, and Industry Leaders
  13. Chapter 13 Research Approach & Methodology
    1. 13.1. Report Description
    2. 13.2. Research Scope
    3. 13.3. Research Methodology
      1. 13.3.1. Secondary Research
      2. 13.3.2. Primary Research
      3. 13.3.3. Statistical Models
        1. 13.3.3.1. Company Share Analysis Model
        2. 13.3.3.2. Revenue Based Modeling
      4. 13.3.4. Research Limitations

      List of Figures

      Fig.1	Product Picture of Automotive Pumps
      Fig.2	Global Automotive Pumps Market, 2016 – 2026 (USD Billion)
      Fig.3	Global Automotive Pumps Market Absolute Revenue Opportunity, 2016 – 2026 (USD Billion)
      Fig.4	Global Automotive Pumps Market Incremental Revenue Opportunity, 2020 – 2026 (USD Billion)
      Fig.5	Global Automotive Pumps Market Share, by Pump Type, 2019 & 2026 (USD Billion)
      Fig.6	Global Transmission Pump  Automotive Pumps Market, 2016 – 2026 (USD Billion)
      Fig.7	Global Fuel Pump  Automotive Pumps Market, 2016 – 2026 (USD Billion)
      Fig.8	Global Oil Pump Automotive Pumps Market, 2016 – 2026 (USD Billion)
      Fig.9	Global Steering Pump  Automotive Pumps Market, 2016 – 2026 (USD Billion)
      Fig.10	Global Water Pump Automotive Pumps Market, 2016 – 2026 (USD Billion)
      Fig.11	Global Windshield Pump Automotive Pumps Market, 2016 – 2026 (USD Billion)
      Fig.12	Global Vacuum Pump  Automotive Pumps Market, 2016 – 2026 (USD Billion)
      Fig.13	Global Injection Pump Automotive Pumps Market, 2016 – 2026 (USD Billion)
      Fig.14	Global Automotive Pumps Market Share, by Sales Channel, 2019 & 2026 (USD Billion)
      Fig.15	Global OEM  Automotive Pumps Market, 2016 – 2026 (USD Billion)
      Fig.16	Global Aftermarket Automotive Pumps Market, 2016 – 2026 (USD Billion)
      Fig.17	Global Automotive Pumps Market Share, by Technology, 2019 & 2026 (USD Billion)
      Fig.18	Global Mechanical Pump  Automotive Pumps Market, 2016 – 2026 (USD Billion)
      Fig.19	Global Electrical Pump Automotive Pumps Market, 2016 – 2026 (USD Billion)
      Fig.20	Global Automotive Pumps Market Share, by Vehicle Type, 2019 & 2026 (USD Billion)
      Fig.21	Global Passenger Cars  Automotive Pumps Market, 2016 – 2026 (USD Billion)
      Fig.22	Global Light Commercial Vehicles  Automotive Pumps Market, 2016 – 2026 (USD Billion)
      Fig.23	Global Heavy Commercial Vehicles Automotive Pumps Market, 2016 – 2026 (USD Billion)
      Fig.24	Global Automotive Pumps Market Share, by Region, 2019 & 2026 (USD Billion)
      Fig.25	North America Automotive Pumps Market, 2016 – 2026 (USD Billion)
      Fig.26	U.S. Automotive Pumps Market, 2016 – 2026 (USD Billion)
      Fig.27	Canada Automotive Pumps Market, 2016 – 2026 (USD Billion)
      Fig.28	Europe Automotive Pumps Market, 2016 – 2026 (USD Billion)
      Fig.29	Germany Automotive Pumps Market, 2016 – 2026 (USD Billion)
      Fig.30	France Automotive Pumps Market, 2016 – 2026 (USD Billion)
      Fig.31	U.K. Automotive Pumps Market, 2016 – 2026 (USD Billion)
      Fig.32	Italy Automotive Pumps Market, 2016 – 2026 (USD Billion)
      Fig.33	Spain Automotive Pumps Market, 2016 – 2026 (USD Billion)
      Fig.34	Rest of Europe Automotive Pumps Market, 2016 – 2026 (USD Billion)
      Fig.35	Asia Pacific Automotive Pumps Market, 2016 – 2026 (USD Billion)
      Fig.36	China Automotive Pumps Market, 2016 – 2026 (USD Billion)
      Fig.37	Japan Automotive Pumps Market, 2016 – 2026 (USD Billion)
      Fig.38	India Automotive Pumps Market, 2016 – 2026 (USD Billion)
      Fig.39	South  Korea Automotive Pumps Market, 2016 – 2026 (USD Billion)
      Fig.40	South-East Asia Automotive Pumps Market, 2016 – 2026 (USD Billion)
      Fig.41	Rest of Asia Pacific Automotive Pumps Market, 2016 – 2026 (USD Billion)
      Fig.42	Latin America Automotive Pumps Market, 2016 – 2026 (USD Billion)
      Fig.43	Brazil Automotive Pumps Market, 2016 – 2026 (USD Billion)
      Fig.44	Mexico Automotive Pumps Market, 2016 – 2026 (USD Billion)
      Fig.45	Rest of Latin America Automotive Pumps Market, 2016 – 2026 (USD Billion)
      Fig.46	The Middle-East and Africa Automotive Pumps Market, 2016 – 2026 (USD Billion)
      Fig.47	GCC Countries Automotive Pumps Market, 2016 – 2026 (USD Billion)
      Fig.48	South Africa Automotive Pumps Market, 2016 – 2026 (USD Billion)
      Fig.49	Rest of Middle-East Africa Automotive Pumps Market, 2016 – 2026 (USD Billion)
      Fig.50	Competitor Market Share – Revenue
      Fig.51	Seiki Co. LTD Revenue and Growth Rate
      Fig.52	Seiki Co. LTD Market Share
      Fig.53	Denso Corporation Revenue and Growth Rate
      Fig.54	Denso Corporation Market Share
      Fig.55	Johnson Electric Revenue and Growth Rate
      Fig.56	Johnson Electric Market Share
      Fig.57	Robert Bosch Gmbh Revenue and Growth Rate
      Fig.58	Robert Bosch Gmbh Market Share
      Fig.59	Magna International Revenue and Growth Rate
      Fig.60	Magna International Market Share
      Fig.61	Aisin Seiki Co. Ltd Revenue and Growth Rate
      Fig.62	Aisin Seiki Co. Ltd Market Share
      Fig.63	Delphi Automotive Revenue and Growth Rate
      Fig.64	Delphi Automotive Market Share
      Fig.65	TRW Automotive Revenue and Growth Rate
      Fig.66	TRW Automotive Market Share
      Fig.67	KSPG AG Revenue and Growth Rate
      Fig.68	KSPG AG Market Share
      Fig.69	Mikuni Corporation Revenue and Growth Rate
      Fig.70	Mikuni Corporation Market Share
      Fig.71	SHW Revenue and Growth Rate
      Fig.72	SHW Market Share
      Fig.73	Concentric AB Revenue and Growth Rate
      Fig.74	Concentric AB Market Share
      Fig.75	Hella Co Revenue and Growth Rate
      Fig.76	Hella Co Market Share
      Fig.77	Continental AG Revenue and Growth Rate
      Fig.78	Continental AG Market Share
      Fig.79	JTEKT Corporation Revenue and Growth Rate
      Fig.80	JTEKT Corporation Market Share
      Fig.81	Magneti Marelli Revenue and Growth Rate
      Fig.82	Magneti Marelli Market Share
      Fig.83	Pricol Ltd Revenue and Growth Rate
      Fig.84	Pricol Ltd Market Share
      Fig.85	Market Dynamics
      Fig.86	Global Automotive Pumps – Value Chain Analysis
      Fig.87	Key Mandates and Regulations
      Fig.88	Technology Roadmap and Timeline
      Fig.89	Market Attractiveness Analysis – By Pump Type
      Fig.90	Market Attractiveness Analysis – By Sales Channel
      Fig.91	Market Attractiveness Analysis – By Technology
      Fig.92	Market Attractiveness Analysis – By Vehicle Type
      Fig.93	Market Attractiveness Analysis – By Region
      Fig.94	Automotive Pumps Industrial Chain Analysis
      Fig.95	Market Channels
      Fig.96	Marketing Channel Development Trend
      Fig.97	Growth in World Gross Product, 2008-2018
      

      List of Tables

      Table 1	Global Automotive Pumps Market, 2019 & 2026 (USD Billion)
      Table 2	Global Automotive Pumps Market, by Pump Type, 2016 – 2026 (USD Billion)
      Table 3	Global Automotive Pumps Market, by Sales Channel, 2016 – 2026 (USD Billion)
      Table 4	Global Automotive Pumps Market, by Technology, 2016 – 2026 (USD Billion)
      Table 5	Global Automotive Pumps Market, by Vehicle Type, 2016 – 2026 (USD Billion)
      Table 6	Global Automotive Pumps Market, by Region, 2016 – 2026 (USD Billion)
      Table 7	North America Automotive Pumps Market, by Country, 2016 – 2026 (USD Billion)
      Table 8	North America Automotive Pumps Market, by Pump Type, 2016 – 2026 (USD Billion)
      Table 9	North America Automotive Pumps Market, by Sales Channel, 2016 – 2026 (USD Billion)
      Table 10 North America Automotive Pumps Market, by Technology, 2016 – 2026 (USD Billion)
      Table 11 North America Automotive Pumps Market, by Vehicle Type, 2016 – 2026 (USD Billion)
      Table 12 Europe Automotive Pumps Market, by Country, 2016 – 2026 (USD Billion)
      Table 13 Europe Automotive Pumps Market, by Pump Type, 2016 – 2026 (USD Billion)
      Table 14 Europe Automotive Pumps Market, by Sales Channel, 2016 – 2026 (USD Billion)
      Table 15 Europe Automotive Pumps Market, by Technology, 2016 – 2026 (USD Billion)
      Table 16 Europe Automotive Pumps Market, by Vehicle Type, 2016 – 2026 (USD Billion)
      Table 17 Asia Pacific Automotive Pumps Market, by Country, 2016 – 2026 (USD Billion)
      Table 18 Asia Pacific Automotive Pumps Market, by Pump Type, 2016 – 2026 (USD Billion)
      Table 19 Asia Pacific Automotive Pumps Market, by Sales Channel, 2016 – 2026 (USD Billion)
      Table 20 Asia Pacific Automotive Pumps Market, by Technology, 2016 – 2026 (USD Billion)
      Table 21 Asia Pacific Automotive Pumps Market, by Vehicle Type, 2016 – 2026 (USD Billion)
      Table 22 Latin America Automotive Pumps Market, by Country, 2016 – 2026 (USD Billion)
      Table 23 Latin America Automotive Pumps Market, by Pump Type, 2016 – 2026 (USD Billion)
      Table 24 Latin America Automotive Pumps Market, by Sales Channel, 2016 – 2026 (USD Billion)
      Table 25 Latin America Automotive Pumps Market, by Technology, 2016 – 2026 (USD Billion)
      Table 26 Latin America Automotive Pumps Market, by Vehicle Type, 2016 – 2026 (USD Billion)
      Table 27 The Middle-East and Africa Automotive Pumps Market, by Country, 2016 – 2026 (USD Billion)
      Table 28 The Middle-East and Africa Automotive Pumps Market, by Pump Type, 2016 – 2026 (USD Billion)
      Table 29 The Middle-East and Africa Automotive Pumps Market, by Sales Channel, 2016 – 2026 (USD Billion)
      Table 30 The Middle-East and Africa Automotive Pumps Market, by Technology, 2016 – 2026 (USD Billion)
      Table 31 The Middle-East and Africa Automotive Pumps Market, by Vehicle Type, 2016 – 2026 (USD Billion)
      Table 32 Global Automotive Pumps Market - Company Revenue Analysis, 2016 – 2019 (USD Billion)
      Table 33 Global Automotive Pumps Market - Company Revenue Share Analysis, 2016 – 2019 (%)
      Table 34 Acquisitions and Mergers
      Table 35 Market Drivers – Impact Analysis
      Table 36 Market Restraints
      Table 37 Market Opportunities
      Table 38 Major Buyers of Automotive Pumps
      Table 39 Distributors/Traders of Automotive Pumps by Region
      

Industry Major Market Players

  • Seiki Co. LTD
  • Denso Corporation
  • Johnson Electric
  • Robert Bosch Gmbh
  • Magna International
  • Aisin Seiki Co. Ltd.
  • Delphi Automotive
  • TRW Automotive
  • KSPG AG
  • Mikuni Corporation
  • SHW
  • Concentric AB
  • Hella Co.
  • Continental AG
  • JTEKT Corporation
  • MagnetiMarelli
  • Pricol Ltd.