Search Market Research Report

Discover Our Latest Reports
Discover Our Featured Reports
Discover Top Selling Reports

Automotive Lubricants Market Size, Share Global Analysis Report, 2020–2026

report img

Automotive Lubricants Market By Base Oil (Mineral Oil Lubricants, Semisynthetic Lubricants, Bio-Based Lubricants, and Synthetic Lubricants) and By Application (Transmission Fluids, Engine Oil, Greases, Gear & Brake Oil, and Others), By Vehicle Type (Passenger Cars, Heavy Commercial Vehicles (HCV), Light Commercial Vehicles (LCV), and Others (Motorbikes)): Global Industry Outlook, Market Size, Business Intelligence, Consumer Preferences, Statistical Surveys, Comprehensive Analysis, Historical Developments, Current Trends, and Forecast 2020–2026

Industry Insights

The Automotive Lubricants market report analyzes and notifies the industry statistics at the global as well as regional and country levels in order to acquire a thorough perspective of the entire Automotive Lubricants market. The historical and past insights are provided for FY 2016 to FY 2019 whereas projected trends are delivered for FY 2020 to FY 2026. The quantitative and numerical data is represented in terms of both volume (Kilo Tons) and value (USD Million) from FY 2016 – 2026.

This specialized and expertise-oriented industry research report scrutinizes the technical and commercial business outlook of the Automotive Lubricants industry. The report analyzes and declares the historical and current trends analysis of the Automotive Lubricants industry and subsequently recommends the projected trends anticipated to be observed in the Automotive Lubricants market during the upcoming years.

Automotive Lubricants Market Size

To know more about this report | Request Free Sample Copy

logoKey Insights from Primary Research

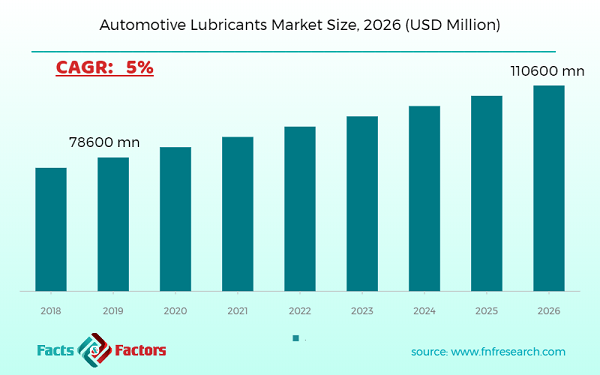
  • It was recognized through primary research that the automotive lubricant market was valued at around USD 78600 million in 2019.
  • Asia Pacific is expected to hold the largest market share of automotive lubricants in terms of revenue, in 2019.
  • Based on base oil segmentation the “Mineral Oil Lubricants” category, was the leading revenue-generating category in 2019.
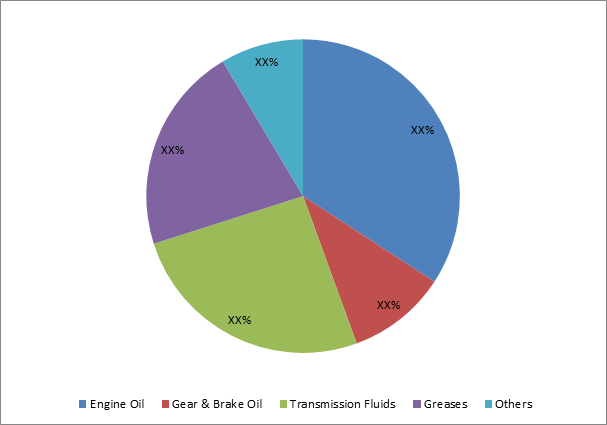
  • Based on application, the “Engine Oil” category, contributes to the largest revenue generation.
  • According to our primary respondents, the Coating Pretreatment market is set to grow annually at a rate of around 5%

logoKey Recommendations from Analysts

  • As per our Analysts, the Asia Pacific region is expected to fetch the largest market share based on the volume as well as the revenue. Asia Pacific holds more than 37% of the market share in total vehicle production which is expected to create significant demand for automotive lubricants in the forecasted time.
  • Increasing per capita income and increasing need for individualized transport options have guided car sales in many countries. Increasing motorcycle sales are also expected to further boost this growth over the forecast period.
  • Engine oil is estimated to fetch predominant demand owing to its use in all types of vehicles.
  • The demand from heavy commercial vehicles is estimated to create significant demand owing to the need for the lubricant per heavy commercial vehicle being higher than in other categories.
  • North America is expected to hold the second rank in total vehicle production followed by Europe which is projected to generate an ecosystem for the vehicle production-dependent market like automotive lubricants.

logoAutomotive Lubricant Market Share in 2019, by Application

Automotive Lubricants Market

To know more about this report | Request Free Sample Copy

The quantitative data is further underlined and reinforced by comprehensive qualitative data which comprises various across-the-board market dynamics. The rationales which directly or indirectly impact the Automotive Lubricants industry are exemplified through parameters such as growth drivers, restraints, challenges, and opportunities among other impacting factors.

Throughout our research report, we have encompassed all the proven models and tools of industry analysis and extensively illustrated all the key business strategies and business models adopted in the Automotive Lubricants industry. The report provides an all-inclusive and detailed competitive landscape prevalent in the Automotive Lubricants market.

The report utilizes established industry analysis tools and models such as Porter’s Five Forces framework to analyze and recognize critical business strategies adopted by various stakeholders involved in the entire value chain of the Automotive Lubricants industry. The Automotive Lubricants market report additionally employs SWOT analysis and PESTLE analysis models for further in-depth analysis.

The report study further includes an in-depth analysis of industry players' market shares and provides an overview of leading players' market positions in the Automotive Lubricants sector. Key strategic developments in the Automotive Lubricants market competitive landscape such as acquisitions & mergers, inaugurations of different products and services, partnerships & joint ventures, MoU agreements, VC & funding activities, R&D activities, and geographic expansion among other noteworthy activities by key players of the Automotive Lubricants market are appropriately highlighted in the report.

Automotive lubricating is used in motor vehicles, as transmission oils, engine oil, greases, and gear & brake oil. Automotive lubricants are also known as lubricants or lube. Automotive lubricants are a group of oils that are used to minimize friction, heat, and wear between mechanical components that are in contact.

Increasing per capita income and increasing need for individualized transport options have guided car sales in many countries. Increasing motorcycle sales are also expected to further boost this growth over the forecast period. It is also anticipated that the change in the trend toward green derivatives will drive the demand over the forecast period. There is also a predicted strong presence of regulatory organizations, such as EPA and REACH, to support the overall demand for bio-based lubricants.

The Automotive Lubricants market research report delivers an acute valuation and taxonomy of the Automotive Lubricants industry by practically splitting the market on the basis of different types, applications, and regions. Through the analysis of the historical and projected trends, all the segments and sub-segments were evaluated through the bottom-up approach, and different market sizes have been projected for FY 2020 to FY 2026.

The regional segmentation of the Automotive Lubricants industry includes the complete classification of all the major continents including North America, Latin America, Europe, Asia Pacific, and the Middle East & Africa. Further, country-wise data for the Automotive Lubricants industry is provided for the leading economies of the world.

The Automotive Lubricants market is segmented based on Type and Application. On the basis of type segmentation, the market is classified into type 1, type 2, and type 3. In terms of Application segmentation, the market is bifurcated into Application 1, Application 2, and Application 3.

logoReport Scope

Report Attribute

Details

Market Size in 2019

USD 78600 Million

Projected Market Size in 2026

USD 110600 Million

CAGR Growth Rate

5% CAGR

Base Year

2019

Forecast Years

2020-2026

Key Market Players

Idemitsu, Royal Dutch Shell Plc., Lukoil, Exxon Mobil Corporation, Burmah Castrol, Total S.A., BP Plc., Equilon, Chevron Corporation, Pennzoil-Quaker State, PetroChina Company Limited, Sinopec, Valvoline, BASF SE, Oil Libya, Indian Oil Corporation Ltd., KenolKobil, FUCHS Lubricants., Oryx Energies, and KMG Chemicals.others

Key Segment

By Base Oil, By Application, By Vehicle Type, By Region

Major Regions Covered

North America, Europe, Asia Pacific, Latin America, and the Middle East & Africa

Purchase Options

Request customized purchase options to meet your research needs. Explore purchase options

logoSome of the essential players operating in the Automotive Lubricants market, but not restricted include:

  •  Idemitsu
  •  Royal Dutch Shell Plc.
  •  Lukoil
  •  Exxon Mobil Corporation
  •  Burmah Castrol
  •  Total S.A.
  •  BP Plc.
  •  Equilon
  •  Chevron Corporation
  •  Pennzoil-Quaker State
  •  PetroChina Company Limited
  •  Sinopec
  •  Valvoline
  •  BASF SE
  •  Oil Libya
  •  Indian Oil Corporation Ltd.
  •  KenolKobil
  •  FUCHS Lubricants.
  •  Oryx Energies
  •  KMG Chemicals.

The taxonomy of the Automotive Lubricants industry by its scope and segmentation is as follows:

logo By Base Oil Segmentation Analysis (Customizable)

  • Mineral Oil Lubricants
  • Synthetic Lubricants
  • Semisynthetic Lubricants
  • Bio-Based Lubricants

logo By Application Segmentation Analysis (Customizable)

  • Engine Oil
  • Gear & Brake Oil
  • Transmission Fluids
  • Greases
  • Others

logo By Vehicle Type Segmentation Analysis (Customizable)

  • Passenger Cars
  • Light Commercial Vehicles (LCV)
  • Heavy Commercial Vehicles (HCV)
  • Others (Motorbikes)

logo Regional Segmentation Analysis (Customizable)

  • North America
    • The U.S.
    • Canada
  • Europe
    • Germany
    • The UK
    • France
    • Spain
    • Italy
    • Rest of Europe
  • Asia Pacific
    • China
    • Japan
    • India
    • South Korea
    • Southeast Asia
    • Rest of Asia Pacific
  • Latin America
    • Brazil
    • Mexico
    • Rest of Latin America
  • Middle East & Africa
    • GCC
    • South Africa
    • Rest of the Middle East & Africa

Table of Content

  1. CHAPTER 1. Executive Summary
  2. CHAPTER 2. Automotive Lubricants market – Base Oil Analysis
    1. 2.1. Global Automotive Lubricants Market – Base Oil Overview
    2. 2.2. Global Automotive Lubricants Market Share, by Base Oil, 2019 & 2026 (USD Million)
    3. 2.3. Global Automotive Lubricants Market share, by Base Oil, 2019 & 2026 (Kilo Tons)
    4. 2.4. Mineral Oil Lubricants
      1. 2.4.1. Global Mineral Oil Lubricants Automotive Lubricants Market, 2016-2026 (USD Million)
      2. 2.4.2. Global Mineral Oil Lubricants Automotive Lubricants Market, 2016-2026 (Kilo Tons)
    5. 2.5. Synthetic Lubricants
      1. 2.5.1. Global Synthetic Lubricants Automotive Lubricants Market, 2016-2026 (USD Million)
      2. 2.5.2. Global Synthetic Lubricants Automotive Lubricants Market, 2016-2026 (Kilo Tons)
    6. 2.6. Semisynthetic Lubricants
      1. 2.6.1. Global Semisynthetic Lubricants Automotive Lubricants Market, 2016-2026 (USD Million)
      2. 2.6.2. Global Semisynthetic Lubricants Automotive Lubricants Market, 2016-2026 (Kilo Tons)
    7. 2.7. Bio-Based Lubricants
      1. 2.7.1. Global Bio-Based Lubricants Automotive Lubricants Market, 2016-2026 (USD Million)
      2. 2.7.2. Global Bio-Based Lubricants Automotive Lubricants Market, 2016-2026 (Kilo Tons)
  3. CHAPTER 3. Automotive Lubricants market – Application Analysis
    1. 3.1. Global Automotive Lubricants Market – Application Overview
    2. 3.2. Global Automotive Lubricants Market Share, by Application, 2019 & 2026 (USD Million)
    3. 3.3. Global Automotive Lubricants Market share, by Application, 2019 & 2026 (Kilo Tons)
    4. 3.4. Engine Oil
      1. 3.4.1. Global Engine Oil Automotive Lubricants Market, 2016-2026 (USD Million)
      2. 3.4.2. Global Engine Oil Automotive Lubricants Market, 2016-2026 (Kilo Tons)
    5. 3.5. Gear & Brake Oil
      1. 3.5.1. Global Gear & Brake Oil Automotive Lubricants Market, 2016-2026 (USD Million)
      2. 3.5.2. Global Gear & Brake Oil Automotive Lubricants Market, 2016-2026 (Kilo Tons)
    6. 3.6. Transmission Fluids
      1. 3.6.1. Global Transmission Fluids Automotive Lubricants Market, 2016-2026 (USD Million)
      2. 3.6.2. Global Transmission Fluids Automotive Lubricants Market, 2016-2026 (Kilo Tons)
    7. 3.7. Greases
      1. 3.7.1. Global Greases Automotive Lubricants Market, 2016-2026 (USD Million)
      2. 3.7.2. Global Greases Automotive Lubricants Market, 2016-2026 (Kilo Tons)
    8. 3.8. Others
      1. 3.8.1. Global Others Automotive Lubricants Market, 2016-2026 (USD Million)
      2. 3.8.2. Global Others Automotive Lubricants Market, 2016-2026 (Kilo Tons)
  4. CHAPTER 4. Automotive Lubricants market – Transmission Fluids Analysis
    1. 4.1. Global Automotive Lubricants Market – Transmission Fluids Overview
    2. 4.2. Global Automotive Lubricants Market Share, by Transmission Fluids, 2019 & 2026 (USD Million)
    3. 4.3. Global Automotive Lubricants Market share, by Transmission Fluids, 2019 & 2026 (Kilo Tons)
    4. 4.4. Engine Oil
      1. 4.4.1. Global Engine Oil Automotive Lubricants Market, 2016-2026 (USD Million)
      2. 4.4.2. Global Engine Oil Automotive Lubricants Market, 2016-2026 (Kilo Tons)
    5. 4.5. Greases
      1. 4.5.1. Global Greases Automotive Lubricants Market, 2016-2026 (USD Million)
      2. 4.5.2. Global Greases Automotive Lubricants Market, 2016-2026 (Kilo Tons)
    6. 4.6. Gear & Brake Oil
      1. 4.6.1. Global Gear & Brake Oil Automotive Lubricants Market, 2016-2026 (USD Million)
      2. 4.6.2. Global Gear & Brake Oil Automotive Lubricants Market, 2016-2026 (Kilo Tons)
    7. 4.7. Others
      1. 4.7.1. Global Others Automotive Lubricants Market, 2016-2026 (USD Million)
      2. 4.7.2. Global Others Automotive Lubricants Market, 2016-2026 (Kilo Tons)
  5. CHAPTER 5. Automotive Lubricants market – Regional Analysis
    1. 5.1. Global Automotive Lubricants Market Regional Overview
    2. 5.2. Global Automotive Lubricants Market Share, by Region, 2019 & 2026 (Value)
    3. 5.3. Global Automotive Lubricants Market Share, by Region, 2019 & 2026 (Volume)
    4. 5.4. North America
      1. 5.4.1. North America Automotive Lubricants Market size and forecast, 2016-2026
      2. 5.4.2. North America Automotive Lubricants Market, by Country, 2019 - 2026 (USD Million)
      3. 5.4.3. North America Market size and forecast, 2016-2026 (Kilo Tons)
      4. 5.4.4. North America Automotive Lubricants Market, by Country, 2019 - 2026 (Kilo Tons)
      5. 5.4.5. North America Automotive Lubricants Market, by Base Oil, 2016-2026
      6. 5.4.6. North America Automotive Lubricants Market, by Application, 2016-2026
      7. 5.4.7. North America Automotive Lubricants Market, by Transmission Fluids, 2016-2026
      8. 5.4.8. U.S.
      9. 5.4.9. Canada
    5. 5.5. Europe
      1. 5.5.1. Europe Automotive Lubricants Market size and forecast, 2016-2026
      2. 5.5.2. Europe Automotive Lubricants Market, by Country, 2019 - 2026 (USD Million)
      3. 5.5.3. Europe Market size and forecast, 2016-2026 (Kilo Tons)
      4. 5.5.4. Europe Automotive Lubricants Market, by Country, 2019 - 2026 (Kilo Tons)
      5. 5.5.5. Europe Automotive Lubricants Market, by Base Oil, 2016-2026
      6. 5.5.6. Europe Automotive Lubricants Market, by Application, 2016-2026
      7. 5.5.7. Europe Automotive Lubricants Market, by Transmission Fluids, 2016-2026
      8. 5.5.8. Germany
      9. 5.5.9. France
      10. 5.5.10. U.K.
      11. 5.5.11. Italy
      12. 5.5.12. Spain
      13. 5.5.13. Rest of Europe
    6. 5.6. Asia Pacific
      1. 5.6.1. Asia Pacific Automotive Lubricants Market size and forecast, 2016-2026
      2. 5.6.2. Asia Pacific Automotive Lubricants Market, by Country, 2019 - 2026 (USD Million)
      3. 5.6.3. Asia Pacific Market size and forecast, 2016-2026 (Kilo Tons)
      4. 5.6.4. Asia Pacific Automotive Lubricants Market, by Country, 2019 - 2026 (Kilo Tons)
      5. 5.6.5. Asia Pacific Automotive Lubricants Market, by Base Oil, 2016-2026
      6. 5.6.6. Asia Pacific Automotive Lubricants Market, by Application, 2016-2026
      7. 5.6.7. Asia Pacific Automotive Lubricants Market, by Transmission Fluids, 2016-2026
      8. 5.6.8. China
      9. 5.6.9. Japan
      10. 5.6.10. India
      11. 5.6.11. South Korea
      12. 5.6.12. South-East Asia
      13. 5.6.13. Rest of Asia Pacific
    7. 5.7. Latin America
      1. 5.7.1. Latin America Automotive Lubricants Market size and forecast, 2016-2026
      2. 5.7.2. Latin America Automotive Lubricants Market, by Country, 2019 - 2026 (USD Million)
      3. 5.7.3. Latin America Market size and forecast, 2016-2026 (Kilo Tons)
      4. 5.7.4. Latin America Automotive Lubricants Market, by Country, 2019 - 2026 (Kilo Tons)
      5. 5.7.5. Latin America Automotive Lubricants Market, by Base Oil, 2016-2026
      6. 5.7.6. Latin America Automotive Lubricants Market, by Application, 2016-2026
      7. 5.7.7. Latin America Automotive Lubricants Market, by Transmission Fluids, 2016-2026
      8. 5.7.8. Brazil
      9. 5.7.9. Mexico
      10. 5.7.10. Rest of Latin America
    8. 5.8. The Middle-East and Africa
      1. 5.8.1. The Middle-East and Africa Automotive Lubricants Market size and forecast, 2016-2026
      2. 5.8.2. The Middle-East and Africa Automotive Lubricants Market, by Country, 2019 - 2026 (USD Million)
      3. 5.8.3. The Middle-East and Africa Market size and forecast, 2016-2026 (Kilo Tons)
      4. 5.8.4. The Middle-East and Africa Automotive Lubricants Market, by Country, 2019 - 2026 (Kilo Tons)
      5. 5.8.5. The Middle-East and Africa Automotive Lubricants Market, by Base Oil, 2016-2026
      6. 5.8.6. The Middle-East and Africa Automotive Lubricants Market, by Application, 2016-2026
      7. 5.8.7. The Middle-East and Africa Automotive Lubricants Market, by Transmission Fluids, 2016-2026
      8. 5.8.8. GCC Countries
      9. 5.8.9. South Africa
      10. 5.8.10. Rest of Middle-East Africa
  6. CHAPTER 6. Automotive Lubricants Production, Consumption, Export, Import by Regions
    1. 6.1. Global Automotive Lubricants production and revenue, 2016-2026 (USD Million) (Kilo Tons)
    2. 6.2. Global Import and Export Analysis, by Region
  7. CHAPTER 7. Automotive Lubricants market – Competitive Landscape
    1. 7.1. Competitor Market Share – Revenue
    2. 7.2. Market Concentration Rate Analysis, Top 3 and Top 5 Players
    3. 7.3. Competitor Market Share – Volume
    4. 7.4. Strategic Development
      1. 7.4.1. Acquisitions and Mergers
      2. 7.4.2. New Products
      3. 7.4.3. Research & Development Activities
  8. CHAPTER 8. Company Profiles
    1. 8.1. Idemitsu
      1. 8.1.1. Company Overview
      2. 8.1.2. Idemitsu Sales, Revenue, Price, and Gross Margin
      3. 8.1.3. Product portfolio
      4. 8.1.4. Recent initiatives
    2. 8.2. Royal Dutch Shell Plc.
      1. 8.2.1. Company Overview
      2. 8.2.2. Royal Dutch Shell Plc. Sales, Revenue, Price, and Gross Margin
      3. 8.2.3. Product portfolio
      4. 8.2.4. Recent initiatives
    3. 8.3. Lukoil
      1. 8.3.1. Company Overview
      2. 8.3.2. Lukoil Sales, Revenue, Price, and Gross Margin
      3. 8.3.3. Product portfolio
      4. 8.3.4. Recent initiatives
    4. 8.4. Exxon Mobil Corporation
      1. 8.4.1. Company Overview
      2. 8.4.2. Exxon Mobil Corporation Sales, Revenue, Price, and Gross Margin
      3. 8.4.3. Product portfolio
      4. 8.4.4. Recent initiatives
    5. 8.5. Burmah Castrol
      1. 8.5.1. Company Overview
      2. 8.5.2. Burmah Castrol Sales, Revenue, Price, and Gross Margin
      3. 8.5.3. Product portfolio
      4. 8.5.4. Recent initiatives
    6. 8.6. Total S.A., BP Plc.
      1. 8.6.1. Company Overview
      2. 8.6.2. Total S.A., BP Plc. Sales, Revenue, Price, and Gross Margin
      3. 8.6.3. Product portfolio
      4. 8.6.4. Recent initiatives
    7. 8.7. Equilon
      1. 8.7.1. Company Overview
      2. 8.7.2. Equilon Sales, Revenue, Price, and Gross Margin
      3. 8.7.3. Product portfolio
      4. 8.7.4. Recent initiatives
    8. 8.8. Chevron Corporation
      1. 8.8.1. Company Overview
      2. 8.8.2. Chevron Corporation Sales, Revenue, Price, and Gross Margin
      3. 8.8.3. Product portfolio
      4. 8.8.4. Recent initiatives
    9. 8.9. Pennzoil-Quaker State
      1. 8.9.1. Company Overview
      2. 8.9.2. Pennzoil-Quaker State Sales, Revenue, Price, and Gross Margin
      3. 8.9.3. Product portfolio
      4. 8.9.4. Recent initiatives
    10. 8.10. PetroChina Company Limited
      1. 8.10.1. Company Overview
      2. 8.10.2. PetroChina Company Limited Sales, Revenue, Price, and Gross Margin
      3. 8.10.3. Product portfolio
      4. 8.10.4. Recent initiatives
    11. 8.11. Sinopec
      1. 8.11.1. Company Overview
      2. 8.11.2. Sinopec Sales, Revenue, Price, and Gross Margin
      3. 8.11.3. Product portfolio
      4. 8.11.4. Recent initiatives
    12. 8.12. Valvoline, BASF SE
      1. 8.12.1. Company Overview
      2. 8.12.2. Valvoline, BASF SE Sales, Revenue, Price, and Gross Margin
      3. 8.12.3. Product portfolio
      4. 8.12.4. Recent initiatives
    13. 8.13. Oil Libya
      1. 8.13.1. Company Overview
      2. 8.13.2. Oil Libya Sales, Revenue, Price, and Gross Margin
      3. 8.13.3. Product portfolio
      4. 8.13.4. Recent initiatives
    14. 8.14. Indian Oil Corporation Ltd.
      1. 8.14.1. Company Overview
      2. 8.14.2. Indian Oil Corporation Ltd. Sales, Revenue, Price, and Gross Margin
      3. 8.14.3. Product portfolio
      4. 8.14.4. Recent initiatives
    15. 8.15. KenolKobil
      1. 8.15.1. Company Overview
      2. 8.15.2. KenolKobil Sales, Revenue, Price, and Gross Margin
      3. 8.15.3. Product portfolio
      4. 8.15.4. Recent initiatives
    16. 8.16. FUCHS Lubricants.
      1. 8.16.1. Company Overview
      2. 8.16.2. FUCHS Lubricants. Sales, Revenue, Price, and Gross Margin
      3. 8.16.3. Product portfolio
      4. 8.16.4. Recent initiatives
    17. 8.17. Oryx Energies
      1. 8.17.1. Company Overview
      2. 8.17.2. Oryx Energies Sales, Revenue, Price, and Gross Margin
      3. 8.17.3. Product portfolio
      4. 8.17.4. Recent initiatives
    18. 8.18. KMG Chemicals
      1. 8.18.1. Company Overview
      2. 8.18.2. KMG Chemicals Sales, Revenue, Price, and Gross Margin
      3. 8.18.3. Product portfolio
      4. 8.18.4. Recent initiatives
  9. CHAPTER 9. Automotive Lubricants — Industry Analysis
    1. 9.1. Introduction and Taxonomy
    2. 9.2. Automotive Lubricants Market – Key Trends
      1. 9.2.1. Market Drivers
      2. 9.2.2. Market Restraints
      3. 9.2.3. Market Opportunities
    3. 9.3. Value Chain Analysis
    4. 9.4. Key Mandates and Regulations
    5. 9.5. Technology Roadmap and Timeline
    6. 9.6. Automotive Lubricants market – Attractiveness Analysis
      1. 9.6.1. By Base Oil
      2. 9.6.2. By Application
      3. 9.6.3. By Transmission Fluids
      4. 9.6.4. By Region
  10. CHAPTER 10. Raw Material analysis
    1. 10.1. Automotive Lubricants Key Raw Material Analysis
      1. 10.1.1. Key Raw Materials
      2. 10.1.2. Price Trend of Key Raw Materials
    2. 10.2. Key Suppliers of Raw Materials
    3. 10.3. Proportion of Manufacturing Cost Structure
      1. 10.3.1. Raw Materials
      2. 10.3.2. Labor Cost
    4. 10.4. Manufacturing Expenses Analysis of Automotive Lubricants
  11. CHAPTER 11. Industrial Chain, Sourcing Strategy and Downstream Buyers
    1. 11.1. Automotive Lubricants Industrial Chain Analysis
    2. 11.2. Upstream Raw Materials Sourcing
      1. 11.2.1. Risk Mitigation:
      2. 11.2.2. Supplier Relationships:
      3. 11.2.3. Business Processes:
      4. 11.2.4. Securing the Product:
    3. 11.3. Raw Materials Sources of Automotive Lubricants Major Manufacturers in 2016
    4. 11.4. Downstream Buyers
    5. 11.5. Distributors/Traders List
  12. CHAPTER 12. Marketing Strategy Analysis, Distributors
    1. 12.1. Marketing Channel
    2. 12.2. Direct Marketing
    3. 12.3. Indirect Marketing
    4. 12.4. Marketing Channel Development Trend
    5. 12.5. Economic/Political Environmental Change
  13. CHAPTER 13. Report Conclusion
  14. CHAPTER 14. Research Approach & Methodology
    1. 14.1. Report Description
    2. 14.2. Research Scope
    3. 14.3. Research Methodology
      1. 14.3.1. Secondary Research
      2. 14.3.2. Primary Research
      3. 14.3.3. Models

      List of Figures

      FIG. 1 Global Automotive Lubricants Market, 2016-2026 (USD Million)
      FIG. 2 Global Automotive Lubricants Market Share, by Base Oil, 2019 & 2026 (USD Million)
      FIG. 3 Global Automotive Lubricants Market share, by Base Oil, 2019 & 2026 (Kilo Tons)
      FIG. 4 Global Mineral Oil Lubricants Automotive Lubricants Market, 2016-2026 (USD Million)
      FIG. 5 Global Mineral Oil Lubricants Automotive Lubricants  Market, 2016-2026 (Kilo Tons)
      FIG. 6 Global Synthetic Lubricants Automotive Lubricants Market, 2016-2026 (USD Million)
      FIG. 7 Global Synthetic Lubricants Automotive Lubricants  Market, 2016-2026 (Kilo Tons)
      FIG. 8 Global Semisynthetic Lubricants Automotive Lubricants Market, 2016-2026 (USD Million)
      FIG. 9 Global Semisynthetic Lubricants Automotive Lubricants  Market, 2016-2026 (Kilo Tons)
      FIG. 10 Global Bio-Based Lubricants Automotive Lubricants Market, 2016-2026 (USD Million)
      FIG. 11 Global Bio-Based Lubricants Automotive Lubricants  Market, 2016-2026 (Kilo Tons)
      FIG. 12 Global Automotive Lubricants Market Share, by Application, 2019 & 2026 (USD Million)
      FIG. 13 Global Automotive Lubricants Market share, by Application, 2019 & 2026 (Kilo Tons)
      FIG. 14 Global Engine Oil Automotive Lubricants Market, 2016-2026 (USD Million)
      FIG. 15 Global Engine Oil Automotive Lubricants  Market, 2016-2026 (Kilo Tons)
      FIG. 16 Global Gear & Brake Oil Automotive Lubricants Market, 2016-2026 (USD Million)
      FIG. 17 Global Gear & Brake Oil Automotive Lubricants  Market, 2016-2026 (Kilo Tons)
      FIG. 18 Global Transmission Fluids Automotive Lubricants Market, 2016-2026 (USD Million)
      FIG. 19 Global Transmission Fluids Automotive Lubricants  Market, 2016-2026 (Kilo Tons)
      FIG. 20 Global Greases Automotive Lubricants Market, 2016-2026 (USD Million)
      FIG. 21 Global Greases Automotive Lubricants  Market, 2016-2026 (Kilo Tons)
      FIG. 22 Global Others Automotive Lubricants Market, 2016-2026 (USD Million)
      FIG. 23 Global Others Automotive Lubricants  Market, 2016-2026 (Kilo Tons)
      FIG. 24 Global Automotive Lubricants Market Share, by Transmission Fluids, 2019 & 2026 (USD Million)
      FIG. 25 Global Automotive Lubricants Market share, by Transmission Fluids, 2019 & 2026 (Kilo Tons)
      FIG. 26 Global Engine Oil Automotive Lubricants Market, 2016-2026 (USD Million)
      FIG. 27 Global Engine Oil Automotive Lubricants  Market, 2016-2026 (Kilo Tons)
      FIG. 28 Global Greases Automotive Lubricants Market, 2016-2026 (USD Million)
      FIG. 29 Global Greases Automotive Lubricants  Market, 2016-2026 (Kilo Tons)
      FIG. 30 Global Gear & Brake Oil Automotive Lubricants Market, 2016-2026 (USD Million)
      FIG. 31 Global Gear & Brake Oil Automotive Lubricants  Market, 2016-2026 (Kilo Tons)
      FIG. 32 Global Others Automotive Lubricants Market, 2016-2026 (USD Million)
      FIG. 33 Global Others Automotive Lubricants  Market, 2016-2026 (Kilo Tons)
      FIG. 34 Global Automotive Lubricants Market Share, by Region, 2019 & 2026
      FIG. 35 Global Automotive Lubricants Market Share, by Region, 2019 & 2026
      FIG. 36 North America Automotive Lubricants Market, 2016-2026
      FIG. 37 North America Automotive Lubricants  Market, 2016-2026 (Kilo Tons)
      FIG. 38 U.S. Automotive Lubricants Market, 2016-2026
      FIG. 39 U.S. Automotive Lubricants  Market, 2016-2026 (Kilo Tons)
      FIG. 40 Canada Automotive Lubricants Market, 2016-2026
      FIG. 41 Canada Automotive Lubricants  Market, 2016-2026 (Kilo Tons)
      FIG. 42 Europe Automotive Lubricants Market, 2016-2026
      FIG. 43 Europe Automotive Lubricants  Market, 2016-2026 (Kilo Tons)
      FIG. 44 Germany Automotive Lubricants Market, 2016-2026
      FIG. 45 Germany Automotive Lubricants  Market, 2016-2026 (Kilo Tons)
      FIG. 46 France Automotive Lubricants Market, 2016-2026
      FIG. 47 France Automotive Lubricants  Market, 2016-2026 (Kilo Tons)
      FIG. 48 U.K. Automotive Lubricants Market, 2016-2026
      FIG. 49 U.K. Automotive Lubricants  Market, 2016-2026 (Kilo Tons)
      FIG. 50 Italy Automotive Lubricants Market, 2016-2026
      FIG. 51 Italy Automotive Lubricants  Market, 2016-2026 (Kilo Tons)
      FIG. 52 Spain Automotive Lubricants Market, 2016-2026
      FIG. 53 Spain Automotive Lubricants  Market, 2016-2026 (Kilo Tons)
      FIG. 54 Rest of Europe Automotive Lubricants Market, 2016-2026
      FIG. 55 Rest of Europe Automotive Lubricants  Market, 2016-2026 (Kilo Tons)
      FIG. 56 Asia Pacific Automotive Lubricants Market, 2016-2026
      FIG. 57 Asia Pacific Automotive Lubricants  Market, 2016-2026 (Kilo Tons)
      FIG. 58 China Automotive Lubricants Market, 2016-2026
      FIG. 59 China Automotive Lubricants  Market, 2016-2026 (Kilo Tons)
      FIG. 60 Japan Automotive Lubricants Market, 2016-2026
      FIG. 61 Japan Automotive Lubricants  Market, 2016-2026 (Kilo Tons)
      FIG. 62 India Automotive Lubricants Market, 2016-2026
      FIG. 63 India Automotive Lubricants  Market, 2016-2026 (Kilo Tons)
      FIG. 64 South  Korea Automotive Lubricants Market, 2016-2026
      FIG. 65 South  Korea Automotive Lubricants  Market, 2016-2026 (Kilo Tons)
      FIG. 66 South-East Asia Automotive Lubricants Market, 2016-2026
      FIG. 67 South-East Asia Automotive Lubricants  Market, 2016-2026 (Kilo Tons)
      FIG. 68 Rest of Asia Pacific Automotive Lubricants Market, 2016-2026
      FIG. 69 Rest of Asia Pacific Automotive Lubricants  Market, 2016-2026 (Kilo Tons)
      FIG. 70 Latin America Automotive Lubricants Market, 2016-2026
      FIG. 71 Latin America Automotive Lubricants  Market, 2016-2026 (Kilo Tons)
      FIG. 72 Brazil Automotive Lubricants Market, 2016-2026
      FIG. 73 Brazil Automotive Lubricants  Market, 2016-2026 (Kilo Tons)
      FIG. 74 Mexico Automotive Lubricants Market, 2016-2026
      FIG. 75 Mexico Automotive Lubricants  Market, 2016-2026 (Kilo Tons)
      FIG. 76 Rest of Latin America Automotive Lubricants Market, 2016-2026
      FIG. 77 Rest of Latin America Automotive Lubricants  Market, 2016-2026 (Kilo Tons)
      FIG. 78 The Middle-East and Africa Automotive Lubricants Market, 2016-2026
      FIG. 79 The Middle-East and Africa Automotive Lubricants  Market, 2016-2026 (Kilo Tons)
      FIG. 80 GCC Countries Automotive Lubricants Market, 2016-2026
      FIG. 81 GCC Countries Automotive Lubricants  Market, 2016-2026 (Kilo Tons)
      FIG. 82 South Africa Automotive Lubricants Market, 2016-2026
      FIG. 83 South Africa Automotive Lubricants  Market, 2016-2026 (Kilo Tons)
      FIG. 84 Rest of Middle-East Africa Automotive Lubricants Market, 2016-2026
      FIG. 85 Rest of Middle-East Africa Automotive Lubricants  Market, 2016-2026 (Kilo Tons)
      FIG. 86 Global Automotive Lubricants production and revenue, 2016-2026 (USD Million) (Kilo Tons)
      FIG. 87 North America Automotive Lubricants production and revenue, 2016-2026 (USD Million) (Kilo Tons)
      FIG. 88 Europe Automotive Lubricants production and revenue, 2016-2026 (USD Million) (Kilo Tons)
      FIG. 89 Asia Pacific Automotive Lubricants production and revenue, 2016-2026 (USD Million) (Kilo Tons)
      FIG. 90 Latin America Automotive Lubricants production and revenue, 2016-2026 (USD Million) (Kilo Tons)
      FIG. 91 Middle East and Africa Automotive Lubricants production and revenue, 2016-2026 (USD Million) (Kilo Tons)
      FIG. 92 Competitor Market Share – Revenue
      FIG. 93 Competitor Market Share – Volume
      FIG. 94 Idemitsu Revenue and Growth Rate
      FIG. 95 Idemitsu Market Share
      FIG. 96 Royal Dutch Shell Plc. Revenue and Growth Rate
      FIG. 97 Royal Dutch Shell Plc. Market Share
      FIG. 98 Lukoil Revenue and Growth Rate
      FIG. 99 Lukoil Market Share
      FIG. 100 Exxon Mobil Corporation Revenue and Growth Rate
      FIG. 101 Exxon Mobil Corporation Market Share
      FIG. 102 Burmah Castrol Revenue and Growth Rate
      FIG. 103 Burmah Castrol Market Share
      FIG. 104 Total S.A., BP Plc. Revenue and Growth Rate
      FIG. 105 Total S.A., BP Plc. Market Share
      FIG. 106 Equilon Revenue and Growth Rate
      FIG. 107 Equilon Market Share
      FIG. 108 Chevron Corporation Revenue and Growth Rate
      FIG. 109 Chevron Corporation Market Share
      FIG. 110 Pennzoil-Quaker State Revenue and Growth Rate
      FIG. 111 Pennzoil-Quaker State Market Share
      FIG. 112 PetroChina Company Limited Revenue and Growth Rate
      FIG. 113 PetroChina Company Limited Market Share
      FIG. 114 Sinopec Revenue and Growth Rate
      FIG. 115 Sinopec Market Share
      FIG. 116 Valvoline, BASF SE Revenue and Growth Rate
      FIG. 117 Valvoline, BASF SE Market Share
      FIG. 118 Oil Libya Revenue and Growth Rate
      FIG. 119 Oil Libya Market Share
      FIG. 120 Indian Oil Corporation Ltd. Revenue and Growth Rate
      FIG. 121 Indian Oil Corporation Ltd. Market Share
      FIG. 122 KenolKobil Revenue and Growth Rate
      FIG. 123 KenolKobil Market Share
      FIG. 124 FUCHS Lubricants. Revenue and Growth Rate
      FIG. 125 FUCHS Lubricants. Market Share
      FIG. 126 Oryx Energies Revenue and Growth Rate
      FIG. 127 Oryx Energies Market Share
      FIG. 128 KMG Chemicals Revenue and Growth Rate
      FIG. 129 KMG Chemicals Market Share
      FIG. 130 Market Dynamics
      FIG. 131 Global Automotive Lubricants – Value Chain Analysis
      FIG. 132 Key Mandates and Regulations
      FIG. 133 Technology Roadmap and Timeline
      FIG. 134 Market Attractiveness Analysis – By Base Oil
      FIG. 135 Market Attractiveness Analysis – By Application
      FIG. 136 Market Attractiveness Analysis – By Transmission Fluids
      FIG. 137 Market Attractiveness Analysis – By Region
      FIG. 138 Manufacturing Cost Structure of Automotive Lubricants
      FIG. 139 Automotive Lubricants Industrial Chain Analysis
      FIG. 140 Market Channel
      FIG. 141 Marketing Channel Development Trend
      FIG. 142 Growth in World Gross Product, 2008-2019

      List of Tables

      TABLE 1 Global Automotive Lubricants market, 2019 & 2026 (USD Million)
      TABLE 2 Global Automotive Lubricants market, by Base Oil, 2016-2026 (USD Million)
      TABLE 3 Global Automotive Lubricants market, by Base Oil, 2016-2026 (Kilo Tons)
      TABLE 4 Global Automotive Lubricants market, by Application, 2016-2026 (USD Million)
      TABLE 5 Global Automotive Lubricants market, by Application, 2016-2026 (Kilo Tons)
      TABLE 6 Global Automotive Lubricants market, by Transmission Fluids, 2016-2026 (USD Million)
      TABLE 7 Global Automotive Lubricants market, by Transmission Fluids, 2016-2026 (Kilo Tons)
      TABLE 8 Global Automotive Lubricants market, by region, 2016-2026 (USD Million)
      TABLE 9 Global Automotive Lubricants market, by region, 2016-2026 (Kilo Tons)
      TABLE 10 North America Automotive Lubricants Market, by Base Oil, 2016-2026 (USD Million)
      TABLE 11 North America Automotive Lubricants Market, by Base Oil, 2016-2026 (Kilo Tons)
      TABLE 12 North America Automotive Lubricants Market, by Application, 2016-2026 (USD Million)
      TABLE 13 North America Automotive Lubricants Market, by Application, 2016-2026 (Kilo Tons)
      TABLE 14 North America Automotive Lubricants Market, by Transmission Fluids, 2016-2026 (USD Million)
      TABLE 15 North America Automotive Lubricants Market, by Transmission Fluids, 2016-2026 (Kilo Tons)
      TABLE 16 Europe Automotive Lubricants Market, by Base Oil, 2016-2026 (USD Million)
      TABLE 17 Europe Automotive Lubricants Market, by Base Oil, 2016-2026 (Kilo Tons)
      TABLE 18 Europe Automotive Lubricants Market, by Application, 2016-2026 (USD Million)
      TABLE 19 Europe Automotive Lubricants Market, by Application, 2016-2026 (Kilo Tons)
      TABLE 20 Europe Automotive Lubricants Market, by Transmission Fluids, 2016-2026 (USD Million)
      TABLE 21 Europe Automotive Lubricants Market, by Transmission Fluids, 2016-2026 (Kilo Tons)
      TABLE 22 Asia Pacific Automotive Lubricants Market, by Base Oil, 2016-2026 (USD Million)
      TABLE 23 Asia Pacific Automotive Lubricants Market, by Base Oil, 2016-2026 (Kilo Tons)
      TABLE 24 Asia Pacific Automotive Lubricants Market, by Application, 2016-2026 (USD Million)
      TABLE 25 Asia Pacific Automotive Lubricants Market, by Application, 2016-2026 (Kilo Tons)
      TABLE 26 Asia Pacific Automotive Lubricants Market, by Transmission Fluids, 2016-2026 (USD Million)
      TABLE 27 Asia Pacific Automotive Lubricants Market, by Transmission Fluids, 2016-2026 (Kilo Tons)
      TABLE 28 Latin America Automotive Lubricants Market, by Base Oil, 2016-2026 (USD Million)
      TABLE 29 Latin America Automotive Lubricants Market, by Base Oil, 2016-2026 (Kilo Tons)
      TABLE 30 Latin America Automotive Lubricants Market, by Application, 2016-2026 (USD Million)
      TABLE 31 Latin America Automotive Lubricants Market, by Application, 2016-2026 (Kilo Tons)
      TABLE 32 Latin America Automotive Lubricants Market, by Transmission Fluids, 2016-2026 (USD Million)
      TABLE 33 Latin America Automotive Lubricants Market, by Transmission Fluids, 2016-2026 (Kilo Tons)
      TABLE 34 The Middle-East and Africa Automotive Lubricants Market, by Base Oil, 2016-2026 (USD Million)
      TABLE 35 The Middle-East and Africa Automotive Lubricants Market, by Base Oil, 2016-2026 (Kilo Tons)
      TABLE 36 The Middle-East and Africa Automotive Lubricants Market, by Application, 2016-2026 (USD Million)
      TABLE 37 The Middle-East and Africa Automotive Lubricants Market, by Application, 2016-2026 (Kilo Tons)
      TABLE 38 The Middle-East and Africa Automotive Lubricants Market, by Transmission Fluids, 2016-2026 (USD Million)
      TABLE 39 The Middle-East and Africa Automotive Lubricants Market, by Transmission Fluids, 2016-2026 (Kilo Tons)
      TABLE 40 North America Automotive Lubricants Production, Consumption, Export, Import, 2016-2019
      TABLE 41 Europe Automotive Lubricants Production, Consumption, Export, Import, 2016-2019
      TABLE 42 Asia Pacific Automotive Lubricants Production, Consumption, Export, Import, 2016-2019
      TABLE 43 Latin America Automotive Lubricants Production, Consumption, Export, Import, 2016-2019
      TABLE 44 Middle East & Africa Automotive Lubricants Production, Consumption, Export, Import, 2016-2019
      TABLE 45 Global Automotive Lubricants Market - Company Revenue Analysis 2016-2019 (USD Million)
      TABLE 46 Global Automotive Lubricants Market - Company Revenue Share Analysis 2016-2019(%)
      TABLE 47 Global Automotive Lubricants Market - Company Volume Analysis 2016-2019 (Kilo Tons)
      TABLE 48 Global Automotive Lubricants Market - Company Volume Share Analysis 2016-2019(%)
      TABLE 49 Acquisitions and Mergers
      TABLE 50 New Product/Service Launch
      TABLE 51 Research & Development Activities
      TABLE 52 Market Drivers
      TABLE 53 Market Restraints
      TABLE 54 Market Opportunities
      TABLE 55 Production Base and Market Concentration Rate of Raw Material
      TABLE 56 Key Suppliers of Raw Materials
      TABLE 57 Raw Materials Sources of Automotive Lubricants Major Manufacturers in 2016
      TABLE 58 Major Buyers of Automotive Lubricants
      TABLE 59 Distributors/Traders of Automotive Lubricants by Region

Industry Major Market Players

  •  Idemitsu
  •  Royal Dutch Shell Plc.
  •  Lukoil
  •  Exxon Mobil Corporation
  •  Burmah Castrol
  •  Total S.A.
  •  BP Plc.
  •  Equilon
  •  Chevron Corporation
  •  Pennzoil-Quaker State
  •  PetroChina Company Limited
  •  Sinopec
  •  Valvoline
  •  BASF SE
  •  Oil Libya
  •  Indian Oil Corporation Ltd.
  •  KenolKobil
  •  FUCHS Lubricants.
  •  Oryx Energies
  •  KMG Chemicals.