Search Market Research Report

Discover Our Latest Reports
Discover Our Featured Reports
Discover Top Selling Reports

Automotive Ethernet Market Size, Share Global Analysis Report, 2021 – 2026

report img

Automotive Ethernet Market By Component (Hardware, Software, & Services), By Bandwidth (10 Mbps, 100 Mbps, 1 Gbps, & 2.5/5/10 Gbps), By Application (Advanced Driver Assistance Systems (ADAS), Infotainment, Powertrain, Body & Comfort, & Chassis), By Vehicle Type (Passenger Cars, Commercial Cars, & Farming & Off-Highway Vehicles), And By Regions - Global & Regional Industry Perspective, Comprehensive Analysis, and Forecast 2021 – 2026

Industry Insights

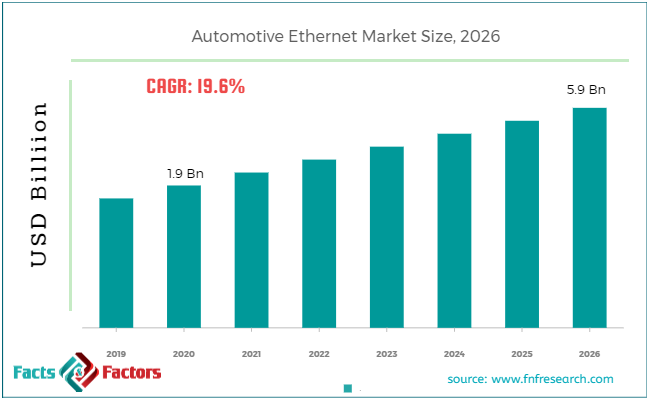
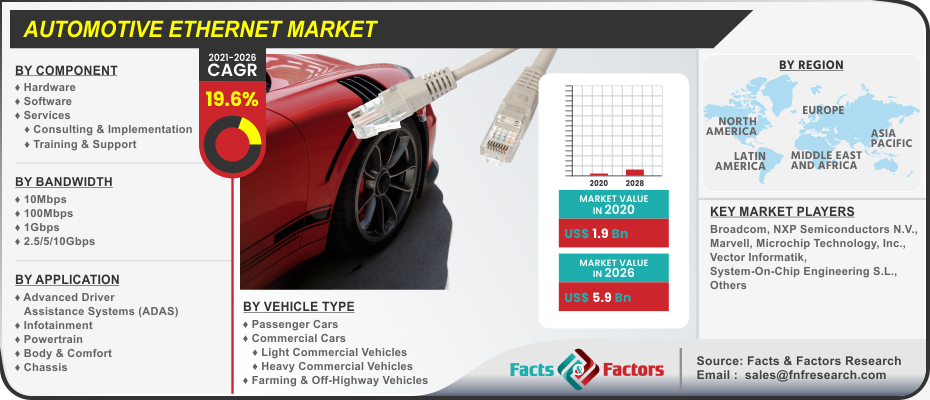
[196+ Pages Report] The latest finding surrounding the “Global Automotive Ethernet Market”  published by Facts & Factors offers a neatly packaged and comprehensive read. We at Facts & Factors projected the global automotive ethernet market to value USD 5.9 Billion by 2026 with a growth rate of 19.6% CAGR from an initial value of USD 1.9 Billion in the year 2020.

Automotive Ethernet Market Size

To know more about this report | Request Free Sample Copy

logoKey Insights from Primary Research

  • As per our primary respondents, the global automotive Ethernetis set to grow annually at a rate of around 20%
  • It was established through primary research that the automotive Ethernet market was valued at around USD 1700 Million in 2019
  • Europe leads the global automotive Ethernet market in 2019. However, Asia Pacific is predicted to overtake Europe by the end of 2024.
  • The hardware components segment accounted for the largest share and is predicted to continue its dominance with 47% in 2026.
  • Based on the application, ADAS accounted for 41% of the revenue share in 2019.

logoKey Recommendations from Analysts

  • As per our analysts,the global automotive Ethernet market is set to grow with a CAGR OF 19.6 % from the years 2020 to 2026.
  • The rise in demand for infotainment and advanced driver-assistance systems is predicted to be the key driving factor for the global automotive Ethernet market in the analysis period.
  • Our team of analysts has identified, the infotainment segment is expected to be the fastest-growing application segment for the global automotive Ethernet market owing to rising need higher Bandwidth and low latency to increase adoption of Ethernet in infotainment systems. Moreover, the emergence of intelligent infotainment systems is making the car an extension of their owner‘s digital lifestyle is predicted to open massive opportunities to market players in the coming years.
  • In recent years, autonomous-vehicle technology growths from craving driver assistance to full autonomy, and driverless cars are expected to become a reality soon. With these weighty benefits, including increased personal safety, mobility for no drivers, time-saving for drivers, reduced transportation costs, and decreased environmental harm. Moreover, it will also lead to radical shifts in value chains.

logo
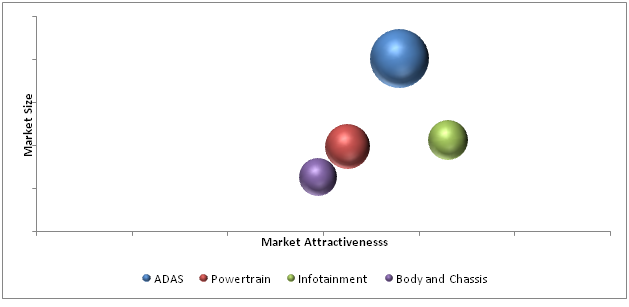
Market Attractiveness – By Application

Automotive-Ethernet-Market

To know more about this report | Request Free Sample Copy

logoMarket Overview

Automotive ethernet refers to the set of protocols and equipment that is the physical endowment of networking which is used for connecting components in a car with the help of a wired network. Ethernet often refers to a wider range of functions such as smartphone connectivity, navigation, high-powered infotainment systems, and driver safety systems, among others. These systems are specifically equipped for meeting the demands for enabling rapid communication and faster data allotment among users.

logoIndustry Growth Factors

The global automotive Ethernet market is expected to be occupied by contributing factors such as the rising prevalence of electric vehicles on a global purview coupled with rising government initiatives for electrification of the current generation of automobiles to name a few.

Additionally, the rising deployment of advanced driver assistant systems (ADAS) coupled with decreasing cost of ethernet equipment is expected to increase the footprint of the global automotive Ethernet market during the advent of the forecast period.

Moreover, the integration of ethernet for high-performance navigation systems and high-end entertainment &telematics to offer better and more efficient data transfer is expected to fuel the growth of the global automotive Ethernet market during the advent of the forecast.

The global automotive Ethernet market is expected to be driven by the integration of IoT in automotive ethernet coupled with the proliferation of high bandwidth ethernet for the emergence of connected cars to name a few. Factors pertaining to reduced labor costs coupled with minimum latency due to the rising technological advancements are expected to push the boundaries of the global automotive Ethernet market during the advent of the forecast period.

However, the rising complexities and intricacy coupled with difficulty in the integration of automotive ethernet equipment toward the older generation of automobiles are expected to hamper the growth of the global automotive Ethernet market during the advent of the forecast period.

Automotive Ethernet Market

To know more about this report | Request Free Sample Copy

logoSegmentation Analysis

The global automotive ethernet market can be segmented into components, bandwidth, application, vehicle type, and region.

On the basis of components, the global automotive Ethernet market is divided into hardware, software, and services. The services segment is expected to witness the largest market share during the advent of the forecast owing to stronger demand from OEMs toward simplifying in-vehicle networks coupled with the rising incidences of challenges faced by the implementation of ethernet for training and support services to name a few.

The global automotive Ethernet market is segmented into 10Mbps, 100Mbps, 1Gbps, and 2.5/5/10Gbps on the basis of bandwidth. The  1Gbps category is expected to witness the largest market share during the advent of the forecast owing to the rising demand for stronger bandwidth coupled with lower latency to name a few. Based on application, the global automotive Ethernet market is fragmented into advanced driver assistance systems (ADAS), infotainment, powertrain, body & comfort, and chassis.

The ADAS is expected to witness the largest market share during the advent of the forecast owing to a shifting tradition between consumers’ preference for a strong and fuel-efficient vehicle coupled with the rapid increase in the integration of high-tech devices from OEMs to name a few. Based on vehicle type, the global automotive Ethernet market is categorized into passenger cars, commercial cars, and farming & off-highway vehicles. The passenger vehicles segment is expected to be increasing vehicular production coupled with rising disposable income among consumers and rising need for private transportation to name a few.

logo Report Scope

Report Attribute

Details

Market Size in 2020

USD 1.9 Billion

Projected Market Size in 2026

USD 5.9 Billion

CAGR Growth Rate

19.6% CAGR

Base Year

2020

Forecast Years

2021-2026

Key Market Players

Broadcom, NXP Semiconductors N.V., Marvell, Microchip Technology, Inc., Vector Informatik, System-On-Chip Engineering S.L., Molex LLC, Texas Instruments, Cadence Design Systems, Inc., and TTTech Auto AG., among others.

Key Segments

Components, Bandwidth, Applications, Vehicle Types, and Region

Major Regions Covered

North America, Europe, Asia Pacific, Latin America, and Middle East & Africa

Purchase Options

Request customized purchase options to meet your research needs. Explore purchase options

logo Regional Analysis

Asia-Pacific is expected to witness the largest market share during the advent of the forecast period owing to the rising demand for automotive in the region coupled with rising technological innovation to name a few. Additionally, stable socio-economic condition coupled with the presence of massive production hubs such as China and India is expected to increase the footprint of the automotive ethernet market during the advent of the forecast period.

Rising per capita income among consumers coupled with an increasing number of OEMs is expected to push the boundaries of the automotive ethernet market to a higher boundary. Moreover, the penetration of international players in the region and favorable government policies are further expected to fuel the growth of the automotive ethernet market during the advent of the forecast period.

logo Competitive Players

The key market participants in the global automotive Ethernet market are:

  • Broadcom
  • NXP Semiconductors N.V.
  • Marvell
  • Microchip Technology Inc.
  • Vector Informatik
  • System-On-Chip Engineering S.L.
  • Molex LLC
  • Texas Instruments
  • Cadence Design Systems Inc.
  • TTTech Auto AG.
  • Excelforce
  • Spirent Communications
  • Aukua Systems Inc.
  • RUETZ SYSTEM SOLUTIONS
  • Rohde & Schwarz

logo By Component Segment Analysis

  • Hardware
  • Software
  • Services
    • Consulting & Implementation
    • Training & Support

logo By Bandwidth Segment Analysis

  • 10Mbps
  • 100Mbps
  • 1Gbps
  • 2.5/5/10Gbps

logo By Application Segment Analysis

  • Advanced Driver Assistance Systems (ADAS)
  • Infotainment
  • Powertrain
  • Body & Comfort
  • Chassis

logo By Vehicle Type Segment Analysis

  • Passenger Cars
  • Commercial Cars
    • Light Commercial Vehicles
    • Heavy Commercial Vehicles
  • Farming & Off-Highway Vehicles

logo By Regional Segment Analysis

  • North America
    • U.S.
    • Canada
  • Europe
    • UK
    • France
    • Germany
    • Italy
    • Spain
    • Rest of Europe
  • Asia Pacific
    • China
    • Japan
    • India
    • South Korea
    • Southeast Asia
    • Rest of Asia Pacific
  • Latin America
    • Brazil
    • Mexico
    • Rest of Latin America
  • Middle East and Africa
    • GCC Countries
    • South Africa
    • Rest of MEA

Table of Content

  1. Chapter 1 Executive Summary
    1. 1.1. Introduction of Automotive Ethernet
    2. 1.2. Global Automotive Ethernet Market, 2019 & 2026 (USD Billion)
    3. 1.3. Global Automotive Ethernet Market, 2016 – 2026 (USD Billion)
    4. 1.4. Global Automotive Ethernet Market Absolute Revenue Opportunity, 2016 – 2026 (USD Billion)
    5. 1.5. Global Automotive Ethernet Market Incremental Revenue Opportunity, 2020 – 2026 (USD Billion)
  2. Chapter 2 Automotive Ethernet Market – Component Analysis
    1. 2.1. Global Automotive Ethernet Market – Component Overview
    2. 2.2. Global Automotive Ethernet Market Share, by Component, 2019 & 2026 (USD Billion)
    3. 2.3. Hardware
      1. 2.3.1. Global Hardware Automotive Ethernet Market, 2016 – 2026 (USD Billion)
    4. 2.4. Software
      1. 2.4.1. Global Software Automotive Ethernet Market, 2016 – 2026 (USD Billion)
    5. 2.5. Services
      1. 2.5.1. Global Services Automotive Ethernet Market, 2016 – 2026 (USD Billion)
  3. Chapter 3 Automotive Ethernet Market – Bandwidth Analysis
    1. 3.1. Global Automotive Ethernet Market – Bandwidth Overview
    2. 3.2. Global Automotive Ethernet Market Share, by Bandwidth, 2019 & 2026 (USD Billion)
    3. 3.3. 10Mbps
      1. 3.3.1. Global 10Mbps Automotive Ethernet Market, 2016 – 2026 (USD Billion)
    4. 3.4. 100Mbps
      1. 3.4.1. Global 100Mbps Automotive Ethernet Market, 2016 – 2026 (USD Billion)
    5. 3.5. 1Gbps
      1. 3.5.1. Global 1Gbps Automotive Ethernet Market, 2016 – 2026 (USD Billion)
      2. 3.6. 2.5/5/10Gbps
      3. 3.6.1. Global 2.5/5/10Gbps Automotive Ethernet Market, 2016 – 2026 (USD Billion)
  4. Chapter 4 Automotive Ethernet Market – Application Analysis
    1. 4.1. Global Automotive Ethernet Market – Application Overview
    2. 4.2. Global Automotive Ethernet Market Share, by Application, 2019 & 2026 (USD Billion)
    3. 4.3. Advanced Driver Assistance Systems (ADAS)
      1. 4.3.1. Global Advanced Driver Assistance Systems (ADAS) Automotive Ethernet Market, 2016 – 2026 (USD Billion)
    4. 4.4. Infotainment
      1. 4.4.1. Global Infotainment Automotive Ethernet Market, 2016 – 2026 (USD Billion)
    5. 4.5. Powertrain
      1. 4.5.1. Global Powertrain Automotive Ethernet Market, 2016 – 2026 (USD Billion)
    6. 4.6. Body & Comfort
      1. 4.6.1. Global Body & Comfort Automotive Ethernet Market, 2016 – 2026 (USD Billion)
    7. 4.7. Others
      1. 4.7.1. Global Others Automotive Ethernet Market, 2016 – 2026 (USD Billion)
  5. Chapter 5 Automotive Ethernet Market – Vehicle Type Analysis
    1. 5.1. Global Automotive Ethernet Market – Vehicle Type Overview
    2. 5.2. Global Automotive Ethernet Market Share, by Vehicle Type, 2019 & 2026 (USD Billion)
    3. 5.3. Passenger Cars
      1. 5.3.1. Global Passenger Cars Automotive Ethernet Market, 2016 – 2026 (USD Billion)
    4. 5.4. Commercial Cars
      1. 5.4.1. Global Commercial Cars Automotive Ethernet Market, 2016 – 2026 (USD Billion)
    5. 5.5. Farming & Off-Highway Vehicles
      1. 5.5.1. Global Farming & Off-Highway Vehicles Automotive Ethernet Market, 2016 – 2026 (USD Billion)
  6. Chapter 6 Automotive Ethernet Market – Regional Analysis
    1. 6.1. Global Automotive Ethernet Market Regional Overview
    2. 6.2. Global Automotive Ethernet Market Share, by Region, 2019 & 2026 (USD Billion)
    3. 6.3. North America
      1. 6.3.1. North America Automotive Ethernet Market, 2016 – 2026 (USD Billion)
        1. 6.3.1.1. North America Automotive Ethernet Market, by Country, 2016 - 2026 (USD Billion)
      2. 6.3.2. North America Automotive Ethernet Market, by Component, 2016 – 2026
        1. 6.3.2.1. North America Automotive Ethernet Market, by Component, 2016 – 2026 (USD Billion)
      3. 6.3.3. North America Automotive Ethernet Market, by Bandwidth, 2016 – 2026
        1. 6.3.3.1. North America Automotive Ethernet Market, by Bandwidth, 2016 – 2026 (USD Billion)
      4. 6.3.4. North America Automotive Ethernet Market, by Application, 2016 – 2026
        1. 6.3.4.1. North America Automotive Ethernet Market, by Application, 2016 – 2026 (USD Billion)
      5. 6.3.5. North America Automotive Ethernet Market, by Vehicle Type, 2016 – 2026
        1. 6.3.5.1. North America Automotive Ethernet Market, by Vehicle Type, 2016 – 2026 (USD Billion)
      6. 6.3.6. U.S.
        1. 6.3.6.1. U.S. Automotive Ethernet Market, 2016 – 2026 (USD Billion)
      7. 6.3.7. Canada
        1. 6.3.7.1. Canada Automotive Ethernet Market, 2016 – 2026 (USD Billion)
    4. 6.4. Europe
      1. 6.4.1. Europe Automotive Ethernet Market, 2016 – 2026 (USD Billion)
        1. 6.4.1.1. Europe Automotive Ethernet Market, by Country, 2016 - 2026 (USD Billion)
      2. 6.4.2. Europe Automotive Ethernet Market, by Component, 2016 – 2026
        1. 6.4.2.1. Europe Automotive Ethernet Market, by Component, 2016 – 2026 (USD Billion)
      3. 6.4.3. Europe Automotive Ethernet Market, by Bandwidth, 2016 – 2026
        1. 6.4.3.1. Europe Automotive Ethernet Market, by Bandwidth, 2016 – 2026 (USD Billion)
      4. 6.4.4. Europe Automotive Ethernet Market, by Application, 2016 – 2026
        1. 6.4.4.1. Europe Automotive Ethernet Market, by Application, 2016 – 2026 (USD Billion)
      5. 6.4.5. Europe Automotive Ethernet Market, by Vehicle Type, 2016 – 2026
        1. 6.4.5.1. Europe Automotive Ethernet Market, by Vehicle Type, 2016 – 2026 (USD Billion)
      6. 6.4.6. Germany
        1. 6.4.6.1. Germany Automotive Ethernet Market, 2016 – 2026 (USD Billion)
      7. 6.4.7. France
        1. 6.4.7.1. France Automotive Ethernet Market, 2016 – 2026 (USD Billion)
      8. 6.4.8. U.K.
        1. 6.4.8.1. U.K. Automotive Ethernet Market, 2016 – 2026 (USD Billion)
      9. 6.4.9. Italy
        1. 6.4.9.1. Italy Automotive Ethernet Market, 2016 – 2026 (USD Billion)
      10. 6.4.10. Spain
        1. 6.4.10.1. Spain Automotive Ethernet Market, 2016 – 2026 (USD Billion)
      11. 6.4.11. Rest of Europe
        1. 6.4.11.1. Rest of Europe Automotive Ethernet Market, 2016 – 2026 (USD Billion)
    5. 6.5. Asia Pacific
      1. 6.5.1. Asia Pacific Automotive Ethernet Market, 2016 – 2026 (USD Billion)
        1. 6.5.1.1. Asia Pacific Automotive Ethernet Market, by Country, 2016 - 2026 (USD Billion)
      2. 6.5.2. Asia Pacific Automotive Ethernet Market, by Component, 2016 – 2026
        1. 6.5.2.1. Asia Pacific Automotive Ethernet Market, by Component, 2016 – 2026 (USD Billion)
      3. 6.5.3. Asia Pacific Automotive Ethernet Market, by Bandwidth, 2016 – 2026
        1. 6.5.3.1. Asia Pacific Automotive Ethernet Market, by Bandwidth, 2016 – 2026 (USD Billion)
      4. 6.5.4. Asia Pacific Automotive Ethernet Market, by Application, 2016 – 2026
        1. 6.5.4.1. Asia Pacific Automotive Ethernet Market, by Application, 2016 – 2026 (USD Billion)
      5. 6.5.5. Asia Pacific Automotive Ethernet Market, by Vehicle Type, 2016 – 2026
        1. 6.5.5.1. Asia Pacific Automotive Ethernet Market, by Vehicle Type, 2016 – 2026 (USD Billion)
      6. 6.5.6. China
        1. 6.5.6.1. China Automotive Ethernet Market, 2016 – 2026 (USD Billion)
      7. 6.5.7. Japan
        1. 6.5.7.1. Japan Automotive Ethernet Market, 2016 – 2026 (USD Billion)
      8. 6.5.8. India
        1. 6.5.8.1. India Automotive Ethernet Market, 2016 – 2026 (USD Billion)
      9. 6.5.9. South Korea
        1. 6.5.9.1. South Korea Automotive Ethernet Market, 2016 – 2026 (USD Billion)
      10. 6.5.10. South-East Asia
        1. 6.5.10.1. South-East Asia Automotive Ethernet Market, 2016 – 2026 (USD Billion)
      11. 6.5.11. Rest of Asia Pacific
        1. 6.5.11.1. Rest of Asia Pacific Automotive Ethernet Market, 2016 – 2026 (USD Billion)
    6. 6.6. Latin America
      1. 6.6.1. Latin America Automotive Ethernet Market, 2016 – 2026 (USD Billion)
        1. 6.6.1.1. Latin America Automotive Ethernet Market, by Country, 2016 - 2026 (USD Billion)
      2. 6.6.2. Latin America Automotive Ethernet Market, by Component, 2016 – 2026
        1. 6.6.2.1. Latin America Automotive Ethernet Market, by Component, 2016 – 2026 (USD Billion)
      3. 6.6.3. Latin America Automotive Ethernet Market, by Bandwidth, 2016 – 2026
        1. 6.6.3.1. Latin America Automotive Ethernet Market, by Bandwidth, 2016 – 2026 (USD Billion)
      4. 6.6.4. Latin America Automotive Ethernet Market, by Application, 2016 – 2026
        1. 6.6.4.1. Latin America Automotive Ethernet Market, by Application, 2016 – 2026 (USD Billion)
      5. 6.6.5. Latin America Automotive Ethernet Market, by Vehicle Type, 2016 – 2026
        1. 6.6.5.1. Latin America Automotive Ethernet Market, by Vehicle Type, 2016 – 2026 (USD Billion)
      6. 6.6.6. Brazil
        1. 6.6.6.1. Brazil Automotive Ethernet Market, 2016 – 2026 (USD Billion)
      7. 6.6.7. Mexico
        1. 6.6.7.1. Mexico Automotive Ethernet Market, 2016 – 2026 (USD Billion)
      8. 6.6.8. Rest of Latin America
        1. 6.6.8.1. Rest of Latin America Automotive Ethernet Market, 2016 – 2026 (USD Billion)
    7. 6.7. The Middle-East and Africa
      1. 6.7.1. The Middle-East and Africa Automotive Ethernet Market, 2016 – 2026 (USD Billion)
        1. 6.7.1.1. The Middle-East and Africa Automotive Ethernet Market, by Country, 2016 - 2026 (USD Billion)
      2. 6.7.2. The Middle-East and Africa Automotive Ethernet Market, by Component, 2016 – 2026
        1. 6.7.2.1. The Middle-East and Africa Automotive Ethernet Market, by Component, 2016 – 2026 (USD Billion)
      3. 6.7.3. The Middle-East and Africa Automotive Ethernet Market, by Bandwidth, 2016 – 2026
        1. 6.7.3.1. The Middle-East and Africa Automotive Ethernet Market, by Bandwidth, 2016 – 2026 (USD Billion)
      4. 6.7.4. The Middle-East and Africa Automotive Ethernet Market, by Application, 2016 – 2026
        1. 6.7.4.1. The Middle-East and Africa Automotive Ethernet Market, by Application, 2016 – 2026 (USD Billion)
      5. 6.7.5. The Middle-East and Africa Automotive Ethernet Market, by Vehicle Type, 2016 – 2026
        1. 6.7.5.1. The Middle-East and Africa Automotive Ethernet Market, by Vehicle Type, 2016 – 2026 (USD Billion)
      6. 6.7.6. GCC Countries
        1. 6.7.6.1. GCC Countries Automotive Ethernet Market, 2016 – 2026 (USD Billion)
      7. 6.7.7. South Africa
        1. 6.7.7.1. South Africa Automotive Ethernet Market, 2016 – 2026 (USD Billion)
      8. 6.7.8. Rest of Middle-East Africa
        1. 6.7.8.1. Rest of Middle-East Africa Automotive Ethernet Market, 2016 – 2026 (USD Billion)
  7. Chapter 7 Automotive Ethernet Market – Competitive Landscape
    1. 7.1. Competitor Market Share – Revenue
    2. 7.2. Market Concentration Rate Analysis, Top 3 and Top 5 Players
    3. 7.3. Strategic Developments
      1. 7.3.1. Acquisitions and Mergers
      2. 7.3.2. New Products
      3. 7.3.3. Research & Development Activities
  8. Chapter 8 Company Profiles
    1. 8.1. Broadcom
      1. 8.1.1. Company Overview
      2. 8.1.2. Product/Service Portfolio
      3. 8.1.3. Broadcom Sales, Revenue, and Gross Margin
      4. 8.1.4. Broadcom Revenue and Growth Rate
      5. 8.1.5. Broadcom Market Share
      6. 8.1.6. Recent Initiatives, Funding/VC Activities, and Technological Innovations
    2. 8.2. NXP Semiconductors N.V
      1. 8.2.1. Company Overview
      2. 8.2.2. Product/Service Portfolio
      3. 8.2.3. NXP Semiconductors N.V Sales, Revenue, and Gross Margin
      4. 8.2.4. NXP Semiconductors N.V Revenue and Growth Rate
      5. 8.2.5. NXP Semiconductors N.V Market Share
      6. 8.2.6. Recent Initiatives, Funding/VC Activities, and Technological Innovations
    3. 8.3. Marvell
      1. 8.3.1. Company Overview
      2. 8.3.2. Product/Service Portfolio
      3. 8.3.3. Marvell Sales, Revenue, and Gross Margin
      4. 8.3.4. Marvell Revenue and Growth Rate
      5. 8.3.5. Marvell Market Share
      6. 8.3.6. Recent Initiatives, Funding/VC Activities, and Technological Innovations
    4. 8.4. Microchip Technology Inc
      1. 8.4.1. Company Overview
      2. 8.4.2. Product/Service Portfolio
      3. 8.4.3. Microchip Technology Inc Sales, Revenue, and Gross Margin
      4. 8.4.4. Microchip Technology Inc Revenue and Growth Rate
      5. 8.4.5. Microchip Technology Inc Market Share
      6. 8.4.6. Recent Initiatives, Funding/VC Activities, and Technological Innovations
    5. 8.5. Vector Informatik
      1. 8.5.1. Company Overview
      2. 8.5.2. Product/Service Portfolio
      3. 8.5.3. Vector Informatik Sales, Revenue, and Gross Margin
      4. 8.5.4. Vector Informatik Revenue and Growth Rate
      5. 8.5.5. Vector Informatik Market Share
      6. 8.5.6. Recent Initiatives, Funding/VC Activities, and Technological Innovations
    6. 8.6. System-On-Chip Engineering S.L
      1. 8.6.1. Company Overview
      2. 8.6.2. Product/Service Portfolio
      3. 8.6.3. System-On-Chip Engineering S.L Sales, Revenue, and Gross Margin
      4. 8.6.4. System-On-Chip Engineering S.L Revenue and Growth Rate
      5. 8.6.5. System-On-Chip Engineering S.L Market Share
      6. 8.6.6. Recent Initiatives, Funding/VC Activities, and Technological Innovations
    7. 8.7. Molex LLC
      1. 8.7.1. Company Overview
      2. 8.7.2. Product/Service Portfolio
      3. 8.7.3. Molex LLC Sales, Revenue, and Gross Margin
      4. 8.7.4. Molex LLC Revenue and Growth Rate
      5. 8.7.5. Molex LLC Market Share
      6. 8.7.6. Recent Initiatives, Funding/VC Activities, and Technological Innovations
    8. 8.8. Texas Instruments
      1. 8.8.1. Company Overview
      2. 8.8.2. Product/Service Portfolio
      3. 8.8.3. Texas Instruments Sales, Revenue, and Gross Margin
      4. 8.8.4. Texas Instruments Revenue and Growth Rate
      5. 8.8.5. Texas Instruments Market Share
      6. 8.8.6. Recent Initiatives, Funding/VC Activities, and Technological Innovations
    9. 8.9. Cadence Design Systems Inc
      1. 8.9.1. Company Overview
      2. 8.9.2. Product/Service Portfolio
      3. 8.9.3. Cadence Design Systems Inc Sales, Revenue, and Gross Margin
      4. 8.9.4. Cadence Design Systems Inc Revenue and Growth Rate
      5. 8.9.5. Cadence Design Systems Inc Market Share
      6. 8.9.6. Recent Initiatives, Funding/VC Activities, and Technological Innovations
    10. 8.10. TTTech Auto AG
      1. 8.10.1. Company Overview
      2. 8.10.2. Product/Service Portfolio
      3. 8.10.3. TTTech Auto AG Sales, Revenue, and Gross Margin
      4. 8.10.4. TTTech Auto AG Revenue and Growth Rate
      5. 8.10.5. TTTech Auto AG Market Share
      6. 8.10.6. Recent Initiatives, Funding/VC Activities, and Technological Innovations
    11. 8.11. Excelforce
      1. 8.11.1. Company Overview
      2. 8.11.2. Product/Service Portfolio
      3. 8.11.3. Excelforce Sales, Revenue, and Gross Margin
      4. 8.11.4. Excelforce Revenue and Growth Rate
      5. 8.11.5. Excelforce Market Share
      6. 8.11.6. Recent Initiatives, Funding/VC Activities, and Technological Innovations
    12. 8.12. Spirent Communications
      1. 8.12.1. Company Overview
      2. 8.12.2. Product/Service Portfolio
      3. 8.12.3. Spirent Communications Sales, Revenue, and Gross Margin
      4. 8.12.4. Spirent Communications Revenue and Growth Rate
      5. 8.12.5. Spirent Communications Market Share
      6. 8.12.6. Recent Initiatives, Funding/VC Activities, and Technological Innovations
    13. 8.13. Aukua Systems Inc
      1. 8.13.1. Company Overview
      2. 8.13.2. Product/Service Portfolio
      3. 8.13.3. Aukua Systems Inc Sales, Revenue, and Gross Margin
      4. 8.13.4. Aukua Systems Inc Revenue and Growth Rate
      5. 8.13.5. Aukua Systems Inc Market Share
      6. 8.13.6. Recent Initiatives, Funding/VC Activities, and Technological Innovations
    14. 8.14. RUETZ SYSTEM SOLUTIONS
      1. 8.14.1. Company Overview
      2. 8.14.2. Product/Service Portfolio
      3. 8.14.3. RUETZ SYSTEM SOLUTIONS Sales, Revenue, and Gross Margin
      4. 8.14.4. RUETZ SYSTEM SOLUTIONS Revenue and Growth Rate
      5. 8.14.5. RUETZ SYSTEM SOLUTIONS Market Share
      6. 8.14.6. Recent Initiatives, Funding/VC Activities, and Technological Innovations
    15. 8.15. Rohde & Schwarz
      1. 8.15.1. Company Overview
      2. 8.15.2. Product/Service Portfolio
      3. 8.15.3. Rohde & Schwarz Sales, Revenue, and Gross Margin
      4. 8.15.4. Rohde & Schwarz Revenue and Growth Rate
      5. 8.15.5. Rohde & Schwarz Market Share
      6. 8.15.6. Recent Initiatives, Funding/VC Activities, and Technological Innovations
  9. Chapter 9 Automotive Ethernet — Industry Analysis
    1. 9.1. Introduction and Taxonomy
    2. 9.2. Automotive Ethernet Market – Key Trends
      1. 9.2.1. Market Drivers
      2. 9.2.2. Market Restraints
      3. 9.2.3. Market Opportunities
    3. 9.3. Value Chain Analysis
    4. 9.4. Key Mandates and Regulations
    5. 9.5. Technology Roadmap and Timeline
    6. 9.6. Automotive Ethernet Market – Attractiveness Analysis
      1. 9.6.1. By Component
      2. 9.6.2. By Bandwidth
      3. 9.6.3. By Application
      4. 9.6.4. By Vehicle Type
      5. 9.6.5. By Region
  10. Chapter 10 Industrial Chain, Sourcing Strategy, and Downstream Buyers
    1. 10.1. Automotive Ethernet Industrial Chain Analysis
    2. 10.2. Downstream Buyers
    3. 10.3. Distributors/Traders List
  11. Chapter 11 Marketing Strategy Analysis
    1. 11.1. Marketing Channel
    2. 11.2. Direct Marketing
    3. 11.3. Indirect Marketing
    4. 11.4. Marketing Channel Development Trends
    5. 11.5. Economic/Political Environmental Change
  12. Chapter 12 Report Conclusion & Key Insights
    1. 12.1. Key Insights from Primary Interviews & Surveys Respondents
    2. 12.2. Key Takeaways from Analysts, Consultants, and Industry Leaders
  13. Chapter 13 Research Approach & Methodology
    1. 13.1. Report Description
    2. 13.2. Research Scope
    3. 13.3. Research Methodology
      1. 13.3.1. Secondary Research
      2. 13.3.2. Primary Research
      3. 13.3.3. Statistical Models
        1. 13.3.3.1. Company Share Analysis Model
        2. 13.3.3.2. Revenue Based Modeling
      4. 13.3.4. Research Limitations

      List of Figures

      Fig.1	Product Picture of Automotive Ethernet
      Fig.2	Global Automotive Ethernet Market, 2016 – 2026 (USD Billion)
      Fig.3	Global Automotive Ethernet Market Absolute Revenue Opportunity, 2016 – 2026 (USD Billion)
      Fig.4	Global Automotive Ethernet Market Incremental Revenue Opportunity, 2020 – 2026 (USD Billion)
      Fig.5	Global Automotive Ethernet Market Share, by Component, 2019 & 2026 (USD Billion)
      Fig.6	Global Hardware  Automotive Ethernet Market, 2016 – 2026 (USD Billion)
      Fig.7	Global Software  Automotive Ethernet Market, 2016 – 2026 (USD Billion)
      Fig.8	Global Services Automotive Ethernet Market, 2016 – 2026 (USD Billion)
      Fig.9	Global Automotive Ethernet Market Share, by Bandwidth, 2019 & 2026 (USD Billion)
      Fig.10	Global 10Mbps Automotive Ethernet Market, 2016 – 2026 (USD Billion)
      Fig.11	Global 100Mbps  Automotive Ethernet Market, 2016 – 2026 (USD Billion)
      Fig.12	Global 1Gbps  Automotive Ethernet Market, 2016 – 2026 (USD Billion)
      Fig.13	Global 2.5/5/10Gbps Automotive Ethernet Market, 2016 – 2026 (USD Billion)
      Fig.14	Global Automotive Ethernet Market Share, by Application, 2019 & 2026 (USD Billion)
      Fig.15	Global Advanced Driver Assistance Systems (ADAS)  Automotive Ethernet Market, 2016 – 2026 (USD Billion)
      Fig.16	Global Infotainment  Automotive Ethernet Market, 2016 – 2026 (USD Billion)
      Fig.17	Global Powertrain  Automotive Ethernet Market, 2016 – 2026 (USD Billion)
      Fig.18	Global Body & Comfort Automotive Ethernet Market, 2016 – 2026 (USD Billion)
      Fig.19	Global Others Automotive Ethernet Market, 2016 – 2026 (USD Billion)
      Fig.20	Global Automotive Ethernet Market Share, by Vehicle Type, 2019 & 2026 (USD Billion)
      Fig.21	Global Passenger Cars   Automotive Ethernet Market, 2016 – 2026 (USD Billion)
      Fig.22	Global Commercial Cars  Automotive Ethernet Market, 2016 – 2026 (USD Billion)
      Fig.23	Global Farming & Off-Highway Vehicles Automotive Ethernet Market, 2016 – 2026 (USD Billion)
      Fig.24	Global Automotive Ethernet Market Share, by Region, 2019 & 2026 (USD Billion)
      Fig.25	North America Automotive Ethernet Market, 2016 – 2026 (USD Billion)
      Fig.26	U.S. Automotive Ethernet Market, 2016 – 2026 (USD Billion)
      Fig.27	Canada Automotive Ethernet Market, 2016 – 2026 (USD Billion)
      Fig.28	Europe Automotive Ethernet Market, 2016 – 2026 (USD Billion)
      Fig.29	Germany Automotive Ethernet Market, 2016 – 2026 (USD Billion)
      Fig.30	France Automotive Ethernet Market, 2016 – 2026 (USD Billion)
      Fig.31	U.K. Automotive Ethernet Market, 2016 – 2026 (USD Billion)
      Fig.32	Italy Automotive Ethernet Market, 2016 – 2026 (USD Billion)
      Fig.33	Spain Automotive Ethernet Market, 2016 – 2026 (USD Billion)
      Fig.34	Rest of Europe Automotive Ethernet Market, 2016 – 2026 (USD Billion)
      Fig.35	Asia Pacific Automotive Ethernet Market, 2016 – 2026 (USD Billion)
      Fig.36	China Automotive Ethernet Market, 2016 – 2026 (USD Billion)
      Fig.37	Japan Automotive Ethernet Market, 2016 – 2026 (USD Billion)
      Fig.38	India Automotive Ethernet Market, 2016 – 2026 (USD Billion)
      Fig.39	South  Korea Automotive Ethernet Market, 2016 – 2026 (USD Billion)
      Fig.40	South-East Asia Automotive Ethernet Market, 2016 – 2026 (USD Billion)
      Fig.41	Rest of Asia Pacific Automotive Ethernet Market, 2016 – 2026 (USD Billion)
      Fig.42	Latin America Automotive Ethernet Market, 2016 – 2026 (USD Billion)
      Fig.43	Brazil Automotive Ethernet Market, 2016 – 2026 (USD Billion)
      Fig.44	Mexico Automotive Ethernet Market, 2016 – 2026 (USD Billion)
      Fig.45	Rest of Latin America Automotive Ethernet Market, 2016 – 2026 (USD Billion)
      Fig.46	The Middle-East and Africa Automotive Ethernet Market, 2016 – 2026 (USD Billion)
      Fig.47	GCC Countries Automotive Ethernet Market, 2016 – 2026 (USD Billion)
      Fig.48	South Africa Automotive Ethernet Market, 2016 – 2026 (USD Billion)
      Fig.49	Rest of Middle-East Africa Automotive Ethernet Market, 2016 – 2026 (USD Billion)
      Fig.50	Competitor Market Share – Revenue
      Fig.51	Broadcom Revenue and Growth Rate
      Fig.52	Broadcom Market Share
      Fig.53	NXP Semiconductors N.V Revenue and Growth Rate
      Fig.54	NXP Semiconductors N.V Market Share
      Fig.55	Marvell Revenue and Growth Rate
      Fig.56	Marvell Market Share
      Fig.57	Microchip Technology Inc Revenue and Growth Rate
      Fig.58	Microchip Technology Inc Market Share
      Fig.59	Vector Informatik Revenue and Growth Rate
      Fig.60	Vector Informatik Market Share
      Fig.61	System-On-Chip Engineering S.L Revenue and Growth Rate
      Fig.62	System-On-Chip Engineering S.L Market Share
      Fig.63	Molex LLC Revenue and Growth Rate
      Fig.64	Molex LLC Market Share
      Fig.65	Texas Instruments Revenue and Growth Rate
      Fig.66	Texas Instruments Market Share
      Fig.67	Cadence Design Systems Inc Revenue and Growth Rate
      Fig.68	Cadence Design Systems Inc Market Share
      Fig.69	TTTech Auto AG Revenue and Growth Rate
      Fig.70	TTTech Auto AG Market Share
      Fig.71	Excelforce Revenue and Growth Rate
      Fig.72	Excelforce Market Share
      Fig.73	Spirent Communications Revenue and Growth Rate
      Fig.74	Spirent Communications Market Share
      Fig.75	Aukua Systems Inc Revenue and Growth Rate
      Fig.76	Aukua Systems Inc Market Share
      Fig.77	RUETZ SYSTEM SOLUTIONS Revenue and Growth Rate
      Fig.78	RUETZ SYSTEM SOLUTIONS Market Share
      Fig.79	Rohde & Schwarz Revenue and Growth Rate
      Fig.80	Rohde & Schwarz Market Share
      Fig.81	Market Dynamics
      Fig.82	Global Automotive Ethernet – Value Chain Analysis
      Fig.83	Key Mandates and Regulations
      Fig.84	Technology Roadmap and Timeline
      Fig.85	Market Attractiveness Analysis – By Component
      Fig.86	Market Attractiveness Analysis – By Bandwidth
      Fig.87	Market Attractiveness Analysis – By Application
      Fig.88	Market Attractiveness Analysis – By Vehicle Type
      Fig.89	Market Attractiveness Analysis – By Region
      Fig.90	Automotive Ethernet Industrial Chain Analysis
      Fig.91	Market Channels
      Fig.92	Marketing Channel Development Trend
      Fig.93	Growth in World Gross Product, 2008-2018
      

      List of Tables

      Table 1	Global Automotive Ethernet Market, 2019 & 2026 (USD Billion)
      Table 2	Global Automotive Ethernet Market, by Component, 2016 – 2026 (USD Billion)
      Table 3	Global Automotive Ethernet Market, by Bandwidth, 2016 – 2026 (USD Billion)
      Table 4	Global Automotive Ethernet Market, by Application, 2016 – 2026 (USD Billion)
      Table 5	Global Automotive Ethernet Market, by Vehicle Type, 2016 – 2026 (USD Billion)
      Table 6	Global Automotive Ethernet Market, by Region, 2016 – 2026 (USD Billion)
      Table 7	North America Automotive Ethernet Market, by Country, 2016 – 2026 (USD Billion)
      Table 8	North America Automotive Ethernet Market, by Component, 2016 – 2026 (USD Billion)
      Table 9	North America Automotive Ethernet Market, by Bandwidth, 2016 – 2026 (USD Billion)
      Table 10 North America Automotive Ethernet Market, by Application, 2016 – 2026 (USD Billion)
      Table 11 North America Automotive Ethernet Market, by Vehicle Type, 2016 – 2026 (USD Billion)
      Table 12 Europe Automotive Ethernet Market, by Country, 2016 – 2026 (USD Billion)
      Table 13 Europe Automotive Ethernet Market, by Component, 2016 – 2026 (USD Billion)
      Table 14 Europe Automotive Ethernet Market, by Bandwidth, 2016 – 2026 (USD Billion)
      Table 15 Europe Automotive Ethernet Market, by Application, 2016 – 2026 (USD Billion)
      Table 16 Europe Automotive Ethernet Market, by Vehicle Type, 2016 – 2026 (USD Billion)
      Table 17 Asia Pacific Automotive Ethernet Market, by Country, 2016 – 2026 (USD Billion)
      Table 18 Asia Pacific Automotive Ethernet Market, by Component, 2016 – 2026 (USD Billion)
      Table 19 Asia Pacific Automotive Ethernet Market, by Bandwidth, 2016 – 2026 (USD Billion)
      Table 20 Asia Pacific Automotive Ethernet Market, by Application, 2016 – 2026 (USD Billion)
      Table 21 Asia Pacific Automotive Ethernet Market, by Vehicle Type, 2016 – 2026 (USD Billion)
      Table 22 Latin America Automotive Ethernet Market, by Country, 2016 – 2026 (USD Billion)
      Table 23 Latin America Automotive Ethernet Market, by Component, 2016 – 2026 (USD Billion)
      Table 24 Latin America Automotive Ethernet Market, by Bandwidth, 2016 – 2026 (USD Billion)
      Table 25 Latin America Automotive Ethernet Market, by Application, 2016 – 2026 (USD Billion)
      Table 26 Latin America Automotive Ethernet Market, by Vehicle Type, 2016 – 2026 (USD Billion)
      Table 27 The Middle-East and Africa Automotive Ethernet Market, by Country, 2016 – 2026 (USD Billion)
      Table 28 The Middle-East and Africa Automotive Ethernet Market, by Component, 2016 – 2026 (USD Billion)
      Table 29 The Middle-East and Africa Automotive Ethernet Market, by Bandwidth, 2016 – 2026 (USD Billion)
      Table 30 The Middle-East and Africa Automotive Ethernet Market, by Application, 2016 – 2026 (USD Billion)
      Table 31 The Middle-East and Africa Automotive Ethernet Market, by Vehicle Type, 2016 – 2026 (USD Billion)
      Table 32 Global Automotive Ethernet Market - Company Revenue Analysis, 2016 – 2019 (USD Billion)
      Table 33 Global Automotive Ethernet Market - Company Revenue Share Analysis, 2016 – 2019 (%)
      Table 34 Acquisitions and Mergers
      Table 35 Market Drivers – Impact Analysis
      Table 36 Market Restraints
      Table 37 Market Opportunities
      Table 38 Major Buyers of Automotive Ethernet
      Table 39 Distributors/Traders of Automotive Ethernet by Region
      

Industry Major Market Players

  • Broadcom
  • NXP Semiconductors N.V.
  • Marvell
  • Microchip Technology Inc.
  • Vector Informatik
  • System-On-Chip Engineering S.L.
  • Molex LLC
  • Texas Instruments
  • Cadence Design Systems Inc.
  • TTTech Auto AG.
  • Excelforce
  • Spirent Communications
  • Aukua Systems Inc.
  • RUETZ SYSTEM SOLUTIONS
  • Rohde & Schwarz