Search Market Research Report

Discover Our Latest Reports
Discover Our Featured Reports
Discover Top Selling Reports

Automotive Composite Materials Market Size, Share Global Analysis Report, 2020–2026

report img

Automotive Composite Materials Market By Manufacturing Process (Lay-up Process, Compression Molding Process, Resin Transfer Molding (RTM) Process, Filament Winding Process, Injection Molding Process, Pultrusion Process, Vacuum Infusion, and Other Processes), By Material(Polymer Matrix Composite(PMC), Metal Matrix Composite (MMC) and Ceramic Matrix Composite (CMC)), By Resin Type (Thermoplastic and Thermoset), By Fiber Type (Carbon, Glass, and Others) and By Application (Interior, Exterior, Powertrain, Structural and Others): Global Industry Outlook, Market Size, Business Intelligence, Consumer Preferences, Statistical Surveys, Comprehensive Analysis, Historical Developments, Current Trends, and Forecast 2020–2026

Industry Insights

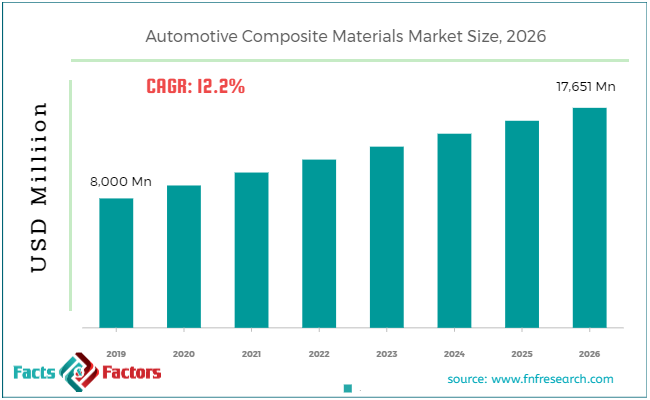
According to the report published by Facts & Factors, the global Automotive Composite Materials market size was worth around USD 8000 million in 2019 and is predicted to grow around USD 17,651 million by 2026 with a compound annual growth rate (CAGR) of roughly 12.2% between 2020 and 2026. The report analyzes the global Automotive Composite Materials market drivers, restraints/challenges, and the effect they have on the demands during the projection period. In addition, the report explores emerging opportunities in the Automotive Composite Materials market.

The automotive composite materials market report analyzes and notifies the industry statistics at the global as well as regional and country levels in order to acquire a thorough perspective of the entire automotive composite materials market. The historical and past insights are provided for FY 2016 to FY 2019 whereas projected trends are delivered forty 2020 to FY 2026. The quantitative and numerical data is represented in terms of value (USD Million) from FY 2016 – 2026.

This specialized and expertise-oriented industry research report scrutinizes the technical and commercial business outlook of the automotive composite materials industry. The report analyzes and declares the historical and current trends analysis of the automotive composite materials industry and subsequently recommends the projected trends anticipated to be observed in the automotive composite materials market during the upcoming years.

Automotive Composite Materials Market Size

To know more about this report | Request Free Sample Copy

logoKey Insights from Primary Research

  • As per our primary respondents, the automotive composite material market is set to grow annually at a rate of around 12.2%.
  • It was established through primary research that the automotive composite material market was valued at around USD 8,000 million in 2019.
  • After secondary research, we performed face to face interviews to validate our data. The insights interviewee’s declared that thermoset is the most used material for automotive composite materials.
  • On the basis of the manufacturing process, Compression Molding Process dominated the global automotive composite materials market in 2019. It accounted for a 24.21% share of the total market in 2019.
  • The Polymer Matrix Composite (PMC)category, on the basis of material type segmentation, was the leading revenue-generating category accounting for around 75% share, in 2019.
  • On the basis of application segmentation, the exterior category held the leading share at more than 36%, in 2019.

logoKey Recommendations from Analysts

  • Based on the exhaustive secondary research done by our team, the Polymer Matrix Composite (PMC) material is anticipated to become the most demanding material in the upcoming years, owing to the growing demand for polymer matrix composites from the automotive industry for various end-use applications.
  • As per our analysts, APAC recorded the highest CAGR of 19% by 2026, and the market is expected to bolster in this region, resulting in creating lucrative opportunities for new players.
  • Growing at a CAGR around 12.2%, the automotive composite material market provides numerous opportunities for all of the involved stakeholders across the entire value chain.
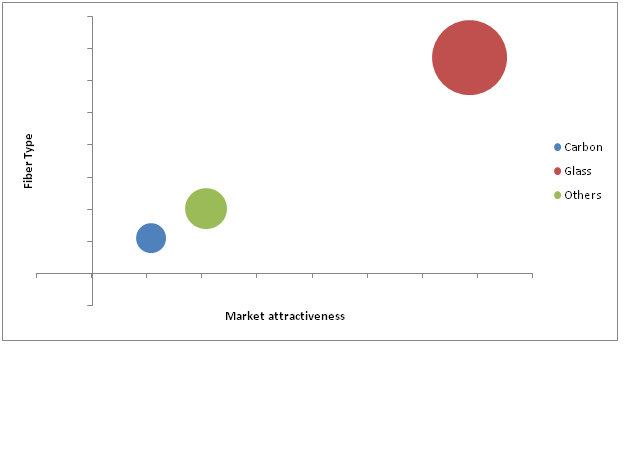
  • Our analysts have identified glass and exterior categories as the leading investment pockets for the automotive composite material market in terms of fiber type and application segmentation respectively.
  • Our analysts recommend the emerging players to focus on thermoset resins as the stringent government regulations associated with the reduction of greenhouse gas emissions, the introduction of bio-based thermosets, development of rapid cure resin systems are anticipated to bolster this segment in the coming years.

logoMarket Attractiveness – By Fiber Type

Automotive Composite Materials Market

To know more about this report | Request Free Sample Copy

The quantitative data is further underlined and reinforced by comprehensive qualitative data which comprises various across-the-board market dynamics. The rationales which directly or indirectly impact the automotive composite materials industry are exemplified through parameters such as growth drivers, restraints, challenges, and opportunities among other impacting factors.

Throughout our research report, we have encompassed all the proven models and tools of industry analysis and extensively illustrated all the key business strategies and business models adopted in the automotive composite materials industry. The report provides an all-inclusive and detailed competitive landscape prevalent in the automotive composite materials market.

The report utilizes established industry analysis tools and models such as Porter’s Five Forces framework to analyze and recognize critical business strategies adopted by various stakeholders involved in the entire value chain of the automotive composite materials industry. The automotive composite materials market report additionally employs SWOT analysis and PESTLE analysis models for further in-depth analysis.

The report study further includes an in-depth analysis of industry players' market shares and provides an overview of leading players' market position in the automotive composite materials sector. Key strategic developments in the automotive composite materials market competitive landscape such as acquisitions & mergers, inaugurations of different products and services, partnerships & joint ventures, MoU agreements, VC & funding activities, R&D activities, and geographic expansion among other noteworthy activities by key players of the automotive composite materials market are appropriately highlighted in the report.

A composite material is a composition of high-performance fiber with a matrix material, for instance, carbon or glass in the epoxy polymer. This composition enhances the physical and chemical properties of the material. Composite automotive materials such as carbon-fiber composites are considered as fuel-efficient, lighter and safer for vehicles as they weigh one-fifth of steel but perform better in terms of strength and stiffness. These advantages of composite material over other materials and metals used in the automotive industry are one of the key factors bolstering the market growth in recent years. In addition, automotive composite materials have better corrosion resistance, a low thermal coefficient expansion for heat conduction and relatively less weight as compared to traditional materials. These physical properties of composite materials are anticipated to fuel its adoption in the automotive industry.

logoRegional Overview:

The automotive composite materials market research report delivers an acute valuation and taxonomy of the automotive composite materials industry by practically splitting the market on the basis of different types, applications, and regions. Through the analysis of the historical and projected trends, all the segments and sub-segments were evaluated through the bottom-up approach, and different market sizes have been projected for FY 2020 to FY 2026. The regional segmentation of the automotive composite materials industry includes the complete classification of all the major continents including North America, Latin America, Europe, Asia Pacific, and Middle East & Africa. Further, country-wise data for the automotive composite materials industry is provided for the leading economies of the world.

logoReport Scope

Report Attribute

Details

Market Size in 2019

USD 8,000 Million

Projected Market Size in 2026

USD 17,651 Million

CAGR Growth Rate

12.2% CAGR

Base Year

2019

Forecast Years

2020-2026

Key Market Players

Toray Industries, Inc., SGL Carbon SE, Solvay S.A., UFP Technologies, Inc, Koninklijke Ten Cate bv, Gurit, Toho Tenax Co., Ltd., Mitsubishi Chemical Corporation, Plasan Carbon Composites, Inc., Continental Structural Plastics Inc, Owens Corning, BrajBinani Group, Hexcel Corporation, MubeaCarbo Tech GmbH, MubeaCarboTech GmbH, GMS Composites, TPI Composites Inc, Hanwha Azdel, Inc., Magna International Inc., Mahindra CIE Automotive Ltd., Hyosung Advanced Materials Corp, DowAksa Advanced Composites, SABIC, Diab Group, Huntsman Corporation, and others.

Key Segment

Material, Resin, Application, and Region

Major Regions Covered

North America, Europe, Asia Pacific, Latin America, and the Middle East &, Africa

Purchase Options

Request customized purchase options to meet your research needs. Explore purchase options

The automotive composite materials market is segmented based on the manufacturing process, material, resin type, fiber type, and application.  On the basis of the manufacturing process segmentation, the market is classified into Lay-up Process, Compression Molding Process, Resin Transfer Molding(RTM) Process, Filament Winding Process, Injection Molding Process, Pultrusion Process, Vacuum Infusion, and Other Processes. In terms of material segmentation, the market is bifurcated into Polymer Matrix Composite(PMC), Metal Matrix Composite (MMC), and Ceramic Matrix Composite (CMC). The resin-type segment is divided into Thermoplastic and Thermoset. On the basis of fiber type, the market is bifurcated into carbon, glass, and others. The applications are segmented into the interior, exterior, powertrain, structural, and others.

logoSome of the essential players operating in the automotive composite materials market, but not restricted to include

  • Toray Industries Inc.
  •  SGL Carbon SE
  •  Solvay S.A.
  •  UFP Technologies Inc
  •  Koninklijke Ten Cate bv
  •  Gurit
  •  Toho Tenax Co. Ltd.
  •  Mitsubishi Chemical Corporation
  •  Plasan Carbon Composites Inc.
  •  Continental Structural Plastics Inc
  •  Owens Corning
  •  BrajBinani Group
  •  Hexcel Corporation
  •  MubeaCarbo Tech GmbH
  •  MubeaCarbo Tech GmbH
  •  GMS Composites
  •  TPI Composites Inc
  •  Hanwha Azdel Inc.
  •  Magna International Inc.
  • Mahindra CIE Automotive Ltd.
  • Hyosung Advanced Materials Corp
  • DowAksa Advanced Composites
  • SABIC
  • Diab Group
  • Huntsman Corporation

The taxonomy of the Automotive Composite Materials industry by its scope and segmentation is as follows:

logo By Manufacturing Process Analysis (Customizable)

  • Lay-up Process
  • Compression Molding Process
  • Resin Transfer Molding(RTM) Process
  • Filament Winding Process
  • Injection Molding Process
  • Pultrusion Process
  • Vacuum Infusion
  • Other Processes

logo By Material Segmentation Analysis (Customizable)

  • Polymer Matrix Composite(PMC)
  • Metal Matrix Composite (MMC)
  • Ceramic Matrix Composite (CMC)

logo By Resin Segmentation Analysis (Customizable)

  • Thermoplastic
  • Thermoset

logo By Fiber Segmentation Analysis (Customizable)

  • Carbon
  • Glass
  • Others

logo By Application Segmentation Analysis (Customizable)

  • Application
  • Interior
  • Exterior
  • Powertrain
  • Structural
  • Others

logo Regional Segmentation Analysis (Customizable)

  • North America
    • The U.S.
    • Canada
  • Europe
    • Germany
    • The UK
    • France
    • Spain
    • Italy
    • Rest of Europe
  • Asia Pacific
    • China
    • Japan
    • India
    • South Korea
    • Southeast Asia
    • Rest of Asia Pacific
  • Latin America
    • Brazil
    • Mexico
    • Rest of Latin America
  • Middle East & Africa
    • GCC
    • South Africa
    • Rest of the Middle East & Africa

Table of Content

  1. CHAPTER 1. Executive Summary
  2. CHAPTER 2. Automotive Composite Materials market – Manufacturing Process Analysis
    1. 2.1. Global Automotive Composite Materials Market – Manufacturing Process Overview
    2. 2.2. Global Automotive Composite Materials Market Share, by Manufacturing Process, 2019&2026 (USD Million)
    3. 2.3. Lay-up Process
      1. 2.3.1. Global Lay-up Process Automotive Composite Materials Market, 2016-2026 (USD Million)
    4. 2.4. Compression Molding Process
      1. 2.4.1. Global Compression Molding Process Automotive Composite Materials Market, 2016-2026 (USD Million)
    5. 2.5. Resin Transfer Molding(RTM) Process
      1. 2.5.1. Global Resin Transfer Molding(RTM) Process Automotive Composite Materials Market, 2016-2026 (USD Million)
    6. 2.6. Filament Winding Process
      1. 2.6.1. Global Filament Winding Process Automotive Composite Materials Market, 2016-2026 (USD Million)
    7. 2.7. Injection Molding Process
      1. 2.7.1. Global Injection Molding Process Automotive Composite Materials Market, 2016-2026 (USD Million)
    8. 2.8. Pultrusion Process
      1. 2.8.1. Global Pultrusion Process Automotive Composite Materials Market, 2016-2026 (USD Million)
    9. 2.9. Vacuum Infusion
      1. 2.9.1. Global Vacuum Infusion Automotive Composite Materials Market, 2016-2026 (USD Million)
    10. 2.10. Other Processes
      1. 2.10.1. Global Other Processes Automotive Composite Materials Market, 2016-2026 (USD Million)
  3. CHAPTER 3. Automotive Composite Materials market – Material Analysis
    1. 3.1. Global Automotive Composite Materials Market – Material Overview
    2. 3.2. Global Automotive Composite Materials Market Share, by Material, 2019&2026 (USD Million)
    3. 3.3. Polymer Matrix Composite(PMC)
      1. 3.3.1. Global Polymer Matrix Composite(PMC) Automotive Composite Materials Market, 2016-2026 (USD Million)
    4. 3.4. Metal Matrix Composite (MMC)
      1. 3.4.1. Global Metal Matrix Composite (MMC) Automotive Composite Materials Market, 2016-2026 (USD Million)
    5. 3.5. Ceramic Matrix Composite (CMC)
      1. 3.5.1. Global Ceramic Matrix Composite (CMC) Automotive Composite Materials Market, 2016-2026 (USD Million)
  4. CHAPTER 4. Automotive Composite Materials market – Resin Analysis
    1. 4.1. Global Automotive Composite Materials Market – Resin Overview
    2. 4.2. Global Automotive Composite Materials Market Share, by Resin, 2019&2026 (USD Million)
    3. 4.3. Thermoplastic
      1. 4.3.1. Global Thermoplastic Automotive Composite Materials Market, 2016-2026 (USD Million)
    4. 4.4. Thermoset
      1. 4.4.1. Global Thermoset Automotive Composite Materials Market, 2016-2026 (USD Million)
  5. CHAPTER 5. Automotive Composite Materials market – Fiber Analysis
    1. 5.1. Global Automotive Composite Materials Market – Fiber Overview
    2. 5.2. Global Automotive Composite Materials Market Share, by Fiber, 2019&2026 (USD Million)
    3. 5.3. Carbon
      1. 5.3.1. Global Carbon Automotive Composite Materials Market, 2016-2026 (USD Million)
    4. 5.4. Glass
      1. 5.4.1. Global Glass Automotive Composite Materials Market, 2016-2026 (USD Million)
    5. 5.5. Others
      1. 5.5.1. Global Others Automotive Composite Materials Market, 2016-2026 (USD Million)
  6. CHAPTER 6. Automotive Composite Materials market – Application Analysis
    1. 6.1. Global Automotive Composite Materials Market – Application Overview
    2. 6.2. Global Automotive Composite Materials Market Share, by Application, 2019&2026 (USD Million)
    3. 6.3. Interior
      1. 6.3.1. Global Interior Automotive Composite Materials Market, 2016-2026 (USD Million)
    4. 6.4. Exterior
      1. 6.4.1. Global Exterior Automotive Composite Materials Market, 2016-2026 (USD Million)
    5. 6.5. Powertrain
      1. 6.5.1. Global Powertrain Automotive Composite Materials Market, 2016-2026 (USD Million)
    6. 6.6. Structural
      1. 6.6.1. Global Structural Automotive Composite Materials Market, 2016-2026 (USD Million)
    7. 6.7. Others
      1. 6.7.1. Global Others Automotive Composite Materials Market, 2016-2026 (USD Million)
  7. CHAPTER 7. Automotive Composite Materials market – Regional Analysis
    1. 7.1. Global Automotive Composite Materials Market Regional Overview
    2. 7.2. Global Automotive Composite Materials Market Share, by Region, 2019&2026 (Value)
    3. 7.3. North America
      1. 7.3.1. North America Automotive Composite Materials Market size and forecast, 2016-2026
      2. 7.3.2. North America Automotive Composite Materials Market, by Country, 2019&2026 (USD Million)
      3. 7.3.3. North America Automotive Composite Materials Market, by Manufacturing Process, 2016-2026
        1. 7.3.3.1. North America Automotive Composite Materials Market, by Manufacturing Process, 2016-2026 (USD Million)
      4. 7.3.4. North America Automotive Composite Materials Market, by Material, 2016-2026
        1. 7.3.4.1. North America Automotive Composite Materials Market, by Material, 2016-2026 (USD Million)
      5. 7.3.5. North America Automotive Composite Materials Market, by Resin, 2016-2026
        1. 7.3.5.1. North America Automotive Composite Materials Market, by Resin, 2016-2026 (USD Million)
      6. 7.3.6. North America Automotive Composite Materials Market, by Fiber, 2016-2026
        1. 7.3.6.1. North America Automotive Composite Materials Market, by Fiber, 2016-2026 (USD Million)
      7. 7.3.7. North America Automotive Composite Materials Market, by Application, 2016-2026
        1. 7.3.7.1. North America Automotive Composite Materials Market, by Application, 2016-2026 (USD Million)
      8. 7.3.8. U.S.
        1. 7.3.8.1. U.S. Market size and forecast, 2016-2026 (USD Million)
      9. 7.3.9. Canada
        1. 7.3.9.1. Canada Market size and forecast, 2016-2026 (USD Million)
    4. 7.4. Europe
      1. 7.4.1. Europe Automotive Composite Materials Market size and forecast, 2016-2026
      2. 7.4.2. Europe Automotive Composite Materials Market, by Country, 2019&2026 (USD Million)
      3. 7.4.3. Europe Automotive Composite Materials Market, by Manufacturing Process, 2016-2026
        1. 7.4.3.1. Europe Automotive Composite Materials Market, by Manufacturing Process, 2016-2026 (USD Million)
      4. 7.4.4. Europe Automotive Composite Materials Market, by Material, 2016-2026
        1. 7.4.4.1. Europe Automotive Composite Materials Market, by Material, 2016-2026 (USD Million)
      5. 7.4.5. Europe Automotive Composite Materials Market, by Resin, 2016-2026
        1. 7.4.5.1. Europe Automotive Composite Materials Market, by Resin, 2016-2026 (USD Million)
      6. 7.4.6. Europe Automotive Composite Materials Market, by Fiber, 2016-2026
        1. 7.4.6.1. Europe Automotive Composite Materials Market, by Fiber, 2016-2026 (USD Million)
      7. 7.4.7. Europe Automotive Composite Materials Market, by Application, 2016-2026
        1. 7.4.7.1. Europe Automotive Composite Materials Market, by Application, 2016-2026 (USD Million)
      8. 7.4.8. Germany
        1. 7.4.8.1. Germany Market size and forecast, 2016-2026 (USD Million)
      9. 7.4.9. France
        1. 7.4.9.1. France Market size and forecast, 2016-2026 (USD Million)
      10. 7.4.10. U.K.
        1. 7.4.10.1. U.K. Market size and forecast, 2016-2026 (USD Million)
      11. 7.4.11. Italy
        1. 7.4.11.1. Italy Market size and forecast, 2016-2026 (USD Million)
      12. 7.4.12. Spain
        1. 7.4.12.1. Spain Market size and forecast, 2016-2026 (USD Million)
      13. 7.4.13. Rest of Europe
        1. 7.4.13.1. Rest of Europe Market size and forecast, 2016-2026 (USD Million)
    5. 7.5. Asia Pacific
      1. 7.5.1. Asia Pacific Automotive Composite Materials Market size and forecast, 2016-2026
      2. 7.5.2. Asia Pacific Automotive Composite Materials Market, by Country, 2019&2026 (USD Million)
      3. 7.5.3. Asia Pacific Automotive Composite Materials Market, by Manufacturing Process, 2016-2026
        1. 7.5.3.1. Asia Pacific Automotive Composite Materials Market, by Manufacturing Process, 2016-2026 (USD Million)
      4. 7.5.4. Asia Pacific Automotive Composite Materials Market, by Material, 2016-2026
        1. 7.5.4.1. Asia Pacific Automotive Composite Materials Market, by Material, 2016-2026 (USD Million)
      5. 7.5.5. Asia Pacific Automotive Composite Materials Market, by Resin, 2016-2026
        1. 7.5.5.1. Asia Pacific Automotive Composite Materials Market, by Resin, 2016-2026 (USD Million)
      6. 7.5.6. Asia Pacific Automotive Composite Materials Market, by Fiber, 2016-2026
        1. 7.5.6.1. Asia Pacific Automotive Composite Materials Market, by Fiber, 2016-2026 (USD Million)
      7. 7.5.7. Asia Pacific Automotive Composite Materials Market, by Application, 2016-2026
        1. 7.5.7.1. Asia Pacific Automotive Composite Materials Market, by Application, 2016-2026 (USD Million)
      8. 7.5.8. China
        1. 7.5.8.1. China Market size and forecast, 2016-2026 (USD Million)
      9. 7.5.9. Japan
        1. 7.5.9.1. Japan Market size and forecast, 2016-2026 (USD Million)
      10. 7.5.10. India
        1. 7.5.10.1. India Market size and forecast, 2016-2026 (USD Million)
      11. 7.5.11. South Korea
        1. 7.5.11.1. South Korea Market size and forecast, 2016-2026 (USD Million)
      12. 7.5.12. South-East Asia
        1. 7.5.12.1. South-East Asia Market size and forecast, 2016-2026 (USD Million)
      13. 7.5.13. Rest of Asia Pacific
        1. 7.5.13.1. Rest of Asia Pacific Market size and forecast, 2016-2026 (USD Million)
    6. 7.6. Latin America
      1. 7.6.1. Latin America Automotive Composite Materials Market size and forecast, 2016-2026
      2. 7.6.2. Latin America Automotive Composite Materials Market, by Country, 2019&2026 (USD Million)
      3. 7.6.3. Latin America Automotive Composite Materials Market, by Manufacturing Process, 2016-2026
        1. 7.6.3.1. Latin America Automotive Composite Materials Market, by Manufacturing Process, 2016-2026 (USD Million)
      4. 7.6.4. Latin America Automotive Composite Materials Market, by Material, 2016-2026
        1. 7.6.4.1. Latin America Automotive Composite Materials Market, by Material, 2016-2026 (USD Million)
      5. 7.6.5. Latin America Automotive Composite Materials Market, by Resin, 2016-2026
        1. 7.6.5.1. Latin America Automotive Composite Materials Market, by Resin, 2016-2026 (USD Million)
      6. 7.6.6. Latin America Automotive Composite Materials Market, by Fiber, 2016-2026
        1. 7.6.6.1. Latin America Automotive Composite Materials Market, by Fiber, 2016-2026 (USD Million)
      7. 7.6.7. Latin America Automotive Composite Materials Market, by Application, 2016-2026
        1. 7.6.7.1. Latin America Automotive Composite Materials Market, by Application, 2016-2026 (USD Million)
      8. 7.6.8. Brazil
        1. 7.6.8.1. Brazil Market size and forecast, 2016-2026 (USD Million)
      9. 7.6.9. Mexico
        1. 7.6.9.1. Mexico Market size and forecast, 2016-2026 (USD Million)
      10. 7.6.10. Rest of Latin America
        1. 7.6.10.1. Rest of Latin America Market size and forecast, 2016-2026 (USD Million)
    7. 7.7. The Middle-East and Africa
      1. 7.7.1. The Middle-East and Africa Automotive Composite Materials Market size and forecast, 2016-2026
      2. 7.7.2. The Middle-East and Africa Automotive Composite Materials Market, by Country, 2019&2026 (USD Million)
      3. 7.7.3. The Middle-East and Africa Automotive Composite Materials Market, by Manufacturing Process, 2016-2026
        1. 7.7.3.1. The Middle-East and Africa Automotive Composite Materials Market, by Manufacturing Process, 2016-2026 (USD Million)
      4. 7.7.4. The Middle-East and Africa Automotive Composite Materials Market, by Material, 2016-2026
        1. 7.7.4.1. The Middle-East and Africa Automotive Composite Materials Market, by Material, 2016-2026 (USD Million)
      5. 7.7.5. The Middle-East and Africa Automotive Composite Materials Market, by Resin, 2016-2026
        1. 7.7.5.1. The Middle-East and Africa Automotive Composite Materials Market, by Resin, 2016-2026 (USD Million)
      6. 7.7.6. The Middle-East and Africa Automotive Composite Materials Market, by Fiber, 2016-2026
        1. 7.7.6.1. The Middle-East and Africa Automotive Composite Materials Market, by Fiber, 2016-2026 (USD Million)
      7. 7.7.7. The Middle-East and Africa Automotive Composite Materials Market, by Application, 2016-2026
        1. 7.7.7.1. The Middle-East and Africa Automotive Composite Materials Market, by Application, 2016-2026 (USD Million)
      8. 7.7.8. GCC Countries
        1. 7.7.8.1. GCC Countries Market size and forecast, 2016-2026 (USD Million)
      9. 7.7.9. South Africa
        1. 7.7.9.1. South Africa Market size and forecast, 2016-2026 (USD Million)
      10. 7.7.10. Rest of Middle-East Africa
        1. 7.7.10.1. Rest of Middle-East Africa Market size and forecast, 2016-2026 (USD Million)
  8. CHAPTER 8. Automotive Composite Materials market – Competitive Landscape
    1. 8.1. Competitor Market Share – Revenue
    2. 8.2. Market Concentration Rate Analysis, Top 3 and Top 5 Players
    3. 8.3. Strategic Development
      1. 8.3.1. Acquisitions and Mergers
      2. 8.3.2. New Products
      3. 8.3.3. Research & Development Activities
  9. CHAPTER 9. Company Profiles
    1. 9.1. Toray Industries, Inc.
      1. 9.1.1. Company Overview
      2. 9.1.2. Toray Industries, Inc. Revenue and Gross Margin
      3. 9.1.3. Product portfolio
      4. 9.1.4. Recent initiatives
    2. 9.2. SGL Carbon SE
      1. 9.2.1. Company Overview
      2. 9.2.2. SGL Carbon SE Revenue and Gross Margin
      3. 9.2.3. Product portfolio
      4. 9.2.4. Recent initiatives
    3. 9.3. Solvay S.A.
      1. 9.3.1. Company Overview
      2. 9.3.2. Solvay S.A. Revenue and Gross Margin
      3. 9.3.3. Product portfolio
      4. 9.3.4. Recent initiatives
    4. 9.4. UFP Technologies, Inc
      1. 9.4.1. Company Overview
      2. 9.4.2. UFP Technologies, Inc Revenue and Gross Margin
      3. 9.4.3. Product portfolio
      4. 9.4.4. Recent initiatives
    5. 9.5. Koninklijke Ten Cate bv
      1. 9.5.1. Company Overview
      2. 9.5.2. Koninklijke Ten Cate bv Revenue and Gross Margin
      3. 9.5.3. Product portfolio
      4. 9.5.4. Recent initiatives
    6. 9.6. Gurit
      1. 9.6.1. Company Overview
      2. 9.6.2. Gurit Revenue and Gross Margin
      3. 9.6.3. Product portfolio
      4. 9.6.4. Recent initiatives
    7. 9.7. Toho Tenax Co., Ltd.
      1. 9.7.1. Company Overview
      2. 9.7.2. Toho Tenax Co., Ltd. Revenue and Gross Margin
      3. 9.7.3. Product portfolio
      4. 9.7.4. Recent initiatives
    8. 9.8. Mitsubishi Chemical Corporation
      1. 9.8.1. Company Overview
      2. 9.8.2. Mitsubishi Chemical Corporation Revenue and Gross Margin
      3. 9.8.3. Product portfolio
      4. 9.8.4. Recent initiatives
    9. 9.9. Plasan Carbon Composites, Inc.
      1. 9.9.1. Company Overview
      2. 9.9.2. Plasan Carbon Composites, Inc. Revenue and Gross Margin
      3. 9.9.3. Product portfolio
      4. 9.9.4. Recent initiatives
    10. 9.10. Continental Structural Plastics Inc
      1. 9.10.1. Company Overview
      2. 9.10.2. Continental Structural Plastics Inc Revenue and Gross Margin
      3. 9.10.3. Product portfolio
      4. 9.10.4. Recent initiatives
    11. 9.11. Owens Corning
      1. 9.11.1. Company Overview
      2. 9.11.2. Owens Corning Revenue and Gross Margin
      3. 9.11.3. Product portfolio
      4. 9.11.4. Recent initiatives
    12. 9.12. Braj Binani Group
      1. 9.12.1. Company Overview
      2. 9.12.2. Braj Binani Group Revenue and Gross Margin
      3. 9.12.3. Product portfolio
      4. 9.12.4. Recent initiatives
    13. 9.13. Hexcel Corporation
      1. 9.13.1. Company Overview
      2. 9.13.2. Hexcel Corporation Revenue and Gross Margin
      3. 9.13.3. Product portfolio
      4. 9.13.4. Recent initiatives
    14. 9.14. Mubea Carbo Tech GmbH
      1. 9.14.1. Company Overview
      2. 9.14.2. Mubea Carbo Tech GmbH Revenue and Gross Margin
      3. 9.14.3. Product portfolio
      4. 9.14.4. Recent initiatives
    15. 9.15. Mubea Carbo Tech GmbH
      1. 9.15.1. Company Overview
      2. 9.15.2. Mubea Carbo Tech GmbH Revenue and Gross Margin
      3. 9.15.3. Product portfolio
      4. 9.15.4. Recent initiatives
    16. 9.16. GMS Composites
      1. 9.16.1. Company Overview
      2. 9.16.2. GMS Composites Revenue and Gross Margin
      3. 9.16.3. Product portfolio
      4. 9.16.4. Recent initiatives
    17. 9.17. TPI Composites Inc
      1. 9.17.1. Company Overview
      2. 9.17.2. TPI Composites Inc Revenue and Gross Margin
      3. 9.17.3. Product portfolio
      4. 9.17.4. Recent initiatives
    18. 9.18. Hanwha Azdel, Inc.
      1. 9.18.1. Company Overview
      2. 9.18.2. Hanwha Azdel, Inc. Revenue and Gross Margin
      3. 9.18.3. Product portfolio
      4. 9.18.4. Recent initiatives
    19. 9.19. Magna International Inc.
      1. 9.19.1. Company Overview
      2. 9.19.2. Magna International Inc. Revenue and Gross Margin
      3. 9.19.3. Product portfolio
      4. 9.19.4. Recent initiatives
    20. 9.20. Mahindra CIE Automotive Ltd.
      1. 9.20.1. Company Overview
      2. 9.20.2. Mahindra CIE Automotive Ltd. Revenue and Gross Margin
      3. 9.20.3. Product portfolio
      4. 9.20.4. Recent initiatives
    21. 9.21. Hyosung Advanced Materials Corp
      1. 9.21.1. Company Overview
      2. 9.21.2. Hyosung Advanced Materials Corp Revenue and Gross Margin
      3. 9.21.3. Product portfolio
      4. 9.21.4. Recent initiatives
    22. 9.22. DowAksa Advanced Composites
      1. 9.22.1. Company Overview
      2. 9.22.2. DowAksa Advanced Composites Revenue and Gross Margin
      3. 9.22.3. Product portfolio
      4. 9.22.4. Recent initiatives
    23. 9.23. SABIC
      1. 9.23.1. Company Overview
      2. 9.23.2. SABIC Revenue and Gross Margin
      3. 9.23.3. Product portfolio
      4. 9.23.4. Recent initiatives
    24. 9.24. Diab Group
      1. 9.24.1. Company Overview
      2. 9.24.2. Diab Group Revenue and Gross Margin
      3. 9.24.3. Product portfolio
      4. 9.24.4. Recent initiatives
    25. 9.25. Huntsman Corporation
      1. 9.25.1. Company Overview
      2. 9.25.2. Huntsman Corporation Revenue and Gross Margin
      3. 9.25.3. Product portfolio
      4. 9.25.4. Recent initiatives
  10. CHAPTER 10. Automotive Composite Materials — Industry Analysis
    1. 10.1. Automotive Composite Materials Market – Key Trends
      1. 10.1.1. Market Drivers
      2. 10.1.2. Market Restraints
      3. 10.1.3. Market Opportunities
    2. 10.2. Value Chain Analysis
    3. 10.3. Technology Roadmap and Timeline
    4. 10.4. Automotive Composite Materials Market – Attractiveness Analysis
      1. 10.4.1. By Manufacturing Process
      2. 10.4.2. By Material
      3. 10.4.3. By Resin
      4. 10.4.4. By Fiber
      5. 10.4.5. By Application
      6. 10.4.6. By Region
  11. CHAPTER 11. Marketing Strategy Analysis, Distributors
    1. 11.1. Marketing Channel
    2. 11.2. Direct Marketing
    3. 11.3. Indirect Marketing
    4. 11.4. Marketing Channel Development Trend
    5. 11.5. Economic/Political Environmental Change
  12. CHAPTER 12. Report Conclusion
  13. CHAPTER 13. Research Approach & Methodology
    1. 13.1. Report Description
    2. 13.2. Research Scope
    3. 13.3. Research Methodology
      1. 13.3.1. Secondary Research
      2. 13.3.2. Primary Research
      3. 13.3.3. Models
        1. 13.3.3.1. Company Share Analysis Model
        2. 13.3.3.2. Revenue Based Modeling
        3. 13.3.3.3. Research Limitations

        List of Figures

        FIG. 1 Global Automotive Composite Materials Market, 2016-2026 (USD Million)
        FIG. 2 Global Automotive Composite Materials Market Share, by Manufacturing Process, 2019&2026 (USD Million)
        FIG. 3 Global Lay-up Process Automotive Composite Materials Market, 2016-2026 (USD Million)
        FIG. 4 Global Compression Molding Process Automotive Composite Materials Market, 2016-2026 (USD Million)
        FIG. 5 Global Resin Transfer Molding(RTM) Process Automotive Composite Materials Market, 2016-2026 (USD Million)
        FIG. 6 Global Filament Winding Process Automotive Composite Materials Market, 2016-2026 (USD Million)
        FIG. 7 Global Injection Molding Process Automotive Composite Materials Market, 2016-2026 (USD Million)
        FIG. 8 Global Pultrusion Process Automotive Composite Materials Market, 2016-2026 (USD Million)
        FIG. 9 Global Vacuum Infusion Automotive Composite Materials Market, 2016-2026 (USD Million)
        FIG. 10 Global Other Processes Automotive Composite Materials Market, 2016-2026 (USD Million)
        FIG. 11 Global Automotive Composite Materials Market Share, by Material, 2019&2026 (USD Million)
        FIG. 12 Global Polymer Matrix Composite(PMC) Automotive Composite Materials Market, 2016-2026 (USD Million)
        FIG. 13 Global Metal Matrix Composite (MMC) Automotive Composite Materials Market, 2016-2026 (USD Million)
        FIG. 14 Global Ceramic Matrix Composite (CMC) Automotive Composite Materials Market, 2016-2026 (USD Million)
        FIG. 15 Global Automotive Composite Materials Market Share, by Resin, 2019&2026 (USD Million)
        FIG. 16 Global Thermoplastic Automotive Composite Materials Market, 2016-2026 (USD Million)
        FIG. 17 Global Thermoset Automotive Composite Materials Market, 2016-2026 (USD Million)
        FIG. 18 Global Automotive Composite Materials Market Share, by Fiber, 2019&2026 (USD Million)
        FIG. 19 Global Carbon Automotive Composite Materials Market, 2016-2026 (USD Million)
        FIG. 20 Global Glass Automotive Composite Materials Market, 2016-2026 (USD Million)
        FIG. 21 Global Others Automotive Composite Materials Market, 2016-2026 (USD Million)
        FIG. 22 Global Automotive Composite Materials Market Share, by Application, 2019&2026 (USD Million)
        FIG. 23 Global Interior Automotive Composite Materials Market, 2016-2026 (USD Million)
        FIG. 24 Global Exterior Automotive Composite Materials Market, 2016-2026 (USD Million)
        FIG. 25 Global Powertrain Automotive Composite Materials Market, 2016-2026 (USD Million)
        FIG. 26 Global Structural Automotive Composite Materials Market, 2016-2026 (USD Million)
        FIG. 27 Global Others Automotive Composite Materials Market, 2016-2026 (USD Million)
        FIG. 28 Global Automotive Composite Materials Market Share, by Region, 2019&2026
        FIG. 29 North America Automotive Composite Materials Market, 2016-2026
        FIG. 30 U.S. Automotive Composite Materials Market, 2016-2026
        FIG. 31 Canada Automotive Composite Materials Market, 2016-2026
        FIG. 32 Europe Automotive Composite Materials Market, 2016-2026
        FIG. 33 Germany Automotive Composite Materials Market, 2016-2026
        FIG. 34 France Automotive Composite Materials Market, 2016-2026
        FIG. 35 U.K. Automotive Composite Materials Market, 2016-2026
        FIG. 36 Italy Automotive Composite Materials Market, 2016-2026
        FIG. 37 Spain Automotive Composite Materials Market, 2016-2026
        FIG. 38 Rest of Europe Automotive Composite Materials Market, 2016-2026
        FIG. 39 Asia Pacific Automotive Composite Materials Market, 2016-2026
        FIG. 40 China Automotive Composite Materials Market, 2016-2026
        FIG. 41 Japan Automotive Composite Materials Market, 2016-2026
        FIG. 42 India Automotive Composite Materials Market, 2016-2026
        FIG. 43 South  Korea Automotive Composite Materials Market, 2016-2026
        FIG. 44 South-East Asia Automotive Composite Materials Market, 2016-2026
        FIG. 45 Rest of Asia Pacific Automotive Composite Materials Market, 2016-2026
        FIG. 46 Latin America Automotive Composite Materials Market, 2016-2026
        FIG. 47 Brazil Automotive Composite Materials Market, 2016-2026
        FIG. 48 Mexico Automotive Composite Materials Market, 2016-2026
        FIG. 49 Rest of Latin America Automotive Composite Materials Market, 2016-2026
        FIG. 50 The Middle-East and Africa Automotive Composite Materials Market, 2016-2026
        FIG. 51 GCC Countries Automotive Composite Materials Market, 2016-2026
        FIG. 52 South Africa Automotive Composite Materials Market, 2016-2026
        FIG. 53 Rest of Middle-East Africa Automotive Composite Materials Market, 2016-2026
        FIG. 54 Competitor Market Share – Revenue
        FIG. 55 Toray Industries, Inc. Revenue and Growth Rate
        FIG. 56 Toray Industries, Inc. Market Share
        FIG. 57 SGL Carbon SE Revenue and Growth Rate
        FIG. 58 SGL Carbon SE Market Share
        FIG. 59 Solvay S.A. Revenue and Growth Rate
        FIG. 60 Solvay S.A. Market Share
        FIG. 61 UFP Technologies, Inc Revenue and Growth Rate
        FIG. 62 UFP Technologies, Inc Market Share
        FIG. 63 Koninklijke Ten Cate bv Revenue and Growth Rate
        FIG. 64 Koninklijke Ten Cate bv Market Share
        FIG. 65 Gurit Revenue and Growth Rate
        FIG. 66 Gurit Market Share
        FIG. 67 Toho Tenax Co., Ltd. Revenue and Growth Rate
        FIG. 68 Toho Tenax Co., Ltd. Market Share
        FIG. 69 Mitsubishi Chemical Corporation Revenue and Growth Rate
        FIG. 70 Mitsubishi Chemical Corporation Market Share
        FIG. 71 Plasan Carbon Composites, Inc. Revenue and Growth Rate
        FIG. 72 Plasan Carbon Composites, Inc. Market Share
        FIG. 73 Continental Structural Plastics Inc Revenue and Growth Rate
        FIG. 74 Continental Structural Plastics Inc Market Share
        FIG. 75 Owens Corning Revenue and Growth Rate
        FIG. 76 Owens Corning Market Share
        FIG. 77 Braj Binani Group Revenue and Growth Rate
        FIG. 78 Braj Binani Group Market Share
        FIG. 79 Hexcel Corporation Revenue and Growth Rate
        FIG. 80 Hexcel Corporation Market Share
        FIG. 81 Mubea Carbo Tech GmbH Revenue and Growth Rate
        FIG. 82 Mubea Carbo Tech GmbH Market Share
        FIG. 83 Mubea Carbo Tech GmbH Revenue and Growth Rate
        FIG. 84 Mubea Carbo Tech GmbH Market Share
        FIG. 85 GMS Composites Revenue and Growth Rate
        FIG. 86 GMS Composites Market Share
        FIG. 87 TPI Composites Inc Revenue and Growth Rate
        FIG. 88 TPI Composites Inc Market Share
        FIG. 89 Hanwha Azdel, Inc. Revenue and Growth Rate
        FIG. 90 Hanwha Azdel, Inc. Market Share
        FIG. 91 Magna International Inc. Revenue and Growth Rate
        FIG. 92 Magna International Inc. Market Share
        FIG. 93 Mahindra CIE Automotive Ltd. Revenue and Growth Rate
        FIG. 94 Mahindra CIE Automotive Ltd. Market Share
        FIG. 95 Hyosung Advanced Materials Corp Revenue and Growth Rate
        FIG. 96 Hyosung Advanced Materials Corp Market Share
        FIG. 97 DowAksa Advanced Composites Revenue and Growth Rate
        FIG. 98 DowAksa Advanced Composites Market Share
        FIG. 99 SABIC Revenue and Growth Rate
        FIG. 100 SABIC Market Share
        FIG. 101 Diab Group Revenue and Growth Rate
        FIG. 102 Diab Group Market Share
        FIG. 103 Huntsman Corporation Revenue and Growth Rate
        FIG. 104 Huntsman Corporation Market Share
        FIG. 105 Market Dynamics
        FIG. 106 Global Automotive Composite Materials – Value Chain Analysis
        FIG. 107 Technology Roadmap and Timeline
        FIG. 108 Market Attractiveness Analysis – By Manufacturing Process
        FIG. 109 Market Attractiveness Analysis – By Material
        FIG. 110 Market Attractiveness Analysis – By Resin
        FIG. 111 Market Attractiveness Analysis – By Fiber
        FIG. 112 Market Attractiveness Analysis – By Application
        FIG. 113 Market Attractiveness Analysis – By Region
        FIG. 114 Market Channel
        FIG. 115 Marketing Channel Development Trend
        FIG. 116 Growth in World Gross Product, 2008-2019

        List of Tables

        TABLE 1 Global Automotive Composite Materials Market, 2019&2026 (USD Million)
        TABLE 2 Global Automotive Composite Materials market, by Manufacturing Process, 2016-2026 (USD Million)
        TABLE 3 Global Automotive Composite Materials market, by Material, 2016-2026 (USD Million)
        TABLE 4 Global Automotive Composite Materials market, by Resin, 2016-2026 (USD Million)
        TABLE 5 Global Automotive Composite Materials market, by Fiber, 2016-2026 (USD Million)
        TABLE 6 Global Automotive Composite Materials market, by Application, 2016-2026 (USD Million)
        TABLE 7 Global Automotive Composite Materials market, by Region, 2016-2026 (USD Million)
        TABLE 8 North America Automotive Composite Materials Market, by Manufacturing Process, 2016-2026 (USD Million)
        TABLE 9 North America Automotive Composite Materials Market, by Material, 2016-2026 (USD Million)
        TABLE 10 North America Automotive Composite Materials Market, by Resin, 2016-2026 (USD Million)
        TABLE 11 North America Automotive Composite Materials Market, by Fiber, 2016-2026 (USD Million)
        TABLE 12 North America Automotive Composite Materials Market, by Application, 2016-2026 (USD Million)
        TABLE 13 Europe Automotive Composite Materials Market, by Manufacturing Process, 2016-2026 (USD Million)
        TABLE 14 Europe Automotive Composite Materials Market, by Material, 2016-2026 (USD Million)
        TABLE 15 Europe Automotive Composite Materials Market, by Resin, 2016-2026 (USD Million)
        TABLE 16 Europe Automotive Composite Materials Market, by Fiber, 2016-2026 (USD Million)
        TABLE 17 Europe Automotive Composite Materials Market, by Application, 2016-2026 (USD Million)
        TABLE 18 Asia Pacific Automotive Composite Materials Market, by Manufacturing Process, 2016-2026 (USD Million)
        TABLE 19 Asia Pacific Automotive Composite Materials Market, by Material, 2016-2026 (USD Million)
        TABLE 20 Asia Pacific Automotive Composite Materials Market, by Resin, 2016-2026 (USD Million)
        TABLE 21 Asia Pacific Automotive Composite Materials Market, by Fiber, 2016-2026 (USD Million)
        TABLE 22 Asia Pacific Automotive Composite Materials Market, by Application, 2016-2026 (USD Million)
        TABLE 23 Latin America Automotive Composite Materials Market, by Manufacturing Process, 2016-2026 (USD Million)
        TABLE 24 Latin America Automotive Composite Materials Market, by Material, 2016-2026 (USD Million)
        TABLE 25 Latin America Automotive Composite Materials Market, by Resin, 2016-2026 (USD Million)
        TABLE 26 Latin America Automotive Composite Materials Market, by Fiber, 2016-2026 (USD Million)
        TABLE 27 Latin America Automotive Composite Materials Market, by Application, 2016-2026 (USD Million)
        TABLE 28 The Middle-East and Africa Automotive Composite Materials Market, by Manufacturing Process, 2016-2026 (USD Million)
        TABLE 29 The Middle-East and Africa Automotive Composite Materials Market, by Material, 2016-2026 (USD Million)
        TABLE 30 The Middle-East and Africa Automotive Composite Materials Market, by Resin, 2016-2026 (USD Million)
        TABLE 31 The Middle-East and Africa Automotive Composite Materials Market, by Fiber, 2016-2026 (USD Million)
        TABLE 32 The Middle-East and Africa Automotive Composite Materials Market, by Application, 2016-2026 (USD Million)
        TABLE 33 Global Automotive Composite Materials Market - Company Revenue Analysis 2016-2019 (USD Million)
        TABLE 34 Global Automotive Composite Materials Market - Company Revenue Share Analysis 2016-2019(%)
        TABLE 35 Acquisitions and Mergers
        TABLE 36 New Product/Service Launch
        TABLE 37 Research & Development Activities
        TABLE 38 Market Drivers
        TABLE 39 Market Restraints
        TABLE 40 Market Opportunities

Industry Major Market Players

  • Toray Industries Inc.
  •  SGL Carbon SE
  •  Solvay S.A.
  •  UFP Technologies Inc
  •  Koninklijke Ten Cate bv
  •  Gurit
  •  Toho Tenax Co. Ltd.
  •  Mitsubishi Chemical Corporation
  •  Plasan Carbon Composites Inc.
  •  Continental Structural Plastics Inc
  •  Owens Corning
  •  BrajBinani Group
  •  Hexcel Corporation
  •  MubeaCarbo Tech GmbH
  •  MubeaCarbo Tech GmbH
  •  GMS Composites
  •  TPI Composites Inc
  •  Hanwha Azdel Inc.
  •  Magna International Inc.