![]()
Search Market Research Report
Automated Colony Counter Market Size, Share Global Analysis Report, 2018 – 2027

Automated Colony Counter Market By Application (Microbiology Studies, Hygiene Studies, Antibiotic Testing, Fluids Contamination, and GFP Colonies) and By End-User (Medical Labs, Scientific Research Labs, Industries, and Others): Global Industry Perspective, Comprehensive Analysis, and Forecast 2018 – 2027
Industry Insights
The report covers the forecast and analysis of the Automated Colony Counter market on a global and regional level. The study provides historical data from 2013 to 2018 along with a forecast from 2019 to 2027 based on revenue (USD Million). The study includes drivers and restraints of the Automated Colony Counter market along with the impact they have on the demand over the forecast period. Additionally, the report includes the study of opportunities available in the Automated Colony Counter market on a global level.
In order to give the users of this report a comprehensive view of the Automated Colony Counter market, we have included a competitive landscape and an analysis of Porter&rsquo's Five Forces model for the market. The study encompasses a market attractiveness analysis, wherein all the segments are benchmarked based on their market size, growth rate, and general attractiveness.
The report provides a company market share analysis to give a broader overview of the key players in the market. In addition, the report also covers key strategic developments of the market including acquisitions & mergers, new product & service launches, agreements, partnerships, collaborations & joint ventures, research & development, and regional expansion of major participants involved in the market on a global and regional basis.
The study provides a decisive view of the Automated Colony Counter market by segmenting the market based on application, end-user, and regions. All the segments have been analyzed based on present and future trends and the market is estimated from 2019 to 2027. The regional segmentation includes the current and forecast demand for North America, Europe, Asia Pacific, Latin America, and the Middle East and Africa.
Moreover, an increase in the cases of contagious ailments and disease outbreaks along with the coining of new strategies to curb the diseases will transform into a humungous market surge over the forecast period. Nevertheless, huge prices of automated colony counters will inhibit the expansion of the industry over the forecast timeline.
On the basis of application, the industry is segregated into Microbiology Studies, Hygiene Studies, Antibiotic Testing, Fluids Contamination, and GFP Colonies. Based on the end-user, the market is classified into Medical Labs, Scientific Research Labs, Industries, and Others.
 Report Scope
Report Attribute |
Details |
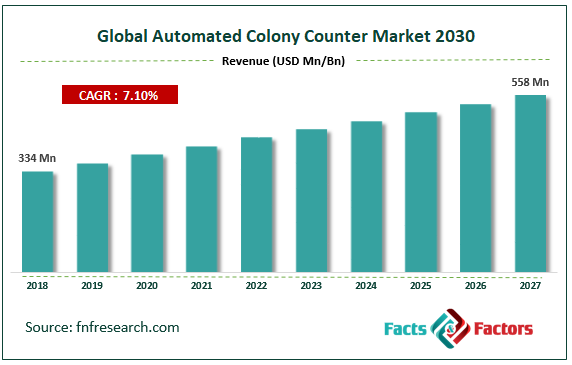
Market Size in 2018 |
USD 334 Million |
Projected Market Size in 2027 |
USD 558 Million |
CAGR Growth Rate |
7.1% CAGR |
Base1820 |
|
Forecast Years |
2018-2027 |
Key Market Players |
UVP, LLC, Autoimmun Diagnostika GmbH, Bioavlee Sp., bioMérieux, Inc., Synbiosis, A Division of Synoptics Ltd., Boeckel Co (GmbH Co.) KG, Interscience, Labline Stock Centre, Molecular Devices, LLC, Neu-tec Group Inc., Patel Scientific Instruments Pvt Ltd., SM Scientific Instruments Pvt. Ltd., Spectronics India, Suntex Instruments Co., Ltd., Xylem Analytics Germany Sales GmbH & Co. KG., and Zenith Engineers (Biozen). |
Key Segment |
By Application, By End-User, By Region |
Major Regions Covered |
North America, Europe, Asia Pacific, Latin America, and the Middle East & Africa |
Purchase Options |
Request customized purchase options to meet your research needs. Explore purchase options |
Some of the key participants in the business include
- UVP LLC
- Autoimmun Diagnostika GmbH
- Bioavlee Sp.
- bioMérieux Inc.
- Synbiosis
- A Division of Synoptics Ltd.
- Boeckel Co (GmbH Co.) KG
- Interscience
- Labline Stock Centre
- Molecular Devices LLC
- Neu-tec Group Inc.
- Patel Scientific Instruments Pvt Ltd.
- SM Scientific Instruments Pvt. Ltd.
- Spectronics India
- Suntex Instruments Co. Ltd.
- Xylem Analytics Germany Sales GmbH & Co. KG.
- Zenith Engineers (Biozen).
Table of Content
Industry Major Market Players
- UVP LLC
- Autoimmun Diagnostika GmbH
- BIOAVLEE Sp. bioMérieux Inc.
- Synbiosis
- A Division of Synoptics Ltd.
- Boeckel Co (GmbH Co.) KG
- INTERSCIENCE
- Labline Stock Centre
- Molecular Devices LLC
- Neu-tec Group Inc.
- PATEL SCIENTIFIC INSTRUMENTS PVT LTD.
- SM Scientific Instruments Pvt. Ltd.
- Spectronics India
- Suntex Instruments Co. Ltd.
- Xylem Analytics Germany Sales GmbH & Co. KG.
- and ZENITH ENGINEERS (Biozen)


Copyright © 2025 - 2026, All Rights Reserved, Facts and Factors