Search Market Research Report

Discover Our Latest Reports
Discover Our Featured Reports
Discover Top Selling Reports

Ataxia Market Size, Share Global Analysis Report, , 2021 – 2026

report img

Ataxia Market By Disease Type (Idiopathic, Acquired Ataxia, and Genetic Ataxia), By Treatment Type (Speech Therapy, Physical Therapy, Pharmacotherapy, and Others), and By Distribution Channel (Hospital Pharmacies, Online Pharmacies, and Retail Pharmacies): Global Industry Perspective, Comprehensive Analysis, and Forecast, 2021 – 2026

Industry Insights

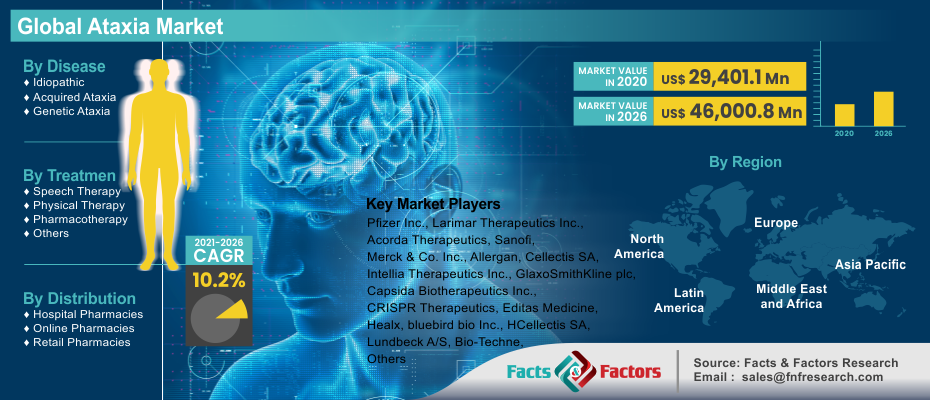
According to the report published by the Facts and Factors, global demand for the ataxia market was estimated at approximately USD 29,401.1 Million in 2020 and is expected to generate revenue of around USD 46,000.8 Million by the end of 2026, growing at a CAGR of around 10.2% between 2021 and 2026.

logoMarket Overview

Ataxia is a type of group of degenerative neurological diseases, which affects the coordination and movement center of the brain (cerebellum). People with ataxia have trouble in speech, swallowing, and coordination or maintaining balance. In addition, the ataxia has been bifurcated into three types based on the cause: genetic ataxia, acquired ataxia, and idiopathic ataxia. The genetic ataxia is caused due to the damaged gene that leads to ataxia, which is passed from one generation to the other generation. The acquired ataxia is caused due to external factors such as head trauma, vitamin deficiencies, brain tumor, microbial infection, and exposure to alcohol or drugs. The idiopathic ataxia is a kind of condition in which the cause is unidentified.

Ataxia could develop at any age group and is developing in nature; especially, it gets worse with time. Several symptoms related to the ataxia consist of difficulty in walking, a decrease in coordination, and impaired balance with frequent falls, muscle tremors, vision problems, loss of fine motor skills, slurred speech, and others.

Ataxia Market

To know more about this report | Request Free Sample Copy

logoIndustry Growth Factor

The ataxia market is expected to observe a major growth rate during the forecast period. The increase in cases of ataxia and a constantly improving rate of diagnosis and treatment are key factors driving the growth of the global ataxia market. Another important aspect that is propelling the market growth includes numerous technological developments in pharmacotherapy, offering treatment against the symptoms of ataxia. Moreover, the broad research and development activities with the pipeline drugs are likely to fuel the market growth over the analysis period. Besides, the increasing support from numerous organizations is helping the market size to grow.

On the other hand, the lack of product approval against the ataxia treatment might restrain the market expansion in the upcoming years. Also, the current expiry of a few drugs to give treatment against symptomatic ataxia can limit the market growth. Conversely, the rising count of government initiatives to augment awareness regarding ataxia is bringing lucrative opportunities for the market.

logoSegmentation Analysis

The global ataxia market has been segmented into disease type, treatment type, and distribution channel. On the basis of the type of disease, the global ataxia market has been classified into idiopathic, acquired ataxia, and genetic ataxia. Based on the type of treatment, the global ataxia market has been categorized into speech therapy, physical therapy, pharmacotherapy, and others. In terms of distribution channels, the global ataxia market has been bifurcated into hospital pharmacies, online pharmacies, and retail pharmacies.

logo Report Scope

Report Attribute

Details

Market Size in 2020

USD 29,401.1 Million

Projected Market Size in 2026

USD 46,000.8 Million

CAGR Growth Rate

10.2% CAGR

Base Year

2020

Forecast Years

2021-2026

Key Market Players

CRISPR Therapeutics, GlaxoSmithKline plc, Capsida Biotherapeutics Inc., Pfizer Inc., Bio-Techne, Acorda Therapeutics, Cellectis SA, Larimar Therapeutics Inc., H. Lundbeck A/S, Sanofi, bluebird bio Inc., Merck & Co. Inc., Editas Medicine, Cellectis SA, Healx, Allergan, and Intellia Therapeutics Inc., among others.

Key Segment

By Disease Type, By Treatment Type, By Distribution Channel, and By Region

Major Regions Covered

North America, Europe, Asia Pacific, Latin America, and the Middle East & Africa

Purchase Options

Request customized purchase options to meet your research needs. Explore purchase options

logo Regional Analysis

On the basis of regional analysis, the ataxia market is segmented into five major regions, namely, North America, Latin America, Asia-Pacific, Europe, and the Middle East, and Africa. In terms of revenue, the North American region is dominating the global ataxia market. The increasing financial support from the government, along with the increasing cases of ataxia, which is contributing to the support organization for the patient diagnosis and treatment, are factors that are expected to contribute significantly to the regional market upsurge.

The Asia-Pacific ataxia market is anticipated to have a significant place in the market during the forecast period. This quick market development in the region is because of key factors like the augmented population with the genetic strains of ataxia and the increase in awareness associated with ataxia. Additionally, the government is also taking programs to cut down the disorders regarding ataxia. This, in turn, will probably stimulate opportunities in the global ataxia market.

logo Competitive Players

Major companies operating in the global ataxia market include:

  • CRISPR Therapeutics
  • GlaxoSmithKline plc
  • Capsida Biotherapeutics Inc.
  • Pfizer Inc.
  • Bio-Techne
  • Acorda Therapeutics
  • Cellectis SA
  • Larimar Therapeutics Inc.
  • H. Lundbeck A/S
  • Sanofi
  • bluebird bio Inc.
  • Merck & Co. Inc.
  • Editas Medicine
  • Cellectis SA
  • Healx
  • Allergan
  • Intellia Therapeutics Inc.

In addition, the leading companies driving in the ataxia market are adopting several strategies such as new product launches, collaborations, and product approvals, which in turn, are fuelling the ataxia market expansion across the globe.

logo Disease Type Segment Analysis

  • Idiopathic
  • Acquired Ataxia
  • Genetic Ataxia

logo Treatment Type Segment Analysis

  • Speech Therapy
  • Physical Therapy
  • Pharmacotherapy
  • Others

logo Distribution Channel Segment Analysis

  • Hospital Pharmacies
  • Online Pharmacies
  • Retail Pharmacies

logo Regional Segment Analysis

  • North America
    • U.S.
    • Canada
  • Europe
    • U.K.
    • France
    • Germany
    • Rest of Europe
  • Asia Pacific
    • China
    • Japan
    • India
    • South Korea
    • Rest of Asia Pacific
  • Latin America
    • Brazil
    • Rest of Latin America
  • The Middle East and Africa
    • GCC Countries
    • South Africa
    • Rest of Middle East Africa

Table of Content

  1. Chapter 1 Executive Summary
    1. 1.1. Introduction of Ataxia
    2. 1.2. Global Ataxia Market, 2019 & 2026 (USD Million)
    3. 1.3. Global Ataxia Market, 2016 – 2026(USD Million)
    4. 1.4. Global Ataxia MarketAbsolute Revenue Opportunity, 2016 – 2026(USD Million)
    5. 1.5. Global Ataxia MarketIncremental Revenue Opportunity, 2020 – 2026(USD Million)
  2. Chapter 2 Ataxia Market – Disease Type Analysis
    1. 2.1. Global Ataxia Market – Disease Type Overview
    2. 2.2. Global Ataxia Market Share, by Disease Type, 2019 & 2026(USD Million)
    3. 2.3. Idiopathic
      1. 2.3.1. Global Idiopathic Ataxia Market, 2016 – 2026(USD Million)
    4. 2.4. Acquired Ataxia
      1. 2.4.1. Global Acquired Ataxia Ataxia Market, 2016 – 2026(USD Million)
    5. 2.5. Genetic Ataxia
      1. 2.5.1. Global Genetic Ataxia Ataxia Market, 2016 – 2026(USD Million)
  3. Chapter 3 Ataxia Market – Treatment Type Analysis
    1. 3.1. Global Ataxia Market – Treatment Type Overview
    2. 3.2. Global Ataxia Market Share, by Treatment Type, 2019 & 2026(USD Million)
    3. 3.3. Speech Therapy
      1. 3.3.1. Global Speech Therapy Ataxia Market, 2016 – 2026(USD Million)
    4. 3.4. Physical Therapy
      1. 3.4.1. Global Physical Therapy Ataxia Market, 2016 – 2026(USD Million)
    5. 3.5. Pharmacotherapy
      1. 3.5.1. Global Pharmacotherapy Ataxia Market, 2016 – 2026(USD Million)
    6. 3.6. Others
      1. 3.6.1. Global Others Ataxia Market, 2016 – 2026(USD Million)
  4. Chapter 4 Ataxia Market – Distribution Channel Analysis
    1. 4.1. Global Ataxia Market – Distribution Channel Overview
    2. 4.2. Global Ataxia Market Share, by Distribution Channel, 2019 & 2026(USD Million)
    3. 4.3. Hospital Pharmacies
      1. 4.3.1. Global Hospital Pharmacies Ataxia Market, 2016 – 2026(USD Million)
    4. 4.4. Online Pharmacies
      1. 4.4.1. Global Online Pharmacies Ataxia Market, 2016 – 2026(USD Million)
    5. 4.5. Retail Pharmacies
      1. 4.5.1. Global Retail Pharmacies Ataxia Market, 2016 – 2026(USD Million)
  5. Chapter 5 Ataxia Market – Regional Analysis
    1. 5.1. Global Ataxia Market Regional Overview
    2. 5.2. Global Ataxia Market Share, by Region, 2019 & 2026(USD Million)
    3. 5.3. North America
      1. 5.3.1. North America Ataxia Market, 2016 – 2026(USD Million)
        1. 5.3.1.1. North America Ataxia Market, by Country, 2016 - 2026(USD Million)
      2. 5.3.2. North America Ataxia Market, by Disease Type, 2016 – 2026
        1. 5.3.2.1. North America Ataxia Market, by Disease Type, 2016 – 2026(USD Million)
      3. 5.3.3. North America Ataxia Market, by Treatment Type, 2016 – 2026
        1. 5.3.3.1. North America Ataxia Market, by Treatment Type, 2016 – 2026(USD Million)
      4. 5.3.4. North America Ataxia Market, by Distribution Channel, 2016 – 2026
        1. 5.3.4.1. North America Ataxia Market, by Distribution Channel, 2016 – 2026(USD Million)
      5. 5.3.5. U.S.
        1. 5.3.5.1. U.S. Ataxia Market, 2016 – 2026(USD Million)
      6. 5.3.6. Canada
        1. 5.3.6.1. Canada Ataxia Market, 2016 – 2026(USD Million)
    4. 5.4. Europe
      1. 5.4.1. Europe Ataxia Market, 2016 – 2026(USD Million)
        1. 5.4.1.1. Europe Ataxia Market, by Country, 2016 - 2026(USD Million)
      2. 5.4.2. Europe Ataxia Market, by Disease Type, 2016 – 2026
        1. 5.4.2.1. Europe Ataxia Market, by Disease Type, 2016 – 2026(USD Million)
      3. 5.4.3. Europe Ataxia Market, by Treatment Type, 2016 – 2026
        1. 5.4.3.1. Europe Ataxia Market, by Treatment Type, 2016 – 2026(USD Million)
      4. 5.4.4. Europe Ataxia Market, by Distribution Channel, 2016 – 2026
        1. 5.4.4.1. Europe Ataxia Market, by Distribution Channel, 2016 – 2026(USD Million)
      5. 5.4.5. Germany
        1. 5.4.5.1. Germany Ataxia Market, 2016 – 2026(USD Million)
      6. 5.4.6. France
        1. 5.4.6.1. France Ataxia Market, 2016 – 2026(USD Million)
      7. 5.4.7. U.K.
        1. 5.4.7.1. U.K. Ataxia Market, 2016 – 2026(USD Million)
      8. 5.4.8. Italy
        1. 5.4.8.1. Italy Ataxia Market, 2016 – 2026(USD Million)
      9. 5.4.9. Spain
        1. 5.4.9.1. Spain Ataxia Market, 2016 – 2026(USD Million)
      10. 5.4.10. Rest of Europe
        1. 5.4.10.1. Rest of Europe Ataxia Market, 2016 – 2026(USD Million)
    5. 5.5. Asia Pacific
      1. 5.5.1. Asia Pacific Ataxia Market, 2016 – 2026(USD Million)
        1. 5.5.1.1. Asia Pacific Ataxia Market, by Country, 2016 - 2026(USD Million)
      2. 5.5.2. Asia Pacific Ataxia Market, by Disease Type, 2016 – 2026
        1. 5.5.2.1. Asia Pacific Ataxia Market, by Disease Type, 2016 – 2026(USD Million)
      3. 5.5.3. Asia Pacific Ataxia Market, by Treatment Type, 2016 – 2026
        1. 5.5.3.1. Asia Pacific Ataxia Market, by Treatment Type, 2016 – 2026(USD Million)
      4. 5.5.4. Asia Pacific Ataxia Market, by Distribution Channel, 2016 – 2026
        1. 5.5.4.1. Asia Pacific Ataxia Market, by Distribution Channel, 2016 – 2026(USD Million)
      5. 5.5.5. China
        1. 5.5.5.1. China Ataxia Market, 2016 – 2026(USD Million)
      6. 5.5.6. Japan
        1. 5.5.6.1. Japan Ataxia Market, 2016 – 2026(USD Million)
      7. 5.5.7. India
        1. 5.5.7.1. India Ataxia Market, 2016 – 2026(USD Million)
      8. 5.5.8. South Korea
        1. 5.5.8.1. South Korea Ataxia Market, 2016 – 2026(USD Million)
      9. 5.5.9. South-East Asia
        1. 5.5.9.1. South-East Asia Ataxia Market, 2016 – 2026(USD Million)
      10. 5.5.10. Rest of Asia Pacific
        1. 5.5.10.1. Rest of Asia Pacific Ataxia Market, 2016 – 2026(USD Million)
    6. 5.6. Latin America
      1. 5.6.1. Latin America Ataxia Market, 2016 – 2026(USD Million)
        1. 5.6.1.1. Latin America Ataxia Market, by Country, 2016 - 2026(USD Million)
      2. 5.6.2. Latin America Ataxia Market, by Disease Type, 2016 – 2026
        1. 5.6.2.1. Latin America Ataxia Market, by Disease Type, 2016 – 2026(USD Million)
      3. 5.6.3. Latin America Ataxia Market, by Treatment Type, 2016 – 2026
        1. 5.6.3.1. Latin America Ataxia Market, by Treatment Type, 2016 – 2026(USD Million)
      4. 5.6.4. Latin America Ataxia Market, by Distribution Channel, 2016 – 2026
        1. 5.6.4.1. Latin America Ataxia Market, by Distribution Channel, 2016 – 2026(USD Million)
      5. 5.6.5. Brazil
        1. 5.6.5.1. Brazil Ataxia Market, 2016 – 2026(USD Million)
      6. 5.6.6. Mexico
        1. 5.6.6.1. Mexico Ataxia Market, 2016 – 2026(USD Million)
      7. 5.6.7. Rest of Latin America
        1. 5.6.7.1. Rest of Latin America Ataxia Market, 2016 – 2026(USD Million)
    7. 5.7. The Middle-East and Africa
      1. 5.7.1. The Middle-East and Africa Ataxia Market, 2016 – 2026(USD Million)
        1. 5.7.1.1. The Middle-East and Africa Ataxia Market, by Country, 2016 - 2026(USD Million)
      2. 5.7.2. The Middle-East and Africa Ataxia Market, by Disease Type, 2016 – 2026
        1. 5.7.2.1. The Middle-East and Africa Ataxia Market, by Disease Type, 2016 – 2026(USD Million)
      3. 5.7.3. The Middle-East and Africa Ataxia Market, by Treatment Type, 2016 – 2026
        1. 5.7.3.1. The Middle-East and Africa Ataxia Market, by Treatment Type, 2016 – 2026(USD Million)
      4. 5.7.4. The Middle-East and Africa Ataxia Market, by Distribution Channel, 2016 – 2026
        1. 5.7.4.1. The Middle-East and Africa Ataxia Market, by Distribution Channel, 2016 – 2026(USD Million)
      5. 5.7.5. GCC Countries
        1. 5.7.5.1. GCC Countries Ataxia Market, 2016 – 2026(USD Million)
      6. 5.7.6. South Africa
        1. 5.7.6.1. South Africa Ataxia Market, 2016 – 2026(USD Million)
      7. 5.7.7. Rest of Middle-East Africa
        1. 5.7.7.1. Rest of Middle-East Africa Ataxia Market, 2016 – 2026(USD Million)
  6. Chapter 6 Ataxia Market – Competitive Landscape
    1. 6.1. Competitor Market Share – Revenue
    2. 6.2. Market Concentration Rate Analysis, Top 3 and Top 5 Players
    3. 6.3. Strategic Developments
      1. 6.3.1. Acquisitions and Mergers
      2. 6.3.2. New Products
      3. 6.3.3. Research & Development Activities
  7. Chapter 7 Company Profiles
    1. 7.1. CRISPR Therapeutics
      1. 7.1.1. Company Overview
      2. 7.1.2. Product/ServicePortfolio
      3. 7.1.3. CRISPR Therapeutics Sales, Revenue, and Gross Margin
      4. 7.1.4. CRISPR Therapeutics Revenue and Growth Rate
      5. 7.1.5. CRISPR Therapeutics Market Share
      6. 7.1.6. Recent Initiatives, Funding/VC Activities, and Technological Innovations
    2. 7.2. GlaxoSmithKline plc
      1. 7.2.1. Company Overview
      2. 7.2.2. Product/ServicePortfolio
      3. 7.2.3. GlaxoSmithKline plc Sales, Revenue, and Gross Margin
      4. 7.2.4. GlaxoSmithKline plc Revenue and Growth Rate
      5. 7.2.5. GlaxoSmithKline plc Market Share
      6. 7.2.6. Recent Initiatives, Funding/VC Activities, and Technological Innovations
    3. 7.3. Capsida Biotherapeutics Inc.
      1. 7.3.1. Company Overview
      2. 7.3.2. Product/ServicePortfolio
      3. 7.3.3. Capsida Biotherapeutics Inc. Sales, Revenue, and Gross Margin
      4. 7.3.4. Capsida Biotherapeutics Inc. Revenue and Growth Rate
      5. 7.3.5. Capsida Biotherapeutics Inc. Market Share
      6. 7.3.6. Recent Initiatives, Funding/VC Activities, and Technological Innovations
    4. 7.4. Pfizer Inc.
      1. 7.4.1. Company Overview
      2. 7.4.2. Product/ServicePortfolio
      3. 7.4.3. Pfizer Inc. Sales, Revenue, and Gross Margin
      4. 7.4.4. Pfizer Inc. Revenue and Growth Rate
      5. 7.4.5. Pfizer Inc. Market Share
      6. 7.4.6. Recent Initiatives, Funding/VC Activities, and Technological Innovations
    5. 7.5. Bio-Techne
      1. 7.5.1. Company Overview
      2. 7.5.2. Product/ServicePortfolio
      3. 7.5.3. Bio-Techne Sales, Revenue, and Gross Margin
      4. 7.5.4. Bio-Techne Revenue and Growth Rate
      5. 7.5.5. Bio-Techne Market Share
      6. 7.5.6. Recent Initiatives, Funding/VC Activities, and Technological Innovations
    6. 7.6. Acorda Therapeutics
      1. 7.6.1. Company Overview
      2. 7.6.2. Product/ServicePortfolio
      3. 7.6.3. Acorda Therapeutics Sales, Revenue, and Gross Margin
      4. 7.6.4. Acorda Therapeutics Revenue and Growth Rate
      5. 7.6.5. Acorda Therapeutics Market Share
      6. 7.6.6. Recent Initiatives, Funding/VC Activities, and Technological Innovations
    7. 7.7. Cellectis SA
      1. 7.7.1. Company Overview
      2. 7.7.2. Product/ServicePortfolio
      3. 7.7.3. Cellectis SA Sales, Revenue, and Gross Margin
      4. 7.7.4. Cellectis SA Revenue and Growth Rate
      5. 7.7.5. Cellectis SA Market Share
      6. 7.7.6. Recent Initiatives, Funding/VC Activities, and Technological Innovations
    8. 7.8. Larimar Therapeutics Inc.
      1. 7.8.1. Company Overview
      2. 7.8.2. Product/ServicePortfolio
      3. 7.8.3. Larimar Therapeutics Inc. Sales, Revenue, and Gross Margin
      4. 7.8.4. Larimar Therapeutics Inc. Revenue and Growth Rate
      5. 7.8.5. Larimar Therapeutics Inc. Market Share
      6. 7.8.6. Recent Initiatives, Funding/VC Activities, and Technological Innovations
      7. 7.9. H. Lundbeck A/S
      8. 7.9.1. Company Overview
      9. 7.9.2. Product/ServicePortfolio
        1. 7.9.3. H. Lundbeck A/S Sales, Revenue, and Gross Margin
        2. 7.9.4. H. Lundbeck A/S Revenue and Growth Rate
        3. 7.9.5. H. Lundbeck A/S Market Share
      10. 7.9.6. Recent Initiatives, Funding/VC Activities, and Technological Innovations
    9. 7.10. Sanofi
      1. 7.10.1. Company Overview
      2. 7.10.2. Product/ServicePortfolio
      3. 7.10.3. Sanofi Sales, Revenue, and Gross Margin
      4. 7.10.4. Sanofi Revenue and Growth Rate
      5. 7.10.5. Sanofi Market Share
      6. 7.10.6. Recent Initiatives, Funding/VC Activities, and Technological Innovations
    10. 7.11. bluebird bio Inc.
      1. 7.11.1. Company Overview
      2. 7.11.2. Product/ServicePortfolio
      3. 7.11.3. bluebird bio Inc. Sales, Revenue, and Gross Margin
      4. 7.11.4. bluebird bio Inc. Revenue and Growth Rate
      5. 7.11.5. bluebird bio Inc. Market Share
      6. 7.11.6. Recent Initiatives, Funding/VC Activities, and Technological Innovations
    11. 7.12. Merck & Co. Inc.
      1. 7.12.1. Company Overview
      2. 7.12.2. Product/ServicePortfolio
      3. 7.12.3. Merck & Co. Inc. Sales, Revenue, and Gross Margin
      4. 7.12.4. Merck & Co. Inc. Revenue and Growth Rate
      5. 7.12.5. Merck & Co. Inc. Market Share
      6. 7.12.6. Recent Initiatives, Funding/VC Activities, and Technological Innovations
    12. 7.13. Editas Medicine
      1. 7.13.1. Company Overview
      2. 7.13.2. Product/ServicePortfolio
      3. 7.13.3. Editas Medicine Sales, Revenue, and Gross Margin
      4. 7.13.4. Editas Medicine Revenue and Growth Rate
      5. 7.13.5. Editas Medicine Market Share
      6. 7.13.6. Recent Initiatives, Funding/VC Activities, and Technological Innovations
    13. 7.14. Cellectis SA
      1. 7.14.1. Company Overview
      2. 7.14.2. Product/ServicePortfolio
      3. 7.14.3. Cellectis SA Sales, Revenue, and Gross Margin
      4. 7.14.4. Cellectis SA Revenue and Growth Rate
      5. 7.14.5. Cellectis SA Market Share
      6. 7.14.6. Recent Initiatives, Funding/VC Activities, and Technological Innovations
    14. 7.15. Healx
      1. 7.15.1. Company Overview
      2. 7.15.2. Product/ServicePortfolio
      3. 7.15.3. Healx Sales, Revenue, and Gross Margin
      4. 7.15.4. Healx Revenue and Growth Rate
      5. 7.15.5. Healx Market Share
      6. 7.15.6. Recent Initiatives, Funding/VC Activities, and Technological Innovations
    15. 7.16. Allergan
      1. 7.16.1. Company Overview
      2. 7.16.2. Product/ServicePortfolio
      3. 7.16.3. Allergan Sales, Revenue, and Gross Margin
      4. 7.16.4. Allergan Revenue and Growth Rate
      5. 7.16.5. Allergan Market Share
      6. 7.16.6. Recent Initiatives, Funding/VC Activities, and Technological Innovations
    16. 7.17. Intellia Therapeutics Inc.
      1. 7.17.1. Company Overview
      2. 7.17.2. Product/ServicePortfolio
      3. 7.17.3. Intellia Therapeutics Inc. Sales, Revenue, and Gross Margin
      4. 7.17.4. Intellia Therapeutics Inc. Revenue and Growth Rate
      5. 7.17.5. Intellia Therapeutics Inc. Market Share
      6. 7.17.6. Recent Initiatives, Funding/VC Activities, and Technological Innovations
  8. Chapter 8 Ataxia — Industry Analysis
    1. 8.1. Introduction and Taxonomy
    2. 8.2. Ataxia Market – Key Trends
      1. 8.2.1. Market Drivers
      2. 8.2.2. Market Restraints
      3. 8.2.3. Market Opportunities
    3. 8.3. Value Chain Analysis
    4. 8.4. Key Mandates and Regulations
    5. 8.5. Technology Roadmap and Timeline
    6. 8.6. Ataxia Market – Attractiveness Analysis
      1. 8.6.1. By Disease Type
      2. 8.6.2. By Treatment Type
      3. 8.6.3. By Distribution Channel
      4. 8.6.4. By Region
  9. Chapter 9 Industrial Chain, Sourcing Strategy, and Downstream Buyers
    1. 9.1. Ataxia Industrial Chain Analysis
    2. 9.2. Downstream Buyers
    3. 9.3. Distributors/Traders List
  10. Chapter 10 Marketing Strategy Analysis
    1. 10.1. Marketing Channel
    2. 10.2. Direct Marketing
    3. 10.3. Indirect Marketing
    4. 10.4. Marketing Channel Development Trends
    5. 10.5. Economic/Political Environmental Change
  11. Chapter 11 Report Conclusion& Key Insights
    1. 11.1. Key Insights from Primary Interviews & Surveys Respondents
    2. 11.2. Key Takeaways from Analysts, Consultants, and Industry Leaders
  12. Chapter 12 Research Approach & Methodology
    1. 12.1. Report Description
    2. 12.2. Research Scope
    3. 12.3. Research Methodology
      1. 12.3.1. Secondary Research
      2. 12.3.2. Primary Research
      3. 12.3.3. Statistical Models
        1. 12.3.3.1. Company Share Analysis Model
        2. 12.3.3.2. Revenue Based Modeling
      4. 12.3.4. Research Limitations

      List of Figures

      Fig.1	Product Picture of  Ataxia
      Fig.2	Global  Ataxia  Market, 2016 – 2026(USD Million)
      Fig.3	Global  Ataxia  MarketAbsolute Revenue Opportunity, 2016 – 2026(USD Million)
      Fig.4	Global  Ataxia  MarketIncremental Revenue Opportunity, 2020 – 2026(USD Million)
      Fig.5	Global  Ataxia  Market Share, by Disease Type, 2019 & 2026(USD Million)
      Fig.6	Global Idiopathic Ataxia  Market, 2016 – 2026(USD Million)
      Fig.7	Global Acquired Ataxia Ataxia  Market, 2016 – 2026(USD Million)
      Fig.8	Global Genetic Ataxia Ataxia  Market, 2016 – 2026(USD Million)
      Fig.9	Global  Ataxia  Market Share, by Treatment Type, 2019 & 2026(USD Million)
      Fig.10	Global Speech Therapy Ataxia  Market, 2016 – 2026(USD Million)
      Fig.11	Global Physical Therapy Ataxia  Market, 2016 – 2026(USD Million)
      Fig.12	Global Pharmacotherapy Ataxia  Market, 2016 – 2026(USD Million)
      Fig.13	Global Others Ataxia  Market, 2016 – 2026(USD Million)
      Fig.14	Global  Ataxia  Market Share, by Distribution Channel, 2019 & 2026(USD Million)
      Fig.15	Global Hospital Pharmacies Ataxia  Market, 2016 – 2026(USD Million)
      Fig.16	Global Online Pharmacies Ataxia  Market, 2016 – 2026(USD Million)
      Fig.17	Global Retail Pharmacies Ataxia  Market, 2016 – 2026(USD Million)
      Fig.18	Global  Ataxia  MarketShare, by Region, 2019 & 2026(USD Million)
      Fig.19	North America Ataxia  Market, 2016 – 2026(USD Million)
      Fig.20	U.S. Ataxia  Market, 2016 – 2026(USD Million)
      Fig.21	Canada Ataxia  Market, 2016 – 2026(USD Million)
      Fig.22	Europe Ataxia  Market, 2016 – 2026(USD Million)
      Fig.23	Germany Ataxia  Market, 2016 – 2026(USD Million)
      Fig.24	France Ataxia  Market, 2016 – 2026(USD Million)
      Fig.25	U.K. Ataxia  Market, 2016 – 2026(USD Million)
      Fig.26	Italy Ataxia  Market, 2016 – 2026(USD Million)
      Fig.27	Spain Ataxia  Market, 2016 – 2026(USD Million)
      Fig.28	Rest of Europe Ataxia  Market, 2016 – 2026(USD Million)
      Fig.29	Asia Pacific Ataxia  Market, 2016 – 2026(USD Million)
      Fig.30	China Ataxia  Market, 2016 – 2026(USD Million)
      Fig.31	Japan Ataxia  Market, 2016 – 2026(USD Million)
      Fig.32	India Ataxia  Market, 2016 – 2026(USD Million)
      Fig.33	South  Korea Ataxia  Market, 2016 – 2026(USD Million)
      Fig.34	South-East Asia Ataxia  Market, 2016 – 2026(USD Million)
      Fig.35	Rest of Asia Pacific Ataxia  Market, 2016 – 2026(USD Million)
      Fig.36	Latin America Ataxia  Market, 2016 – 2026(USD Million)
      Fig.37	Brazil Ataxia  Market, 2016 – 2026(USD Million)
      Fig.38	Mexico Ataxia  Market, 2016 – 2026(USD Million)
      Fig.39	Rest of Latin America Ataxia  Market, 2016 – 2026(USD Million)
      Fig.40	The Middle-East and Africa Ataxia  Market, 2016 – 2026(USD Million)
      Fig.41	GCC Countries Ataxia  Market, 2016 – 2026(USD Million)
      Fig.42	South Africa Ataxia  Market, 2016 – 2026(USD Million)
      Fig.43	Rest of Middle-East Africa Ataxia  Market, 2016 – 2026(USD Million)
      Fig.44	Competitor Market Share – Revenue
      Fig.45	CRISPR Therapeutics Revenue and Growth Rate
      Fig.46	CRISPR Therapeutics Market Share
      Fig.47	GlaxoSmithKline plc Revenue and Growth Rate
      Fig.48	GlaxoSmithKline plc Market Share
      Fig.49	Capsida Biotherapeutics Inc. Revenue and Growth Rate
      Fig.50	Capsida Biotherapeutics Inc. Market Share
      Fig.51	Pfizer Inc. Revenue and Growth Rate
      Fig.52	Pfizer Inc. Market Share
      Fig.53	Bio-Techne Revenue and Growth Rate
      Fig.54	Bio-Techne Market Share
      Fig.55	Acorda Therapeutics Revenue and Growth Rate
      Fig.56	Acorda Therapeutics Market Share
      Fig.57	Cellectis SA Revenue and Growth Rate
      Fig.58	Cellectis SA Market Share
      Fig.59	Larimar Therapeutics Inc. Revenue and Growth Rate
      Fig.60	Larimar Therapeutics Inc. Market Share
      Fig.61	H. Lundbeck A/S Revenue and Growth Rate
      Fig.62	H. Lundbeck A/S Market Share
      Fig.63	Sanofi Revenue and Growth Rate
      Fig.64	Sanofi Market Share
      Fig.65	bluebird bio Inc. Revenue and Growth Rate
      Fig.66	bluebird bio Inc. Market Share
      Fig.67	Merck & Co. Inc. Revenue and Growth Rate
      Fig.68	Merck & Co. Inc. Market Share
      Fig.69	Editas Medicine Revenue and Growth Rate
      Fig.70	Editas Medicine Market Share
      Fig.71	Cellectis SA Revenue and Growth Rate
      Fig.72	Cellectis SA Market Share
      Fig.73	Healx Revenue and Growth Rate
      Fig.74	Healx Market Share
      Fig.75	Allergan Revenue and Growth Rate
      Fig.76	Allergan Market Share
      Fig.77	Intellia Therapeutics Inc. Revenue and Growth Rate
      Fig.78	Intellia Therapeutics Inc. Market Share
      Fig.79	Market Dynamics
      Fig.80	Global  Ataxia  – Value Chain Analysis
      Fig.81	Key Mandates and Regulations
      Fig.82	Technology Roadmap and Timeline
      Fig.83	Market Attractiveness Analysis – By Disease Type
      Fig.84	Market Attractiveness Analysis – By Treatment Type
      Fig.85	Market Attractiveness Analysis – By Distribution Channel
      Fig.86	Market Attractiveness Analysis – By Region
      Fig.87	Ataxia  Industrial Chain Analysis
      Fig.88	Market Channels
      Fig.89	Marketing Channel Development Trend
      Fig.90	Growth in World Gross Product, 2008-2018
      

      List of Tables

      Table 1	Global  Ataxia Market, 2019 & 2026(USD Million)
      Table 2	Global  Ataxia Market, by Disease Type, 2016 – 2026(USD Million)
      Table 3	Global  Ataxia Market, by Treatment Type, 2016 – 2026(USD Million)
      Table 4	Global  Ataxia Market, by Distribution Channel, 2016 – 2026(USD Million)
      Table 5	Global  Ataxia Market, by Region, 2016 – 2026(USD Million)
      Table 6	North America Ataxia  Market, by Country, 2016 – 2026(USD Million)
      Table 7	North America Ataxia  Market, by Disease Type, 2016 – 2026(USD Million)
      Table 8	North America Ataxia  Market, by Treatment Type, 2016 – 2026(USD Million)
      Table 9	North America Ataxia  Market, by Distribution Channel, 2016 – 2026(USD Million)
      Table 10 Europe Ataxia  Market, by Country, 2016 – 2026(USD Million)
      Table 11 Europe Ataxia  Market, by Disease Type, 2016 – 2026(USD Million)
      Table 12 Europe Ataxia  Market, by Treatment Type, 2016 – 2026(USD Million)
      Table 13 Europe Ataxia  Market, by Distribution Channel, 2016 – 2026(USD Million)
      Table 14 Asia Pacific Ataxia  Market, by Country, 2016 – 2026(USD Million)
      Table 15 Asia Pacific Ataxia  Market, by Disease Type, 2016 – 2026(USD Million)
      Table 16 Asia Pacific Ataxia  Market, by Treatment Type, 2016 – 2026(USD Million)
      Table 17 Asia Pacific Ataxia  Market, by Distribution Channel, 2016 – 2026(USD Million)
      Table 18 Latin America Ataxia  Market, by Country, 2016 – 2026(USD Million)
      Table 19 Latin America Ataxia  Market, by Disease Type, 2016 – 2026(USD Million)
      Table 20 Latin America Ataxia  Market, by Treatment Type, 2016 – 2026(USD Million)
      Table 21 Latin America Ataxia  Market, by Distribution Channel, 2016 – 2026(USD Million)
      Table 22 The Middle-East and Africa Ataxia  Market, by Country, 2016 – 2026(USD Million)
      Table 23 The Middle-East and Africa Ataxia  Market, by Disease Type, 2016 – 2026(USD Million)
      Table 24 The Middle-East and Africa Ataxia  Market, by Treatment Type, 2016 – 2026(USD Million)
      Table 25 The Middle-East and Africa Ataxia  Market, by Distribution Channel, 2016 – 2026(USD Million)
      Table 26 Global  Ataxia  Market - Company Revenue Analysis, 2016 – 2019(USD Million)
      Table 27 Global  Ataxia  Market - Company Revenue Share Analysis, 2016 – 2019(%)
      Table 28 Acquisitions and Mergers
      Table 29 Market Drivers – Impact Analysis
      Table 30 Market Restraints
      Table 31 Market Opportunities
      Table 32 Major Buyers of  Ataxia
      Table 33 Distributors/Traders of  Ataxia  by Region
      

Industry Major Market Players

  • CRISPR Therapeutics
  • GlaxoSmithKline plc
  • Capsida Biotherapeutics Inc.
  • Pfizer Inc.
  • Bio-Techne
  • Acorda Therapeutics
  • Cellectis SA
  • Larimar Therapeutics Inc.
  • H. Lundbeck A/S
  • Sanofi
  • bluebird bio Inc.
  • Merck & Co. Inc.
  • Editas Medicine
  • Cellectis SA
  • Healx
  • Allergan
  • Intellia Therapeutics Inc.