Search Market Research Report

Discover Our Latest Reports
Discover Our Featured Reports
Discover Top Selling Reports

Asset Leasing Software Market Size, Share Global Analysis Report, 2021 – 2026

report img

Asset Leasing Software Market By Deployment (Cloud-Based and Web Based), and By Organization Size (Large Enterprises and SMEs): Global and Regional Industry Perspective, Comprehensive Analysis, Historical Trends, and Forecast 2021 – 2026

Industry Insights

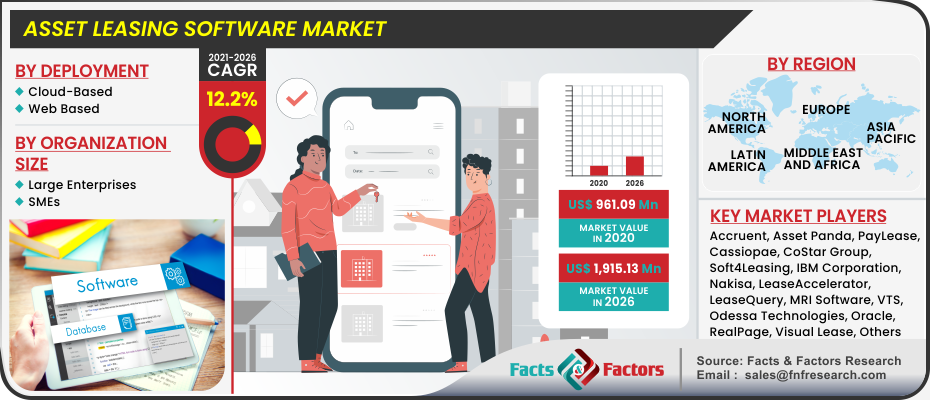
[179+ Pages Report] According to the Facts and Factors market research study, the global asset leasing software market in 2020 produced sales revenue of USD 961.09 Million. The asset leasing software market is anticipated to produce USD 1,915.13 Million in revenue by the end of 2026, growing at a CAGR of about 12.2% from 2021 to 2026.

logoMarket Overview

A leased asset is one that has been leased by the owner to another party in exchange for money or a favor. When leasing an asset, the owner enters into a contract that allows the other party to use the asset for a limited time. Asset leasing software supervises the work of the leasing lifecycle. Leasing software is used to keep track of asset leasing activities, paperwork and contracts, pricing, billing, and collections. Asset leasing software is mostly used by asset managers and financial experts, but its reporting capabilities are crucial for executives making decisions about their company's asset portfolio. Asset leasing software can be supplied as a stand-alone solution or as part of a larger bundle of goods. These software solutions will be connected with the CMMS and enterprise asset management software used by the companies, as well as accounting and ERP systems.

logoIndustry Growth Factor

Large and small asset leasing firms, as well as funder and brokerage leasing organizations, offer financial packages for a wide range of asset kinds, including vehicles, technology, agricultural machinery, construction and industrial equipment, and other vertical market asset types. Asset leasing software can handle all of the tasks that fall under the lease lifecycle management category. It also manages portfolios of various assets, such as equipment or automobiles, and provides credit evaluation and approval workflow.  According to the International Construction Market Survey, the global construction sector increased at a rate of almost 3.5 percent in 2017 and nearly 3.9 percent in 2018. According to a survey conducted by Foreign Direct Investment (FDI), India's Department of Industrial Policy and Promotion (DIPP) totaled USD 24.91 billion in the Construction Development industry from April 2000 to December 2018. Thereby, certain factors increase the need for asset leasing software all around the world.

Asset Leasing Software Market

To know more about this report | Request Free Sample Copy

logoGlobal Asset Leasing Software Market: Segmentation

Based on deployment, the market is bifurcated into cloud-based and web-based. Based on organization size, the market is bifurcated into large enterprises and SMEs. Among which the cloud-based segment and the SME’s commanded the largest size in the asset leasing software market in 2020, and it is expected to grow at the fastest CAGR during the forecast period.

logoGlobal Asset Leasing Software Market: Regional Analysis

Based on regions, the global asset leasing software market can be divided into five main regions namely, North America, Europe, Latin America, Asia Pacific, and The Middle East and Africa.

North America dominates the asset leasing software market in terms of market share, across the world, owing to the growth in the manufacturing sector, rebuilding America's aging infrastructure, and the prevalence of a significant number of market players in the region. On the other hand, Asia Pacific is expected to generate the highest growth rate throughout the forecast period. The region comprises of some of the major growing economies across the world like China, Japan, India, and South Korea. The high CAGR growth will be due to the rapid industrialization & infrastructure development in the growing economies of the region.

logoReport Scope

Report Attribute

Details

Market Size in 2020

USD 961.09 Million

Projected Market Size in 2026

USD 1,915.13 Million

CAGR Growth Rate

12.2% CAGR

Base Year 2020

Forecast Years

2021-2026

Key Market Players

Accruent, Asset Panda, Cassiopae, CoStar Group, Soft4Leasing, IBM Corporation, Nakisa, LeaseAccelerator, LeaseQuery, Odessa Technologies, MRI Software, Oracle, RealPage, Visual Lease, VTS, IDS Group Companies (White Clarke Group), and PayLease, among others.

Key Segment

By Deployment, By Organization Size, By Region

Major Regions Covered

North America, Europe, Asia Pacific, Latin America, and the Middle East & Africa

Purchase Options

Request customized purchase options to meet your research needs. Explore purchase options

logoGlobal Asset Leasing Software Market: Competitive Players

Some of the key players in the asset leasing software market are :

  • Accruent
  • Asset Panda
  • Cassiopae
  • CoStar Group
  • Soft4Leasing
  • IBM Corporation
  • Nakisa
  • LeaseAccelerator
  • LeaseQuery
  • Odessa Technologies
  • MRI Software
  • Oracle
  • RealPage
  • Visual Lease
  • VTS
  • IDS Group Companies (White Clarke Group)
  • PayLease
  • among others

logoBy Deployment

  • Cloud-Based
  • Web Based

logoBy Organization Size

  • Large Enterprises
  • SMEs

logoBy Regional Segment Analysis

  • North America
    • The U.S.
    • Canada
  • Europe
    • The UK
    • France
    • Germany
    • Italy
    • Spain
    • Rest of Europe
  • Asia Pacific
    • China
    • Japan
    • India
    • South Korea
    • Southeast Asia
    • Rest of Asia Pacific
  • Latin America
    • Brazil
    • Mexico
    • Rest of Latin America
  • Middle East & Africa
    • GCC Countries
    • South Africa
    • Rest of the Middle East & Africa

Table of Content

  1. Chapter 1 Executive Summary
    1. 1.1. Introduction of Asset Leasing Software
    2. 1.2. Global Asset Leasing Software Market, 2020 & 2026 (USD Million)
    3. 1.3. Global Asset Leasing Software Market, 2016 – 2026 (USD Million)
    4. 1.4. Global Asset Leasing Software Market Absolute Revenue Opportunity, 2016 – 2026 (USD Million)
    5. 1.5. Global Asset Leasing Software Market Incremental Revenue Opportunity, 2020 – 2026 (USD Million)
    6. 1.6. COVID-19 Impacts on Asset Leasing Software Market
      1. 1.6.1. COVID-19 Impact on the Player
      2. 1.6.2. Business Strategies and Recommendations
  2. Chapter 2 Asset Leasing Software Market – Deployment Analysis
    1. 2.1. Global Asset Leasing Software Market – Deployment Overview
    2. 2.2. Global Asset Leasing Software Market Share, by Deployment, 2020 & 2026 (USD Million)
    3. 2.3. Cloud-Based
      1. 2.3.1. Global Cloud-Based Asset Leasing Software Market, 2016 – 2026 (USD Million)
    4. 2.4. Web Based
      1. 2.4.1. Global Web Based Asset Leasing Software Market, 2016 – 2026 (USD Million)
  3. Chapter 3 Asset Leasing Software Market – Organization Size Analysis
    1. 3.1. Global Asset Leasing Software Market – Organization Size Overview
    2. 3.2. Global Asset Leasing Software Market Share, by Organization Size, 2020 & 2026 (USD Million)
    3. 3.3. Large Enterprises
      1. 3.3.1. Global Large Enterprises Asset Leasing Software Market, 2016 – 2026 (USD Million)
    4. 3.4. SMEs
      1. 3.4.1. Global SMEs Asset Leasing Software Market, 2016 – 2026 (USD Million)
  4. Chapter 4 Asset Leasing Software Market – Regional Analysis
    1. 4.1. Global Asset Leasing Software Market Regional Overview
    2. 4.2. Global Asset Leasing Software Market Share, by Region, 2020 & 2026 (USD Million)
    3. 4.3. North America
      1. 4.3.1. North America Asset Leasing Software Market, 2016 – 2026 (USD Million)
        1. 4.3.1.1. North America Asset Leasing Software Market, by Country, 2016 - 2026 (USD Million)
      2. 4.3.2. North America Asset Leasing Software Market, by Deployment, 2016 – 2026
        1. 4.3.2.1. North America Asset Leasing Software Market, by Deployment, 2016 – 2026 (USD Million)
      3. 4.3.3. North America Asset Leasing Software Market, by Organization Size, 2016 – 2026
        1. 4.3.3.1. North America Asset Leasing Software Market, by Organization Size, 2016 – 2026 (USD Million)
      4. 4.3.4. U.S.
        1. 4.3.4.1. U.S. Asset Leasing Software Market, 2016 – 2026 (USD Million)
      5. 4.3.5. Canada
        1. 4.3.5.1. Canada Asset Leasing Software Market, 2016 – 2026 (USD Million)
    4. 4.4. Europe
      1. 4.4.1. Europe Asset Leasing Software Market, 2016 – 2026 (USD Million)
        1. 4.4.1.1. Europe Asset Leasing Software Market, by Country, 2016 - 2026 (USD Million)
      2. 4.4.2. Europe Asset Leasing Software Market, by Deployment, 2016 – 2026
        1. 4.4.2.1. Europe Asset Leasing Software Market, by Deployment, 2016 – 2026 (USD Million)
      3. 4.4.3. Europe Asset Leasing Software Market, by Organization Size, 2016 – 2026
        1. 4.4.3.1. Europe Asset Leasing Software Market, by Organization Size, 2016 – 2026 (USD Million)
      4. 4.4.4. Germany
        1. 4.4.4.1. Germany Asset Leasing Software Market, 2016 – 2026 (USD Million)
      5. 4.4.5. France
        1. 4.4.5.1. France Asset Leasing Software Market, 2016 – 2026 (USD Million)
      6. 4.4.6. U.K.
        1. 4.4.6.1. U.K. Asset Leasing Software Market, 2016 – 2026 (USD Million)
      7. 4.4.7. Italy
        1. 4.4.7.1. Italy Asset Leasing Software Market, 2016 – 2026 (USD Million)
      8. 4.4.8. Spain
        1. 4.4.8.1. Spain Asset Leasing Software Market, 2016 – 2026 (USD Million)
      9. 4.4.9. Rest of Europe
        1. 4.4.9.1. Rest of Europe Asset Leasing Software Market, 2016 – 2026 (USD Million)
    5. 4.5. Asia Pacific
      1. 4.5.1. Asia Pacific Asset Leasing Software Market, 2016 – 2026 (USD Million)
        1. 4.5.1.1. Asia Pacific Asset Leasing Software Market, by Country, 2016 - 2026 (USD Million)
      2. 4.5.2. Asia Pacific Asset Leasing Software Market, by Deployment, 2016 – 2026
        1. 4.5.2.1. Asia Pacific Asset Leasing Software Market, by Deployment, 2016 – 2026 (USD Million)
      3. 4.5.3. Asia Pacific Asset Leasing Software Market, by Organization Size, 2016 – 2026
        1. 4.5.3.1. Asia Pacific Asset Leasing Software Market, by Organization Size, 2016 – 2026 (USD Million)
      4. 4.5.4. China
        1. 4.5.4.1. China Asset Leasing Software Market, 2016 – 2026 (USD Million)
      5. 4.5.5. Japan
        1. 4.5.5.1. Japan Asset Leasing Software Market, 2016 – 2026 (USD Million)
      6. 4.5.6. India
        1. 4.5.6.1. India Asset Leasing Software Market, 2016 – 2026 (USD Million)
      7. 4.5.7. South Korea
        1. 4.5.7.1. South Korea Asset Leasing Software Market, 2016 – 2026 (USD Million)
      8. 4.5.8. South-East Asia
        1. 4.5.8.1. South-East Asia Asset Leasing Software Market, 2016 – 2026 (USD Million)
      9. 4.5.9. Rest of Asia Pacific
        1. 4.5.9.1. Rest of Asia Pacific Asset Leasing Software Market, 2016 – 2026 (USD Million)
    6. 4.6. Latin America
      1. 4.6.1. Latin America Asset Leasing Software Market, 2016 – 2026 (USD Million)
        1. 4.6.1.1. Latin America Asset Leasing Software Market, by Country, 2016 - 2026 (USD Million)
      2. 4.6.2. Latin America Asset Leasing Software Market, by Deployment, 2016 – 2026
        1. 4.6.2.1. Latin America Asset Leasing Software Market, by Deployment, 2016 – 2026 (USD Million)
      3. 4.6.3. Latin America Asset Leasing Software Market, by Organization Size, 2016 – 2026
        1. 4.6.3.1. Latin America Asset Leasing Software Market, by Organization Size, 2016 – 2026 (USD Million)
      4. 4.6.4. Brazil
        1. 4.6.4.1. Brazil Asset Leasing Software Market, 2016 – 2026 (USD Million)
      5. 4.6.5. Mexico
        1. 4.6.5.1. Mexico Asset Leasing Software Market, 2016 – 2026 (USD Million)
      6. 4.6.6. Rest of Latin America
        1. 4.6.6.1. Rest of Latin America Asset Leasing Software Market, 2016 – 2026 (USD Million)
    7. 4.7. The Middle-East and Africa
      1. 4.7.1. The Middle-East and Africa Asset Leasing Software Market, 2016 – 2026 (USD Million)
        1. 4.7.1.1. The Middle-East and Africa Asset Leasing Software Market, by Country, 2016 - 2026 (USD Million)
      2. 4.7.2. The Middle-East and Africa Asset Leasing Software Market, by Deployment, 2016 – 2026
        1. 4.7.2.1. The Middle-East and Africa Asset Leasing Software Market, by Deployment, 2016 – 2026 (USD Million)
      3. 4.7.3. The Middle-East and Africa Asset Leasing Software Market, by Organization Size, 2016 – 2026
        1. 4.7.3.1. The Middle-East and Africa Asset Leasing Software Market, by Organization Size, 2016 – 2026 (USD Million)
      4. 4.7.4. GCC Countries
        1. 4.7.4.1. GCC Countries Asset Leasing Software Market, 2016 – 2026 (USD Million)
      5. 4.7.5. South Africa
        1. 4.7.5.1. South Africa Asset Leasing Software Market, 2016 – 2026 (USD Million)
      6. 4.7.6. Rest of Middle-East Africa
        1. 4.7.6.1. Rest of Middle-East Africa Asset Leasing Software Market, 2016 – 2026 (USD Million)
  5. Chapter 5 Asset Leasing Software Market – Competitive Landscape
    1. 5.1. Competitor Market Share – Revenue
    2. 5.2. Market Concentration Rate Analysis, Top 3 and Top 5 Players
    3. 5.3. Strategic Developments
      1. 5.3.1. Acquisitions and Mergers
      2. 5.3.2. New Products
      3. 5.3.3. Research & Development Activities
  6. Chapter 6 Company Profiles
    1. 6.1. Accruent
      1. 6.1.1. Company Overview
      2. 6.1.2. Product/Service Portfolio
      3. 6.1.3. Accruent Sales, Revenue, and Gross Margin
      4. 6.1.4. Accruent Revenue and Growth Rate
      5. 6.1.5. Accruent Market Share
      6. 6.1.6. Recent Initiatives, Funding/VC Activities, and Technological Innovations
    2. 6.2. Asset Panda
      1. 6.2.1. Company Overview
      2. 6.2.2. Product/Service Portfolio
      3. 6.2.3. Asset Panda Sales, Revenue, and Gross Margin
      4. 6.2.4. Asset Panda Revenue and Growth Rate
      5. 6.2.5. Asset Panda Market Share
      6. 6.2.6. Recent Initiatives, Funding/VC Activities, and Technological Innovations
    3. 6.3. Cassiopae
      1. 6.3.1. Company Overview
      2. 6.3.2. Product/Service Portfolio
      3. 6.3.3. Cassiopae Sales, Revenue, and Gross Margin
      4. 6.3.4. Cassiopae Revenue and Growth Rate
      5. 6.3.5. Cassiopae Market Share
      6. 6.3.6. Recent Initiatives, Funding/VC Activities, and Technological Innovations
    4. 6.4. CoStar Group
      1. 6.4.1. Company Overview
      2. 6.4.2. Product/Service Portfolio
      3. 6.4.3. CoStar Group Sales, Revenue, and Gross Margin
      4. 6.4.4. CoStar Group Revenue and Growth Rate
      5. 6.4.5. CoStar Group Market Share
      6. 6.4.6. Recent Initiatives, Funding/VC Activities, and Technological Innovations
    5. 6.5. Soft4Leasing
      1. 6.5.1. Company Overview
      2. 6.5.2. Product/Service Portfolio
      3. 6.5.3. Soft4Leasing Sales, Revenue, and Gross Margin
      4. 6.5.4. Soft4Leasing Revenue and Growth Rate
      5. 6.5.5. Soft4Leasing Market Share
      6. 6.5.6. Recent Initiatives, Funding/VC Activities, and Technological Innovations
    6. 6.6. IBM Corporation
      1. 6.6.1. Company Overview
      2. 6.6.2. Product/Service Portfolio
      3. 6.6.3. IBM Corporation Sales, Revenue, and Gross Margin
      4. 6.6.4. IBM Corporation Revenue and Growth Rate
      5. 6.6.5. IBM Corporation Market Share
      6. 6.6.6. Recent Initiatives, Funding/VC Activities, and Technological Innovations
    7. 6.7. PayLease
      1. 6.7.1. Company Overview
      2. 6.7.2. Product/Service Portfolio
      3. 6.7.3. PayLease Sales, Revenue, and Gross Margin
      4. 6.7.4. PayLease Revenue and Growth Rate
      5. 6.7.5. PayLease Market Share
      6. 6.7.6. Recent Initiatives, Funding/VC Activities, and Technological Innovations
    8. 6.8. LeaseAccelerator
      1. 6.8.1. Company Overview
      2. 6.8.2. Product/Service Portfolio
      3. 6.8.3. LeaseAccelerator Sales, Revenue, and Gross Margin
      4. 6.8.4. LeaseAccelerator Revenue and Growth Rate
      5. 6.8.5. LeaseAccelerator Market Share
      6. 6.8.6. Recent Initiatives, Funding/VC Activities, and Technological Innovations
    9. 6.9. LeaseQuery
      1. 6.9.1. Company Overview
      2. 6.9.2. Product/Service Portfolio
      3. 6.9.3. LeaseQuery Sales, Revenue, and Gross Margin
      4. 6.9.4. LeaseQuery Revenue and Growth Rate
      5. 6.9.5. LeaseQuery Market Share
      6. 6.9.6. Recent Initiatives, Funding/VC Activities, and Technological Innovations
    10. 6.10. Leasecake Inc.
      1. 6.10.1. Company Overview
      2. 6.10.2. Product/Service Portfolio
      3. 6.10.3. Leasecake Inc. Sales, Revenue, and Gross Margin
      4. 6.10.4. Leasecake Inc. Revenue and Growth Rate
      5. 6.10.5. Leasecake Inc. Market Share
      6. 6.10.6. Recent Initiatives, Funding/VC Activities, and Technological Innovations
    11. 6.11. MRI Software
      1. 6.11.1. Company Overview
      2. 6.11.2. Product/Service Portfolio
      3. 6.11.3. MRI Software Sales, Revenue, and Gross Margin
      4. 6.11.4. MRI Software Revenue and Growth Rate
      5. 6.11.5. MRI Software Market Share
      6. 6.11.6. Recent Initiatives, Funding/VC Activities, and Technological Innovations
    12. 6.12. Nakisa
      1. 6.12.1. Company Overview
      2. 6.12.2. Product/Service Portfolio
      3. 6.12.3. Nakisa Sales, Revenue, and Gross Margin
      4. 6.12.4. Nakisa Revenue and Growth Rate
      5. 6.12.5. Nakisa Market Share
      6. 6.12.6. Recent Initiatives, Funding/VC Activities, and Technological Innovations
    13. 6.13. Odessa Technologies
      1. 6.13.1. Company Overview
      2. 6.13.2. Product/Service Portfolio
      3. 6.13.3. Odessa Technologies Sales, Revenue, and Gross Margin
      4. 6.13.4. Odessa Technologies Revenue and Growth Rate
      5. 6.13.5. Odessa Technologies Market Share
      6. 6.13.6. Recent Initiatives, Funding/VC Activities, and Technological Innovations
    14. 6.14. Oracle
      1. 6.14.1. Company Overview
      2. 6.14.2. Product/Service Portfolio
      3. 6.14.3. Oracle Sales, Revenue, and Gross Margin
      4. 6.14.4. Oracle Revenue and Growth Rate
      5. 6.14.5. Oracle Market Share
      6. 6.14.6. Recent Initiatives, Funding/VC Activities, and Technological Innovations
    15. 6.15. Occupier
      1. 6.15.1. Company Overview
      2. 6.15.2. Product/Service Portfolio
      3. 6.15.3. Occupier Sales, Revenue, and Gross Margin
      4. 6.15.4. Occupier Revenue and Growth Rate
      5. 6.15.5. Occupier Market Share
      6. 6.15.6. Recent Initiatives, Funding/VC Activities, and Technological Innovations
    16. 6.16. RealPage
      1. 6.16.1. Company Overview
      2. 6.16.2. Product/Service Portfolio
      3. 6.16.3. RealPage Sales, Revenue, and Gross Margin
      4. 6.16.4. RealPage Revenue and Growth Rate
      5. 6.16.5. RealPage Market Share
      6. 6.16.6. Recent Initiatives, Funding/VC Activities, and Technological Innovations
    17. 6.17. Visual Lease
      1. 6.17.1. Company Overview
      2. 6.17.2. Product/Service Portfolio
      3. 6.17.3. Visual Lease Sales, Revenue, and Gross Margin
      4. 6.17.4. Visual Lease Revenue and Growth Rate
      5. 6.17.5. Visual Lease Market Share
      6. 6.17.6. Recent Initiatives, Funding/VC Activities, and Technological Innovations
    18. 6.18. VTS
      1. 6.18.1. Company Overview
      2. 6.18.2. Product/Service Portfolio
      3. 6.18.3. VTS Sales, Revenue, and Gross Margin
      4. 6.18.4. VTS Revenue and Growth Rate
      5. 6.18.5. VTS Market Share
      6. 6.18.6. Recent Initiatives, Funding/VC Activities, and Technological Innovations
    19. 6.19. IDS Group Companies (White Clarke Group)
      1. 6.19.1. Company Overview
      2. 6.19.2. Product/Service Portfolio
      3. 6.19.3. IDS Group Companies (White Clarke Group) Sales, Revenue, and Gross Margin
      4. 6.19.4. IDS Group Companies (White Clarke Group) Revenue and Growth Rate
      5. 6.19.5. IDS Group Companies (White Clarke Group) Market Share
      6. 6.19.6. Recent Initiatives, Funding/VC Activities, and Technological Innovations
  7. Chapter 7 Asset Leasing Software — Industry Analysis
    1. 7.1. Introduction and Taxonomy
    2. 7.2. Asset Leasing Software Market – Key Trends
      1. 7.2.1. Market Drivers
      2. 7.2.2. Market Restraints
      3. 7.2.3. Market Opportunities
    3. 7.3. Porter’s Five Forces Model
      1. 7.3.1. Bargaining Power of Buyers
      2. 7.3.2. Bargaining Power of Suppliers
      3. 7.3.3. Threat of Substitute
      4. 7.3.4. Threat of New Entrants
      5. 7.3.5. Rivalry among Existing Competitors
    4. 7.4. PESTEL Analysis
    5. 7.5. SWOT Analysis
    6. 7.6. Technology Roadmap and Timeline
    7. 7.7. Asset Leasing Software Market – Attractiveness Analysis
      1. 7.7.1. By Deployment
      2. 7.7.2. By Organization Size
      3. 7.7.3. By Region
  8. Chapter 8 Marketing Strategy Analysis
    1. 8.1. Marketing Channel
    2. 8.2. Direct Marketing
    3. 8.3. Indirect Marketing
    4. 8.4. Marketing Channel Development Trends
    5. 8.5. Economic/Political Environmental Change
  9. Chapter 9 Report Conclusion & Key Insights
    1. 9.1. Key Insights from Primary Interviews & Surveys Respondents
    2. 9.2. Key Takeaways from Analysts, Consultants, and Industry Leaders
  10. Chapter 10 Research Approach & Methodology
    1. 10.1. Report Description
    2. 10.2. Research Scope
    3. 10.3. Research Methodology
      1. 10.3.1. Secondary Research
      2. 10.3.2. Primary Research
      3. 10.3.3. Statistical Models
        1. 10.3.3.1. Company Share Analysis Model
        2. 10.3.3.2. Revenue Based Modeling
      4. 10.3.4. Research Limitations

      List of Figures

      Fig.1	Product Picture of Asset Leasing Software
      Fig.2	Global Asset Leasing Software Market, 2016 – 2026 (USD Million)
      Fig.3	Global Asset Leasing Software Market Absolute Revenue Opportunity, 2016 – 2026 (USD Million)
      Fig.4	Global Asset Leasing Software Market Incremental Revenue Opportunity, 2020 – 2026 (USD Million)
      Fig.5	Global Asset Leasing Software Market Share, by Deployment, 2019 & 2026 (USD Million)
      Fig.6	Global Cloud-Based Asset Leasing Software Market, 2016 – 2026 (USD Million)
      Fig.7	Global Web Based Asset Leasing Software Market, 2016 – 2026 (USD Million)
      Fig.8	Global Asset Leasing Software Market Share, by Organization Size, 2019 & 2026 (USD Million)
      Fig.9	Global Large Enterprises Asset Leasing Software Market, 2016 – 2026 (USD Million)
      Fig.10	Global SMEs Asset Leasing Software Market, 2016 – 2026 (USD Million)
      Fig.11	Global Asset Leasing Software Market Share, by Region, 2019 & 2026 (USD Million)
      Fig.12	North America Asset Leasing Software Market, 2016 – 2026 (USD Million)
      Fig.13	U.S. Asset Leasing Software Market, 2016 – 2026 (USD Million)
      Fig.14	Canada Asset Leasing Software Market, 2016 – 2026 (USD Million)
      Fig.15	Europe Asset Leasing Software Market, 2016 – 2026 (USD Million)
      Fig.16	Germany Asset Leasing Software Market, 2016 – 2026 (USD Million)
      Fig.17	France Asset Leasing Software Market, 2016 – 2026 (USD Million)
      Fig.18	U.K. Asset Leasing Software Market, 2016 – 2026 (USD Million)
      Fig.19	Italy Asset Leasing Software Market, 2016 – 2026 (USD Million)
      Fig.20	Spain Asset Leasing Software Market, 2016 – 2026 (USD Million)
      Fig.21	Rest of Europe Asset Leasing Software Market, 2016 – 2026 (USD Million)
      Fig.22	Asia Pacific Asset Leasing Software Market, 2016 – 2026 (USD Million)
      Fig.23	China Asset Leasing Software Market, 2016 – 2026 (USD Million)
      Fig.24	Japan Asset Leasing Software Market, 2016 – 2026 (USD Million)
      Fig.25	India Asset Leasing Software Market, 2016 – 2026 (USD Million)
      Fig.26	South  Korea Asset Leasing Software Market, 2016 – 2026 (USD Million)
      Fig.27	South-East Asia Asset Leasing Software Market, 2016 – 2026 (USD Million)
      Fig.28	Rest of Asia Pacific Asset Leasing Software Market, 2016 – 2026 (USD Million)
      Fig.29	Latin America Asset Leasing Software Market, 2016 – 2026 (USD Million)
      Fig.30	Brazil Asset Leasing Software Market, 2016 – 2026 (USD Million)
      Fig.31	Mexico Asset Leasing Software Market, 2016 – 2026 (USD Million)
      Fig.32	Rest of Latin America Asset Leasing Software Market, 2016 – 2026 (USD Million)
      Fig.33	The Middle-East and Africa Asset Leasing Software Market, 2016 – 2026 (USD Million)
      Fig.34	GCC Countries Asset Leasing Software Market, 2016 – 2026 (USD Million)
      Fig.35	South Africa Asset Leasing Software Market, 2016 – 2026 (USD Million)
      Fig.36	Rest of Middle-East Africa Asset Leasing Software Market, 2016 – 2026 (USD Million)
      Fig.37	Competitor Market Share – Revenue
      Fig.38	Accruent Revenue and Growth Rate
      Fig.39	Accruent Market Share
      Fig.40	Asset Panda Revenue and Growth Rate
      Fig.41	Asset Panda Market Share
      Fig.42	Cassiopae Revenue and Growth Rate
      Fig.43	Cassiopae Market Share
      Fig.44	CoStar Group Revenue and Growth Rate
      Fig.45	CoStar Group Market Share
      Fig.46	Soft4Leasing Revenue and Growth Rate
      Fig.47	Soft4Leasing Market Share
      Fig.48	IBM Corporation Revenue and Growth Rate
      Fig.49	IBM Corporation Market Share
      Fig.50	Nakisa Revenue and Growth Rate
      Fig.51	Nakisa Market Share
      Fig.52	LeaseAccelerator Revenue and Growth Rate
      Fig.53	LeaseAccelerator Market Share
      Fig.54	LeaseQuery Revenue and Growth Rate
      Fig.55	LeaseQuery Market Share
      Fig.56	Odessa Technologies Revenue and Growth Rate
      Fig.57	Odessa Technologies Market Share
      Fig.58	MRI Software Revenue and Growth Rate
      Fig.59	MRI Software Market Share
      Fig.60	Oracle Revenue and Growth Rate
      Fig.61	Oracle Market Share
      Fig.62	RealPage Revenue and Growth Rate
      Fig.63	RealPage Market Share
      Fig.64	Visual Lease Revenue and Growth Rate
      Fig.65	Visual Lease Market Share
      Fig.66	VTS Revenue and Growth Rate
      Fig.67	VTS Market Share
      Fig.68	PayLease Revenue and Growth Rate
      Fig.69	PayLease Market Share
      Fig.70	Market Dynamics
      Fig.71	Global Asset Leasing Software – Value Chain Analysis
      Fig.72	Key Mandates and Regulations
      Fig.73	Technology Roadmap and Timeline
      Fig.74	Market Attractiveness Analysis – By Deployment
      Fig.75	Market Attractiveness Analysis – By Organization Size
      Fig.76	Market Attractiveness Analysis – By Region
      Fig.77	Asset Leasing Software Industrial Chain Analysis
      Fig.78	Market Channels
      Fig.79	Marketing Channel Development Trend
      Fig.80	Growth in World Gross Product, 2008-2018
      

      List of Tables

      	
      Table 1	Global Asset Leasing Software Market, 2019 & 2026 (USD Million)
      Table 2	Global Asset Leasing Software Market, by Deployment, 2016 – 2026 (USD Million)
      Table 3	Global Asset Leasing Software Market, by Organization Size, 2016 – 2026 (USD Million)
      Table 4	Global Asset Leasing Software Market, by Region, 2016 – 2026 (USD Million)
      Table 5	North America Asset Leasing Software Market, by Country, 2016 – 2026 (USD Million)
      Table 6	North America Asset Leasing Software Market, by Deployment, 2016 – 2026 (USD Million)
      Table 7	North America Asset Leasing Software Market, by Organization Size, 2016 – 2026 (USD Million)
      Table 8	Europe Asset Leasing Software Market, by Country, 2016 – 2026 (USD Million)
      Table 9	Europe Asset Leasing Software Market, by Deployment, 2016 – 2026 (USD Million)
      Table 10 Europe Asset Leasing Software Market, by Organization Size, 2016 – 2026 (USD Million)
      Table 11 Asia Pacific Asset Leasing Software Market, by Country, 2016 – 2026 (USD Million)
      Table 12 Asia Pacific Asset Leasing Software Market, by Deployment, 2016 – 2026 (USD Million)
      Table 13 Asia Pacific Asset Leasing Software Market, by Organization Size, 2016 – 2026 (USD Million)
      Table 14 Latin America Asset Leasing Software Market, by Country, 2016 – 2026 (USD Million)
      Table 15 Latin America Asset Leasing Software Market, by Deployment, 2016 – 2026 (USD Million)
      Table 16 Latin America Asset Leasing Software Market, by Organization Size, 2016 – 2026 (USD Million)
      Table 17 The Middle-East and Africa Asset Leasing Software Market, by Country, 2016 – 2026 (USD Million)
      Table 18 The Middle-East and Africa Asset Leasing Software Market, by Deployment, 2016 – 2026 (USD Million)
      Table 19 The Middle-East and Africa Asset Leasing Software Market, by Organization Size, 2016 – 2026 (USD Million)
      Table 20 Global Asset Leasing Software Market - Company Revenue Analysis, 2016 – 2019 (USD Million)
      Table 21 Global Asset Leasing Software Market - Company Revenue Share Analysis, 2016 – 2019 (%)
      Table 22 Acquisitions and Mergers
      Table 23 Market Drivers – Impact Analysis
      Table 24 Market Restraints
      Table 25 Market Opportunities
      Table 26 Major Buyers of Asset Leasing Software
      Table 27 Distributors/Traders of Asset Leasing Software by Region
      

Industry Major Market Players

  • Accruent
  • Asset Panda
  • Cassiopae
  • CoStar Group
  • Soft4Leasing
  • IBM Corporation
  • Nakisa
  • LeaseAccelerator
  • LeaseQuery
  • Odessa Technologies
  • MRI Software
  • Oracle
  • RealPage
  • Visual Lease
  • VTS
  • IDS Group Companies (White Clarke Group)
  • PayLease