Search Market Research Report

Discover Our Latest Reports
Discover Our Featured Reports
Discover Top Selling Reports

Aspirin Market Size, Share Global Analysis Report, 2020–2026

report img

Aspirin Market By Application (Fever, Pain Relief, Inflammation, Antiplatelet, and Other): Global Industry Outlook, Market Size, Business Intelligence, Consumer Preferences, Statistical Surveys, Comprehensive Analysis, Historical Developments, Current Trends, and Forecast 2020–2026

Industry Insights

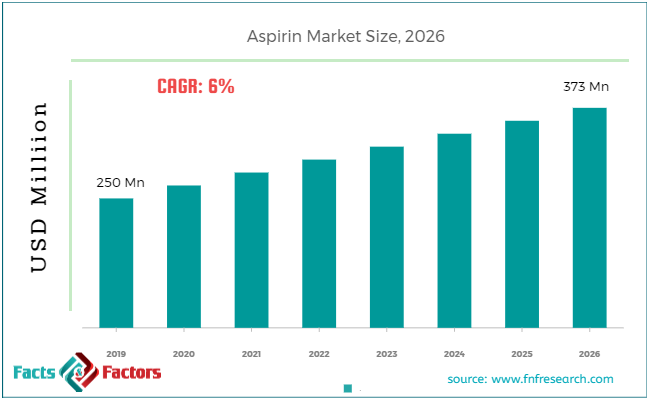
 According to the report published by Facts Factors, the global Aspirin market size was worth around USD 250 million in 2019 and is predicted to grow to around USD 373 million by 2026 with a compound annual growth rate (CAGR) of roughly 6% between 2020 and 2026. The report analyzes the global aspirin market drivers, restraints/challenges, and the effect they have on the demands during the projection period. In addition, the report explores emerging opportunities in the aspirin market.

The Aspirin market report analyzes and notifies the industry statistics at the global as well as regional and country levels in order to acquire a thorough perspective of the entire Aspirin market. The historical and past insights are provided for FY 2016 to FY 2019 whereas projected trends are delivered for FY 2020 to FY 2026. The quantitative and numerical data is represented in terms of both volume (Metric Ton) and value (USD Million) from FY 2016 – 2026.

Aspirin Market

To know more about this report | Request Free Sample Copy

This specialized and expertise-oriented industry research report scrutinizes the technical and commercial business outlook of the Aspirin industry. The report analyzes and declares the historical and current trends analysis of the aspirin industry and subsequently recommends the projected trends anticipated to be observed in the Aspirin market during the upcoming years.

logoKey Insights from Primary Research

  • According to the interview with industry participants, rising demand for aspirin to cure pain has been driving the target market growth
  • Target market generated revenue of around USD 250 Million in 2019
  • North America was the dominating region in 2018, generating revenue of around USD 82 Million
  • In terms of application segment, pain relief category was the leading revenue-generating category in 2018
  • Highly competitive pharmaceutical industries in developing as well as developed countries have contributed in the development of target market

logoKey Recommendations from Analysts

  • As per our analyst, aspirin is used in curing several diseases such as gout, rheumatic fever, and rheumatoid arthritis. This has propelled the target market growth
  • The target market is estimated to grow at a CAGR of around 6%
  • North America is expected to be the dominating region, generating revenue  of around USD 120 Million in 2026
  • Pain relief category of the application segment is anticipated to continue its dominance in 2026 as well
  • Target market is expected to generate revenue of around USD 373 Million in 2026

The quantitative data is further underlined and reinforced by comprehensive qualitative data which comprises various across-the-board market dynamics. The rationales which directly or indirectly impact the Aspirin industry are exemplified through parameters such as growth drivers, restraints, challenges, and opportunities among other impacting factors.

Throughout our research report, we have encompassed all the proven models and tools of industry analysis and extensively illustrated all the key business strategies and business models adopted in the Aspirin industry. The report provides an all-inclusive and detailed competitive landscape prevalent in the Aspirin market.

The report utilizes established industry analysis tools and models such as Porter’s Five Forces framework to analyze and recognize critical business strategies adopted by various stakeholders involved in the entire value chain of the Aspirin industry. The Aspirin market report additionally employs SWOT analysis and PESTLE analysis models for further in-depth analysis.

The report study further includes an in-depth analysis of industry players' market shares and provides an overview of leading players' market position in the Aspirin sector. Key strategic developments in the Aspirin market competitive landscape such as acquisitions & mergers, inaugurations of different products and services, partnerships & joint ventures, MoU agreements, VC & funding activities, R&D activities, and geographic expansion among other noteworthy activities by key players of the Aspirin market are appropriately highlighted in the report.

Rising investment in research and development by pharmaceutical companies, in developed as well as developing economies have surged the target market growth. In addition, the development of new products associated with the target market is augmenting the target market growth. However, few allergies and side effects of aspirins are expected to restrain the target market growth over the forecast period.

Online marketing and advertisement coupled with the distribution of aspirin are anticipated to create lucrative opportunities for the target market over the forecast period. Also, the digital marketing of aspirin drugs may boost the target market growth owing to the popularity of digital media nowadays.

logoReport Scope

Report Attribute

Details

Market Size in 2019

USD 250 Million

Projected Market Size in 2026

USD 373 Million

CAGR Growth Rate

6% CAGR

Base Year

2019

Forecast Years

2020-2026

Key Market Players

Novacyl, Bayer, Andhra Sugars, WuyiCihang, HuayinJinqiancheng, NanjingPharmaceutical, HunanZhongnan, Shandong Xinhua, HebeiJingye Group, Jilin Pharmaceutical, and others.

Key Segment

Analysis, Application, and Region

Major Regions Covered

North America, Europe, Asia Pacific, Latin America, and the Middle East &, Africa

Purchase Options

Request customized purchase options to meet your research needs. Explore purchase options

logoRegional Overview:

The Aspirin market research report delivers an acute valuation and taxonomy of the Aspirin industry by practically splitting the market on the basis of different applications, and regions. Through the analysis of the historical and projected trends, all the segments and sub-segments were evaluated through the bottom-up approach, and different market sizes have been projected for FY 2020 to FY 2026.

The regional segmentation of the Aspirin industry includes the complete classification of all the major continents including North America, Latin America, Europe, Asia Pacific, and Middle East & Africa. Further, country-wise data for the Aspirin industry is provided for the leading economies of the world.

The Aspirin market is segmented based on Application. In terms of Application segmentation, the market is bifurcated into a fever, pain relief, inflammation, antiplatelet, and others.

logoSome of the essential players operating in the Aspirin market include

  • Novacyl
  •  Bayer
  •  hra Sugars
  •  WuyiCihang
  •  HuayinJinqiancheng
  •  NanjingPharmaceutical
  •  HunanZhongnan
  • Shandong Xinhua
  • HebeiJingye Group
  • Jilin Pharmaceutical

The taxonomy of the Aspirin Market by its scope and segmentation is as follows:

logo By Application Segmentation Analysis (Customizable)

  • Fever
  • Pain Relief
  • Inflammation
  • Antiplatelet
  • Other

logo Regional Segmentation Analysis (Customizable)

  • North America
    • The U.S.
    • Canada
  • Europe
    • Germany
    • The UK
    • France
    • Spain
    • Italy
    • Rest of Europe
  • Asia Pacific
    • China
    • Japan
    • India
    • South Korea
    • Southeast Asia
    • Rest of Asia Pacific
  • Latin America
    • Brazil
    • Mexico
    • Rest of Latin America
  • Middle East & Africa
    • GCC
    • South Africa
    • Rest of Middle East & Africa

Table of Content

  1. CHAPTER 1. Executive Summary
  2. CHAPTER 2. Aspirin market – Application Analysis
    1. 2.1. Global Aspirin Market – Application Overview
    2. 2.2. Global Aspirin Market Share, by Application, 2018 & 2025 (USD Million)
    3. 2.3. Global Aspirin Market share, by Application, 2018 & 2025 (Metric Ton)
    4. 2.4. Fever
      1. 2.4.1. Global Fever Aspirin Market, 2016-2026 (USD Million)
      2. 2.4.2. Global Fever Aspirin Market, 2016-2026 (Metric Ton)
    5. 2.5. Pain Relief
      1. 2.5.1. Global Pain Relief Aspirin Market, 2016-2026 (USD Million)
      2. 2.5.2. Global Pain Relief Aspirin Market, 2016-2026 (Metric Ton)
    6. 2.6. Inflammation
      1. 2.6.1. Global Inflammation Aspirin Market, 2016-2026 (USD Million)
      2. 2.6.2. Global Inflammation Aspirin Market, 2016-2026 (Metric Ton)
    7. 2.7. Antiplatelet
      1. 2.7.1. Global Antiplatelet Aspirin Market, 2016-2026 (USD Million)
      2. 2.7.2. Global Antiplatelet Aspirin Market, 2016-2026 (Metric Ton)
    8. 2.8. Other
      1. 2.8.1. Global Other Aspirin Market, 2016-2026 (USD Million)
      2. 2.8.2. Global Other Aspirin Market, 2016-2026 (Metric Ton)
  3. CHAPTER 3. Aspirin market – Regional Analysis
    1. 3.1. Global Aspirin Market Regional Overview
    2. 3.2. Global Aspirin Market Share, by Region, 2018 & 2025 (Value)
    3. 3.3. Global Aspirin Market Share, by Region, 2018 & 2025 (Volume)
    4. 3.4. North America
      1. 3.4.1. North America Aspirin Market size and forecast, 2016-2026
      2. 3.4.2. North America Aspirin Market, by Country, 2018 - 2025 (USD Million)
      3. 3.4.3. North America Market size and forecast, 2016-2026 (Metric Ton)
      4. 3.4.4. North America Aspirin Market, by Country, 2018 - 2025 (Metric Ton)
      5. 3.4.5. North America Aspirin Market, by Application, 2016-2026
        1. 3.4.5.1. North America Aspirin Market, by Application, 2016-2026 (USD Million)
        2. 3.4.5.2. North America Aspirin Market, by Application, 2016-2026 (Metric Ton)
      6. 3.4.6. U.S.
        1. 3.4.6.1. U.S. Market size and forecast, 2016-2026 (USD Million)
        2. 3.4.6.2. U.S. Market size and forecast, 2016-2026 (Metric Ton)
      7. 3.4.7. Canada
        1. 3.4.7.1. Canada Market size and forecast, 2016-2026 (USD Million)
        2. 3.4.7.2. Canada Market size and forecast, 2016-2026 (Metric Ton)
    5. 3.5. Europe
      1. 3.5.1. Europe Aspirin Market size and forecast, 2016-2026
      2. 3.5.2. Europe Aspirin Market, by Country, 2018 - 2025 (USD Million)
      3. 3.5.3. Europe Market size and forecast, 2016-2026 (Metric Ton)
      4. 3.5.4. Europe Aspirin Market, by Country, 2018 - 2025 (Metric Ton)
      5. 3.5.5. Europe Aspirin Market, by Application, 2016-2026
        1. 3.5.5.1. Europe Aspirin Market, by Application, 2016-2026 (USD Million)
        2. 3.5.5.2. Europe Aspirin Market, by Application, 2016-2026 (Metric Ton)
      6. 3.5.6. Germany
        1. 3.5.6.1. Germany Market size and forecast, 2016-2026 (USD Million)
        2. 3.5.6.2. Germany Market size and forecast, 2016-2026 (Metric Ton)
      7. 3.5.7. France
        1. 3.5.7.1. France Market size and forecast, 2016-2026 (USD Million)
        2. 3.5.7.2. France Market size and forecast, 2016-2026 (Metric Ton)
      8. 3.5.8. U.K.
        1. 3.5.8.1. U.K. Market size and forecast, 2016-2026 (USD Million)
        2. 3.5.8.2. U.K. Market size and forecast, 2016-2026 (Metric Ton)
      9. 3.5.9. Italy
        1. 3.5.9.1. Italy Market size and forecast, 2016-2026 (USD Million)
        2. 3.5.9.2. Italy Market size and forecast, 2016-2026 (Metric Ton)
      10. 3.5.10. Spain
        1. 3.5.10.1. Spain Market size and forecast, 2016-2026 (USD Million)
        2. 3.5.10.2. Spain Market size and forecast, 2016-2026 (Metric Ton)
      11. 3.5.11. Rest of Europe
        1. 3.5.11.1. Rest of Europe Market size and forecast, 2016-2026 (USD Million)
        2. 3.5.11.2. Rest of Europe Market size and forecast, 2016-2026 (Metric Ton)
    6. 3.6. Asia Pacific
      1. 3.6.1. Asia Pacific Aspirin Market size and forecast, 2016-2026
      2. 3.6.2. Asia Pacific Aspirin Market, by Country, 2018 - 2025 (USD Million)
      3. 3.6.3. Asia Pacific Market size and forecast, 2016-2026 (Metric Ton)
      4. 3.6.4. Asia Pacific Aspirin Market, by Country, 2018 - 2025 (Metric Ton)
      5. 3.6.5. Asia Pacific Aspirin Market, by Application, 2016-2026
        1. 3.6.5.1. Asia Pacific Aspirin Market, by Application, 2016-2026 (USD Million)
        2. 3.6.5.2. Asia Pacific Aspirin Market, by Application, 2016-2026 (Metric Ton)
      6. 3.6.6. China
        1. 3.6.6.1. China Market size and forecast, 2016-2026 (USD Million)
        2. 3.6.6.2. China Market size and forecast, 2016-2026 (Metric Ton)
      7. 3.6.7. Japan
        1. 3.6.7.1. Japan Market size and forecast, 2016-2026 (USD Million)
        2. 3.6.7.2. Japan Market size and forecast, 2016-2026 (Metric Ton)
      8. 3.6.8. India
        1. 3.6.8.1. India Market size and forecast, 2016-2026 (USD Million)
        2. 3.6.8.2. India Market size and forecast, 2016-2026 (Metric Ton)
      9. 3.6.9. South Korea
        1. 3.6.9.1. South Korea Market size and forecast, 2016-2026 (USD Million)
        2. 3.6.9.2. South Korea Market size and forecast, 2016-2026 (Metric Ton)
      10. 3.6.10. South-East Asia
        1. 3.6.10.1. South-East Asia Market size and forecast, 2016-2026 (USD Million)
        2. 3.6.10.2. South-East Asia Market size and forecast, 2016-2026 (Metric Ton)
      11. 3.6.11. Rest of Asia Pacific
        1. 3.6.11.1. Rest of Asia Pacific Market size and forecast, 2016-2026 (USD Million)
        2. 3.6.11.2. Rest of Asia Pacific Market size and forecast, 2016-2026 (Metric Ton)
    7. 3.7. Latin America
      1. 3.7.1. Latin America Aspirin Market size and forecast, 2016-2026
      2. 3.7.2. Latin America Aspirin Market, by Country, 2018 - 2025 (USD Million)
      3. 3.7.3. Latin America Market size and forecast, 2016-2026 (Metric Ton)
      4. 3.7.4. Latin America Aspirin Market, by Country, 2018 - 2025 (Metric Ton)
      5. 3.7.5. Latin America Aspirin Market, by Application, 2016-2026
        1. 3.7.5.1. Latin America Aspirin Market, by Application, 2016-2026 (USD Million)
        2. 3.7.5.2. Latin America Aspirin Market, by Application, 2016-2026 (Metric Ton)
      6. 3.7.6. Brazil
        1. 3.7.6.1. Brazil Market size and forecast, 2016-2026 (USD Million)
        2. 3.7.6.2. Brazil Market size and forecast, 2016-2026 (Metric Ton)
      7. 3.7.7. Mexico
        1. 3.7.7.1. Mexico Market size and forecast, 2016-2026 (USD Million)
        2. 3.7.7.2. Mexico Market size and forecast, 2016-2026 (Metric Ton)
      8. 3.7.8. Rest of Latin America
        1. 3.7.8.1. Rest of Latin America Market size and forecast, 2016-2026 (USD Million)
        2. 3.7.8.2. Rest of Latin America Market size and forecast, 2016-2026 (Metric Ton)
    8. 3.8. The Middle-East and Africa
      1. 3.8.1. The Middle-East and Africa Aspirin Market size and forecast, 2016-2026
      2. 3.8.2. The Middle-East and Africa Aspirin Market, by Country, 2018 - 2025 (USD Million)
      3. 3.8.3. The Middle-East and Africa Market size and forecast, 2016-2026 (Metric Ton)
      4. 3.8.4. The Middle-East and Africa Aspirin Market, by Country, 2018 - 2025 (Metric Ton)
      5. 3.8.5. The Middle-East and Africa Aspirin Market, by Application, 2016-2026
        1. 3.8.5.1. The Middle-East and Africa Aspirin Market, by Application, 2016-2026 (USD Million)
        2. 3.8.5.2. The Middle-East and Africa Aspirin Market, by Application, 2016-2026 (Metric Ton)
      6. 3.8.6. GCC Countries
        1. 3.8.6.1. GCC Countries Market size and forecast, 2016-2026 (USD Million)
        2. 3.8.6.2. GCC Countries Market size and forecast, 2016-2026 (Metric Ton)
      7. 3.8.7. South Africa
        1. 3.8.7.1. South Africa Market size and forecast, 2016-2026 (USD Million)
        2. 3.8.7.2. South Africa Market size and forecast, 2016-2026 (Metric Ton)
      8. 3.8.8. Rest of Middle-East Africa
        1. 3.8.8.1. Rest of Middle-East Africa Market size and forecast, 2016-2026 (USD Million)
        2. 3.8.8.2. Rest of Middle-East Africa Market size and forecast, 2016-2026 (Metric Ton)
  4. CHAPTER 4. Aspirin Production, Consumption, Export, Import by Regions
    1. 4.1. Global Aspirin production and revenue, 2015-2025 (USD Million) (Metric Ton)
    2. 4.2. Global Import and Export Analysis, by Region
  5. CHAPTER 5. Aspirin market – Competitive Landscape
    1. 5.1. Competitor Market Share – Revenue
    2. 5.2. Market Concentration Rate Analysis, Top 3 and Top 5 Players
    3. 5.3. Competitor Market Share – Volume
    4. 5.4. Strategic Development
      1. 5.4.1. Acquisitions and Mergers
      2. 5.4.2. New Products
      3. 5.4.3. Research & Development Activities
  6. CHAPTER 6. Company Profiles
    1. 6.1. Novacyl
      1. 6.1.1. Company Overview
      2. 6.1.2. Novacyl Sales, Revenue, Price, and Gross Margin
      3. 6.1.3. Product portfolio
      4. 6.1.4. Recent initiatives
    2. 6.2. Bayer
      1. 6.2.1. Company Overview
      2. 6.2.2. Bayer Sales, Revenue, Price, and Gross Margin
      3. 6.2.3. Product portfolio
      4. 6.2.4. Recent initiatives
    3. 6.3. Andhra Sugars
      1. 6.3.1. Company Overview
      2. 6.3.2. Andhra Sugars Sales, Revenue, Price, and Gross Margin
      3. 6.3.3. Product portfolio
      4. 6.3.4. Recent initiatives
    4. 6.4. WuyiCihang
      1. 6.4.1. Company Overview
      2. 6.4.2. WuyiCihang Sales, Revenue, Price, and Gross Margin
      3. 6.4.3. Product portfolio
      4. 6.4.4. Recent initiatives
    5. 6.5. HuayinJinqiancheng
      1. 6.5.1. Company Overview
      2. 6.5.2. HuayinJinqiancheng Sales, Revenue, Price, and Gross Margin
      3. 6.5.3. Product portfolio
      4. 6.5.4. Recent initiatives
    6. 6.6. NanjingPharmaceutical
      1. 6.6.1. Company Overview
      2. 6.6.2. NanjingPharmaceutical Sales, Revenue, Price, and Gross Margin
      3. 6.6.3. Product portfolio
      4. 6.6.4. Recent initiatives
    7. 6.7. HunanZhongnan
      1. 6.7.1. Company Overview
      2. 6.7.2. HunanZhongnan Sales, Revenue, Price, and Gross Margin
      3. 6.7.3. Product portfolio
      4. 6.7.4. Recent initiatives
    8. 6.8. Shandong Xinhua
      1. 6.8.1. Company Overview
      2. 6.8.2. Shandong Xinhua Sales, Revenue, Price, and Gross Margin
      3. 6.8.3. Product portfolio
      4. 6.8.4. Recent initiatives
    9. 6.9. HebeiJingye Group
      1. 6.9.1. Company Overview
      2. 6.9.2. HebeiJingye Group Sales, Revenue, Price, and Gross Margin
      3. 6.9.3. Product portfolio
      4. 6.9.4. Recent initiatives
    10. 6.10. Jilin Pharmaceutical
      1. 6.10.1. Company Overview
      2. 6.10.2. Jilin Pharmaceutical Sales, Revenue, Price, and Gross Margin
      3. 6.10.3. Product portfolio
      4. 6.10.4. Recent initiatives
    11. 6.11. Others
      1. 6.11.1. Company Overview
      2. 6.11.2. Others Sales, Revenue, Price, and Gross Margin
      3. 6.11.3. Product portfolio
      4. 6.11.4. Recent initiatives
  7. CHAPTER 7. Aspirin — Industry Analysis
    1. 7.1. Introduction and Taxonomy
    2. 7.2. Aspirin Market – Key Trends
      1. 7.2.1. Market Drivers
      2. 7.2.2. Market Restraints
      3. 7.2.3. Market Opportunities
    3. 7.3. Value Chain Analysis
    4. 7.4. Key Mandates and Regulations
    5. 7.5. Technology Roadmap and Timeline
    6. 7.6. Aspirin market – Attractiveness Analysis
      1. 7.6.1. By Application
      2. 7.6.2. By Region
  8. CHAPTER 8. Raw Material analysis
    1. 8.1. Aspirin Key Raw Material Analysis
      1. 8.1.1. Key Raw Materials
      2. 8.1.2. Price Trend of Key Raw Materials
    2. 8.2. Key Suppliers of Raw Materials
    3. 8.3. Proportion of Manufacturing Cost Structure
      1. 8.3.1. Raw Materials
      2. 8.3.2. Labor Cost
    4. 8.4. Manufacturing Expenses Analysis of Aspirin
  9. CHAPTER 9. Industrial Chain, Sourcing Strategy and Downstream Buyers
    1. 9.1. Aspirin Industrial Chain Analysis
    2. 9.2. Upstream Raw Materials Sourcing
      1. 9.2.1. Risk Mitigation:
      2. 9.2.2. Supplier Relationships:
      3. 9.2.3. Business Processes:
      4. 9.2.4. Securing the Product:
    3. 9.3. Raw Materials Sources of Aspirin Major Manufacturers in 2016
    4. 9.4. Downstream Buyers
    5. 9.5. Distributors/Traders List
  10. CHAPTER 10. Marketing Strategy Analysis, Distributors
    1. 10.1. Marketing Channel
    2. 10.2. Direct Marketing
    3. 10.3. Indirect Marketing
    4. 10.4. Marketing Channel Development Trend
    5. 10.5. Economic/Political Environmental Change
  11. CHAPTER 11. Report Conclusion
  12. CHAPTER 12. Research Approach & Methodology
    1. 12.1. Report Description
    2. 12.2. Research Scope
    3. 12.3. Research Methodology
      1. 12.3.1. Secondary Research
      2. 12.3.2. Primary Research
      3. 12.3.3. Models
        1. 12.3.3.1. Company Share Analysis Model
        2. 12.3.3.2. Revenue Based Modeling
        3. 12.3.3.3. Research Limitations

        List of Figures

        FIG. 1 Global Aspirin Market, 2016-2026 (USD Million)
        FIG. 2 Global Aspirin Market Share, by Application, 2018 & 2025 (USD Million)
        FIG. 3 Global Aspirin Market share, by Application, 2018 & 2025 (Metric Ton)
        FIG. 4 Global Fever Aspirin Market, 2016-2026 (USD Million)
        FIG. 5 Global Fever Aspirin  Market, 2016-2026 (Metric Ton)
        FIG. 6 Global Pain Relief Aspirin Market, 2016-2026 (USD Million)
        FIG. 7 Global Pain Relief Aspirin  Market, 2016-2026 (Metric Ton)
        FIG. 8 Global Inflammation Aspirin Market, 2016-2026 (USD Million)
        FIG. 9 Global Inflammation Aspirin  Market, 2016-2026 (Metric Ton)
        FIG. 10 Global Antiplatelet Aspirin Market, 2016-2026 (USD Million)
        FIG. 11 Global Antiplatelet Aspirin  Market, 2016-2026 (Metric Ton)
        FIG. 12 Global Other Aspirin Market, 2016-2026 (USD Million)
        FIG. 13 Global Other Aspirin  Market, 2016-2026 (Metric Ton)
        FIG. 14 Global Aspirin Market Share, by Region, 2018 & 2025
        FIG. 15 Global Aspirin Market Share, by Region, 2018 & 2025
        FIG. 16 North America Aspirin Market, 2016-2026
        FIG. 17 North America Aspirin  Market, 2016-2026 (Metric Ton)
        FIG. 18 U.S. Aspirin Market, 2016-2026
        FIG. 19 U.S. Aspirin  Market, 2016-2026 (Metric Ton)
        FIG. 20 Canada Aspirin Market, 2016-2026
        FIG. 21 Canada Aspirin  Market, 2016-2026 (Metric Ton)
        FIG. 22 Europe Aspirin Market, 2016-2026
        FIG. 23 Europe Aspirin  Market, 2016-2026 (Metric Ton)
        FIG. 24 Germany Aspirin Market, 2016-2026
        FIG. 25 Germany Aspirin  Market, 2016-2026 (Metric Ton)
        FIG. 26 France Aspirin Market, 2016-2026
        FIG. 27 France Aspirin  Market, 2016-2026 (Metric Ton)
        FIG. 28 U.K. Aspirin Market, 2016-2026
        FIG. 29 U.K. Aspirin  Market, 2016-2026 (Metric Ton)
        FIG. 30 Italy Aspirin Market, 2016-2026
        FIG. 31 Italy Aspirin  Market, 2016-2026 (Metric Ton)
        FIG. 32 Spain Aspirin Market, 2016-2026
        FIG. 33 Spain Aspirin  Market, 2016-2026 (Metric Ton)
        FIG. 34 Rest of Europe Aspirin Market, 2016-2026
        FIG. 35 Rest of Europe Aspirin  Market, 2016-2026 (Metric Ton)
        FIG. 36 Asia Pacific Aspirin Market, 2016-2026
        FIG. 37 Asia Pacific Aspirin  Market, 2016-2026 (Metric Ton)
        FIG. 38 China Aspirin Market, 2016-2026
        FIG. 39 China Aspirin  Market, 2016-2026 (Metric Ton)
        FIG. 40 Japan Aspirin Market, 2016-2026
        FIG. 41 Japan Aspirin  Market, 2016-2026 (Metric Ton)
        FIG. 42 India Aspirin Market, 2016-2026
        FIG. 43 India Aspirin  Market, 2016-2026 (Metric Ton)
        FIG. 44 South  Korea Aspirin Market, 2016-2026
        FIG. 45 South  Korea Aspirin  Market, 2016-2026 (Metric Ton)
        FIG. 46 South-East Asia Aspirin Market, 2016-2026
        FIG. 47 South-East Asia Aspirin  Market, 2016-2026 (Metric Ton)
        FIG. 48 Rest of Asia Pacific Aspirin Market, 2016-2026
        FIG. 49 Rest of Asia Pacific Aspirin  Market, 2016-2026 (Metric Ton)
        FIG. 50 Latin America Aspirin Market, 2016-2026
        FIG. 51 Latin America Aspirin  Market, 2016-2026 (Metric Ton)
        FIG. 52 Brazil Aspirin Market, 2016-2026
        FIG. 53 Brazil Aspirin  Market, 2016-2026 (Metric Ton)
        FIG. 54 Mexico Aspirin Market, 2016-2026
        FIG. 55 Mexico Aspirin  Market, 2016-2026 (Metric Ton)
        FIG. 56 Rest of Latin America Aspirin Market, 2016-2026
        FIG. 57 Rest of Latin America Aspirin  Market, 2016-2026 (Metric Ton)
        FIG. 58 The Middle-East and Africa Aspirin Market, 2016-2026
        FIG. 59 The Middle-East and Africa Aspirin  Market, 2016-2026 (Metric Ton)
        FIG. 60 GCC Countries Aspirin Market, 2016-2026
        FIG. 61 GCC Countries Aspirin  Market, 2016-2026 (Metric Ton)
        FIG. 62 South Africa Aspirin Market, 2016-2026
        FIG. 63 South Africa Aspirin  Market, 2016-2026 (Metric Ton)
        FIG. 64 Rest of Middle-East Africa Aspirin Market, 2016-2026
        FIG. 65 Rest of Middle-East Africa Aspirin  Market, 2016-2026 (Metric Ton)
        FIG. 66 Global Aspirin production and revenue, 2015-2025 (USD Million) (Metric Ton)
        FIG. 67 North America Aspirin production and revenue, 2015-2025 (USD Million) (Metric Ton)
        FIG. 68 Europe Aspirin production and revenue, 2015-2025 (USD Million) (Metric Ton)
        FIG. 69 Asia Pacific Aspirin production and revenue, 2015-2025 (USD Million) (Metric Ton)
        FIG. 70 Latin America Aspirin production and revenue, 2015-2025 (USD Million) (Metric Ton)
        FIG. 71 Middle East and Africa Aspirin production and revenue, 2015-2025 (USD Million) (Metric Ton)
        FIG. 72 Competitor Market Share – Revenue
        FIG. 73 Competitor Market Share – Volume
        FIG. 74 Novacyl Revenue and Growth Rate
        FIG. 75 Novacyl Market Share
        FIG. 76 Bayer Revenue and Growth Rate
        FIG. 77 Bayer Market Share
        FIG. 78 Andhra Sugars Revenue and Growth Rate
        FIG. 79 Andhra Sugars Market Share
        FIG. 80 WuyiCihang Revenue and Growth Rate
        FIG. 81 WuyiCihang Market Share
        FIG. 82 HuayinJinqiancheng Revenue and Growth Rate
        FIG. 83 HuayinJinqiancheng Market Share
        FIG. 84 NanjingPharmaceutical Revenue and Growth Rate
        FIG. 85 NanjingPharmaceutical Market Share
        FIG. 86 HunanZhongnan Revenue and Growth Rate
        FIG. 87 HunanZhongnan Market Share
        FIG. 88 Shandong Xinhua Revenue and Growth Rate
        FIG. 89 Shandong Xinhua Market Share
        FIG. 90 HebeiJingye Group Revenue and Growth Rate
        FIG. 91 HebeiJingye Group Market Share
        FIG. 92 Jilin Pharmaceutical Revenue and Growth Rate
        FIG. 93 Jilin Pharmaceutical Market Share
        FIG. 94 Others Revenue and Growth Rate
        FIG. 95 Others Market Share
        FIG. 96 Market Dynamics
        FIG. 97 Global Aspirin – Value Chain Analysis
        FIG. 98 Key Mandates and Regulations
        FIG. 99 Technology Roadmap and Timeline
        FIG. 100 Market Attractiveness Analysis – By Application
        FIG. 101 Market Attractiveness Analysis – By Region
        FIG. 102 Manufacturing Cost Structure of Aspirin
        FIG. 103 Aspirin Industrial Chain Analysis
        FIG. 104 Market Channel
        FIG. 105 Marketing Channel Development Trend
        FIG. 106 Growth in World Gross Product, 2008-2018


        List of Tables

        TABLE 1 Global Aspirin market, 2018 & 2025 (USD Million)
        TABLE 2 Global Aspirin market, by Application, 2016-2026 (USD Million)
        TABLE 3 Global Aspirin market, by Application, 2016-2026 (Metric Ton)
        TABLE 4 Global Aspirin market, by region, 2016-2026 (USD Million)
        TABLE 5 Global Aspirin market, by region, 2016-2026 (Metric Ton)
        TABLE 6 North America Aspirin Market, by Application, 2016-2026 (USD Million)
        TABLE 7 North America Aspirin Market, by Application, 2016-2026 (Metric Ton)
        TABLE 8 Europe Aspirin Market, by Application, 2016-2026 (USD Million)
        TABLE 9 Europe Aspirin Market, by Application, 2016-2026 (Metric Ton)
        TABLE 10 Asia Pacific Aspirin Market, by Application, 2016-2026 (USD Million)
        TABLE 11 Asia Pacific Aspirin Market, by Application, 2016-2026 (Metric Ton)
        TABLE 12 Latin America Aspirin Market, by Application, 2016-2026 (USD Million)
        TABLE 13 Latin America Aspirin Market, by Application, 2016-2026 (Metric Ton)
        TABLE 14 The Middle-East and Africa Aspirin Market, by Application, 2016-2026 (USD Million)
        TABLE 15 The Middle-East and Africa Aspirin Market, by Application, 2016-2026 (Metric Ton)
        TABLE 16 North America Aspirin Production, Consumption, Export, Import, 2016-2019
        TABLE 17 Europe Aspirin Production, Consumption, Export, Import, 2016-2019
        TABLE 18 Asia Pacific Aspirin Production, Consumption, Export, Import, 2016-2019
        TABLE 19 Latin America Aspirin Production, Consumption, Export, Import, 2016-2019
        TABLE 20 Middle East & Africa Aspirin Production, Consumption, Export, Import, 2016-2019
        TABLE 21 Global Aspirin Market - Company Revenue Analysis 2016-2019 (USD Million)
        TABLE 22 Global Aspirin Market - Company Revenue Share Analysis 2016-2019(%)
        TABLE 23 Global Aspirin Market - Company Volume Analysis 2016-2019 (Metric Ton)
        TABLE 24 Global Aspirin Market - Company Volume Share Analysis 2016-2019(%)
        TABLE 25 Acquisitions and Mergers
        TABLE 26 New Product/Service Launch
        TABLE 27 Research & Development Activities
        TABLE 28 Market Drivers
        TABLE 29 Market Restraints
        TABLE 30 Market Opportunities
        TABLE 31 Production Base and Market Concentration Rate of Raw Material
        TABLE 32 Key Suppliers of Raw Materials
        TABLE 33 Raw Materials Sources of Aspirin Major Manufacturers in 2016
        TABLE 34 Major Buyers of Aspirin
        TABLE 35 Distributors/Traders of Aspirin by Region

Industry Major Market Players

  • Novacyl
  •  Bayer
  •  hra Sugars
  •  WuyiCihang
  •  HuayinJinqiancheng
  •  NanjingPharmaceutical
  •  HunanZhongnan