![]()
Search Market Research Report
Asia Pacific Desktop as a Service Market Size, Share Global Analysis Report, 2018 – 2027

Asia Pacific Desktop as a Service Market By Desktop Type (Persistent and Non-Persistent), By Cloud Type (Private, Hybrid, and Public), By Organization Size (Large Enterprises and Small & Medium-Sized Enterprises (SMEs)), and By Vertical (Telecom & IT, Healthcare, Manufacturing, Banking, Financial Services, and Insurance (BFSI), Retail, and Travel & Logistics): Industry Perspective, Comprehensive Analysis, and Forecast 2018 – 2027
Industry Insights
The report covers the forecast and analysis of the Asia Pacific Desktop as a Service market. The study provides historical data from 2015 to 2018 along with a forecast from 2019 to 2027 based on revenue (USD Million). The study includes drivers and restraints of the Asia Pacific Desktop as a Service market along with the impact they have on the demand over the forecast period. Additionally, the report includes the study of opportunities available in the Asia Pacific Desktop as a Service market.
In order to give the users of this report a comprehensive view of the Asia Pacific Desktop as a Service market, we have included a competitive landscape and an analysis of Porter’s Five Forces model for the market. The study encompasses a market attractiveness analysis, wherein all the segments are benchmarked based on their market size, growth rate, and general attractiveness.
The report provides company market share analysis to give a broader overview of the key players in the market. In addition, the report also covers key strategic developments of the market including acquisitions & mergers, new products & service launches, agreements, partnerships, collaborations & joint ventures, research & development, and regional expansion of major participants involved in the market on a global and regional basis.
The study provides a decisive view of the Asia Pacific Desktop as a Service market by segmenting the market based on desktop type, cloud type, organization size, vertical, and regions. All the segments have been analyzed based on present and future trends and the market is estimated from 2019 to 2027.
Small & medium-sized firms are the key users of the desktop as a service. Moreover, these firms seek a robust IT system & cloud-based security. However, due to a lack of capital firms are not able to maintain or develop their own security system, and hence they hire the desktop as a service from external service providers. In addition to this, beneficial characteristics including security & compliance, reduction in the operational & desktop support, mobility, and minimization of acquisition & maintenance charges are likely to be the major market growth drivers during the forecast timeline. In addition to this, the growing acceptance of the internet of things is set to create new avenues for the DaaS industry during the forecast timeline. Apart from this, the escalating need for reducing capital spending as well as operational expenses along with the growing popularity of contract-based solutions across small & medium-sized firms will boost the market growth.
On the basis of desktop type, the market is divided into Persistent and Non-Persistent desktop types. Based on the cloud type, the market for desktop as a service in the Asia Pacific is sectored into Private, Hybrid, and Public cloud types. In terms of organization size, the industry is classified into Large Enterprises and Small & Medium-Sized Enterprises (SMEs).
Based on the vertical, the industry is divided into Telecom & IT, Healthcare, Manufacturing, Banking, Financial Services, and Insurance (BFSI), Retail, and Travel & Logistics.
 Report Scope
Report Attribute |
Details |
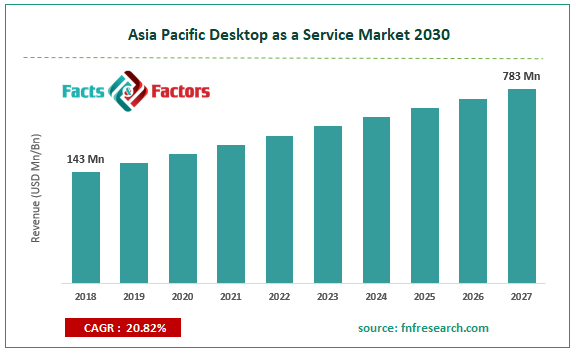
Market Size in 2018 |
USD 143 Million |
Projected Market Size in 2027 |
USD 783 Million |
CAGR Growth Rate |
20.82% CAGR |
Base Year 2020 |
|
Forecast Years |
2019-2027 |
Key Market Players |
Birlasoft, Citrix Systems Inc., IBM Corporation, KEMP Technologies, Leostream Corporation, Microsoft, Oracle Corporation, Amazon, CISCO, NTT Communications Corporation, VMware Inc., and QlikTech. |
Key Segment |
By Desktop Type, By Cloud Type, By Organization Size, By Vertical, By Region |
Major Regions Covered |
North America, Europe, Asia Pacific, Latin America, and the Middle East & Africa |
Purchase Options |
Request customized purchase options to meet your research needs. Explore purchase options |
This report segments the Asia Pacific Desktop as a Service market as follows:
Some of the major players in the business include
- Birlasoft
- Citrix Systems Inc.
- IBM Corporation
- KEMP Technologies
- Leostream Corporation
- Microsoft
- Oracle Corporation
- Amazon
- CISCO
- NTT Communications Corporation
- VMware Inc.
- QlikTech
Birlasoft, Citrix Systems Inc., IBM Corporation, KEMP Technologies, Leostream Corporation, Microsoft, Oracle Corporation, Amazon, CISCO, NTT Communications Corporation, VMware Inc., and QlikTech.
By Desktop Type Analysis
- Persistent
- Non-Persistent
By Cloud Type Analysis
- Private
- Hybrid
- Public
By Organization Size Analysis
- Large Enterprises
- Small & Medium-Sized Enterprises (SMEs)
By Vertical Analysis
- Telecom & IT
- Healthcare
- Manufacturing
- Banking, Financial Services, and Insurance (BFSI)
- Retail
- Travel & Logistics
Country-wise Segment Analysis
- North America
- U.S.
- Europe
- UK
- France
- Germany
- Asia Pacific
- China
- Japan
- India
- Latin America
- Brazil
- Middle East and Africa
Table of Content
Industry Major Market Players
- Birlasoft
- Citrix Systems Inc.
- IBM Corporation
- KEMP Technologies
- Leostream Corporation
- Microsoft
- Oracle Corporation
- Amazon
- CISCO
- NTT Communications Corporation
- VMware Inc.
- QlikTech


Copyright © 2025 - 2026, All Rights Reserved, Facts and Factors