![]()
Search Market Research Report
AR in Enterprise Market Size, Share Global Analysis Report, 2018 – 2025

AR in Enterprise Market By Component (Hardware and Software), By Display Device (Head-Mounted Display, Head-Up Display, and Smart Glass), By Enterprise Size (SMEs and Large Enterprise), and By Application (Automotive, Retail, Medical, Aerospace & Defense, and Gaming): Global Industry Perspective, Comprehensive Analysis, and Forecast 2018 – 2025
Industry Insights
The report covers the forecast and analysis of the AR in Enterprise market on a global and regional level. The study provides historical data from 2015 to 2018 along with a forecast from 2019 to 2025 based on revenue (USD Million). The study includes drivers and restraints of the AR in the Enterprise market along with the impact they have on the demand over the forecast period. Additionally, the report includes the study of opportunities available in the AR in the Enterprise market on a global level.
In order to give the users of this report a comprehensive view of the AR in the Enterprise market, we have included a competitive landscape and an analysis of Porter&rsquo's Five Forces model for the market. The study encompasses a market attractiveness analysis, wherein all the segments are benchmarked based on their market size, growth rate, and general attractiveness.
The report provides a company market share analysis to give a broader overview of the key players in the market. In addition, the report also covers key strategic developments of the market including acquisitions & mergers, new product & service launches, agreements, partnerships, collaborations & joint ventures, research & development, and regional expansion of major participants involved in the market on a global and regional basis.
The study provides a decisive view of the AR in Enterprise market by segmenting the market based on component, display device, enterprise size, application, and regions. All the segments have been analyzed based on present and future trends and the market is estimated from 2019 to 2025. The regional segmentation includes the current and forecast demand for North America, Europe, Asia Pacific, Latin America, and the Middle East and Africa.
A massive preference for AR in the medical & automotive sectors is predicted to further influence the growth of the market over the forecast timeline. For instance, AR offers a cost-efficient and time-saving approach for the medical fraternity including physicians & students for treating the patients through mapping of medical data with a real-world simulation of surgeries. However, the market growth over the forecast timeline can be hampered due to factors like low storage space & the limited size of memory cards in smartphones. Nevertheless, the huge fund allocation for developing AR technologies will enlarge the scope of the business along with nullifying the negative impact.
Based on the component, the market is divided into Software and Hardware. In terms of display devices, the AR in Enterprise industry is classified into Head-Mounted Displays, Head-Up Displays, and Smart Glass. On the basis of enterprise size, the market is segmented into SMEs and Large enterprises. Application-wise, the industry is segregated into Automotive, Aerospace & Defense, Retail, Medical, and Gaming.
 Report Scope
Report Attribute |
Details |
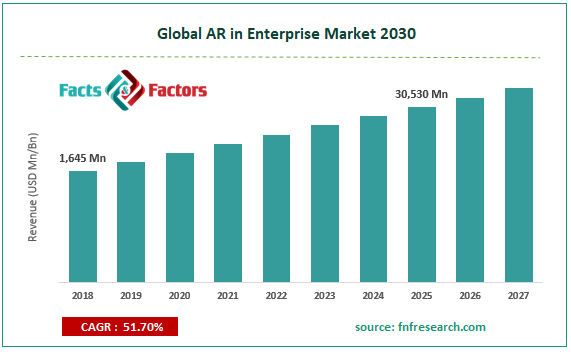
Market Size in 2018 |
USD 1,645 Million |
Projected Market Size in 2025 |
USD 30,530 Million |
CAGR Growth Rate |
51.7% CAGR |
Base Year |
2018 |
Forecast Years |
2018-2025 |
Key Market Players |
Vuzix Corporation, Samsung Electronics Co. Ltd., Google, Inc., Apple, Inc., CyberGlove Systems, Inc., Blippar, DAQRI LLC, Eon Reality, Inc., Facebook Inc., HTC Corporation, Magic Leap, Marxent Labs, LLC, Microsoft, Corporation, PTC, Qualcomm, Rockwell Collins, Upskill, and Wikitude GmbH among others. |
Key Segment |
By Component, By Display Device, By Enterprise Size, By Application, By Region |
Major Regions Covered |
North America, Europe, Asia Pacific, Latin America, and the Middle East & Africa |
Purchase Options |
Request customized purchase options to meet your research needs. Explore purchase options |
Competitive Analysis
- Vuzix Corporation
- Samsung Electronics Co. Ltd.
- Google Inc.
- Apple Inc.
- CyberGlove Systems Inc.
- Blippar
- DAQRI LLC
- Eon Reality Inc.
- Facebook Inc.
- HTC Corporation
- Magic Leap
- Marxent Labs
- LLC
- Microsoft
- Corporation
- PTC
- Qualcomm
- Rockwell Collins
- Upskill Wikitude GmbH among others
Table of Content
Industry Major Market Players
- Vuzix Corporation,
- Samsung Electronics Co. Ltd.,
- Google Inc.,
- Apple Inc.,
- CyberGlove Systems Inc.,
- Blippar,
- DAQRI LLC,
- Eon Reality Inc.,
- Facebook Inc.,
- HTC Corporation,
- Magic Leap,
- Marxent Labs,
- LLC,
- Microsoft,
- Corporation,
- PTC,
- Qualcomm,
- Rockwell Collins,
- Upskill,
- Wikitude GmbH among others.


Copyright © 2025 - 2026, All Rights Reserved, Facts and Factors