Search Market Research Report

Discover Our Latest Reports
Discover Our Featured Reports
Discover Top Selling Reports

Aquaculture Market Size, Share Global Analysis Report, 2020–2026

report img

Aquaculture Market By Type (Carps, Crustaceans, Mackerel, Mollusca, Salmon, Trout, Others), and By Culture Environment (Fresh Water, Marine Water, Brackish Water) By Channel (Direct Sales, Distributor): Global Industry Outlook, Market Size, Business Intelligence, Consumer Preferences, Statistical Surveys, Comprehensive Analysis, Historical Developments, Current Trends, and Forecast 2020–2026

Industry Insights

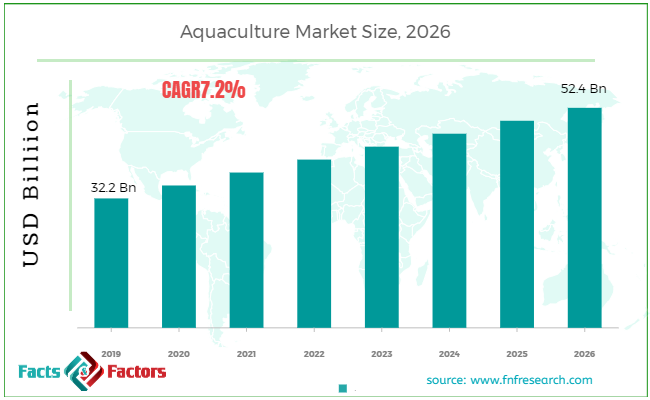
[188+ Pages Report] According to the report published by Facts Factors, the global aquaculture market size was worth around USD 32.2 billion in 2019 and is predicted to grow to around USD 52.4 billion by 2026 with a compound annual growth rate (CAGR) of roughly 7.2% between 2020 and 2026. The report analyzes the global aquaculture market drivers, restraints/challenges, and the effect they have on the demands during the projection period. In addition, the report explores emerging opportunities in the aquaculture market.

Aquaculture Market Size

To know more about this report | Request Free Sample Copy

This specialized and expertise-oriented industry research report scrutinizes the technical and commercial business outlook of the aquaculture industry. The report analyzes and declares the historical and current trends analysis of the aquaculture industry and subsequently recommends the projected trends anticipated to be observed in the aquaculture market during the upcoming years.

The aquaculture market report analyzes and notifies the industry statistics at the global as well as regional and country levels to acquire a thorough perspective of the entire aquaculture market. The historical and past insights are provided for FY 2016 to FY 2020 whereas projected trends are delivered for FY 2020 to FY 2026. The quantitative and numerical data is represented in terms of both volumes (Units) and value (USD Million) from FY 2016 – 2026.


logoKey Insights from Primary Research

  • According to the CXOs working in the aquaculture industry, the market is predicted to witness a substantial growth of above 7.2% during 2020-2026 attributed to the increasing consumption of seafood for health benefits.
  • Due to the availability of seafood and increasing demand in the growing urbanization, the market is expected to develop over USD 52.4 billion by 2026. In 2019, the market accounted for USD 32.2 billion.
  • By product type analysis, the salmon segment headed the market in 2019 and it is expected to grow over the forecast period attributed to the high availability of salmons and their nutritional value for health.
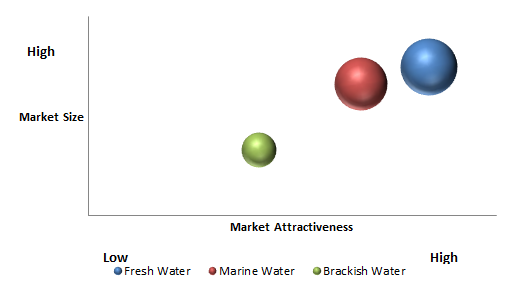
  • By culture environment analysis, freshwater led the market in 2019 and it is expected to increase during the forthcoming years.
  • By geography, Asia Pacific is experiencing massive demand for aquaculture owing to a significantly increasing demand for fish food, and suitable climatic conditions in countries like China, Russia, etc.

logoKey Recommendations from Analysts

  • Our analysts recommend that North America is expected to boost the demand for aquaculture owing to the rising government initiatives in fish farming.
  • The European region is expected to have the fastest growth in the market owing to the increasing requirement for seafood from a growing population.
  • The Middle East & Africa is projected to demonstrate considerable growth over the forecast period owing to growing aquacultural activities in these regions.
  • The carp, trout, and mollusks segment is expected to witness the fastest growth due to the increasing cultivation of fish farming.
  • Economic growth and increasing R&D activities are anticipated to produce attractive opportunities in the market.

logoMarket Attractiveness By Culture Environment Analysis

Aquaculture Market

To know more about this report | Request Free Sample Copy


The quantitative data is further underlined and reinforced by comprehensive qualitative data which comprises various across-the-board market dynamics. The rationales which directly or indirectly impact the aquaculture industry are exemplified through parameters such as growth drivers, restraints, challenges, and opportunities among other impacting factors.

Throughout our research report, we have encompassed all the proven models and tools of industry analysis and extensively illustrated all the key business strategies and business models adopted in the aquaculture industry. The report provides an all-inclusive and detailed competitive landscape prevalent in the aquaculture market.

The report utilizes established industry analysis tools and models such as Porter’s Five Forces framework to analyze and recognize critical business strategies adopted by various stakeholders involved in the entire value chain of the aquaculture industry. The aquaculture market report additionally employs SWOT analysis and PESTLE analysis models for further in-depth analysis.

The report study further includes an in-depth analysis of industry players' market shares and provides an overview of leading players' market positions in the aquaculture sector. Key strategic developments in the aquaculture market competitive landscape such as acquisitions & mergers, inaugurations of different products and services, partnerships & joint ventures, MoU agreements, VC & funding activities, R&D activities, and geographic expansion among other noteworthy activities by key players of the aquaculture market are appropriately highlighted in the report.

Aquaculture is also known as aquafarming farming. Aquaculture includes the farming of aquatic organisms such as crustaceans, mollusks, aquatic plants, fish, algae, and other organisms. Aquaculture help to enhance the production of aquatic organism, it includes types of farming such as oyster farming, shrimp farming, fish farming, cultivation of ornamental fish, algaculture which is also known as seaweed farming, mariculture, etc. Aquaculture is the main source of food in seafood restaurants which serves seafood such as prawns, clams, salmon, tilapia, etc.

The availability of seafood and increasing demand in the growing urbanization is driving the aquaculture market growth. Moreover, increasing consumption of seafood for health benefits is anticipated to fuel the market growth. However, changes in climate conditions such as a rise in temperature rise, changes in monsoon patterns, may produce restraints for the aquaculture market. Nonetheless, increasing R&D activities, and rising investment in aquacultural production may create lucrative opportunities in the market.

The aquaculture market research report delivers an acute valuation and taxonomy of the aquaculture industry by practically splitting the market based on different types, applications, and regions. Through the analysis of the historical and projected trends, all the segments and sub-segments were evaluated through the bottom-up approach, and different market sizes have been projected for FY 2020 to FY 2026.

logoReport Scope

Report Attribute

Details

Market Size in 2019

USD 32.2 Billion

Projected Market Size in 2026

USD 52.4 Billion

CAGR Growth Rate

7.2% CAGR

Base Year

2019

Forecast Years

2020-2026

Key Market Players

MOWI ASA, Nippon Suisan Kaisha Ltd, Austevoll Seafood ASA, SalMar ASA, Cooke Aquaculture, Inc., Norway Royal Salmon ASA, Tassal Group Ltd, Campania Pesquera, Multiexport Foods SA, Camanchaca SA, Dainichi Corporation, P/F Bakkafrost, Stoly Sea Farm SA, Nireus SA, Tongwei Group Co., Ltd., Kyokuyo Co., Ltd., Thai Union Group PCL, Surapon Foods Public Company Limited, and Maruha Nichiro Corporation, and Others

Key Segment

By Product, Culture, Channel, and Region

Major Regions Covered

North America, Europe, Asia Pacific, Latin America, and the Middle East & Africa

Purchase Options

Request customized purchase options to meet your research needs. Explore purchase options

The regional segmentation of the Aquaculture industry includes the complete classification of all the major continents including North America, Latin America, Europe, Asia Pacific, and the Middle East & Africa. Further, country-wise data for the Aquaculture industry is provided for the leading economies of the world.

The aquaculture market is segmented based on product type and culture environment, and channel. Based on type segmentation, the market is classified into carp, crustaceans, mackerel, Mollusca, salmon, trout, and others. In terms of culture environment segmentation, the market is bifurcated into freshwater, marine water, and brackish water. And based on channel, the market is divided into direct sales and distributors.

logoSome of the essential players operating in the aquaculture market, but not restricted to include

  •  Nippon Suisan Kaisha Ltd
  •  MOWI ASA
  •  SalMar ASA
  •  Cooke Aquaculture Inc.
  •  Austevoll Seafood ASA
  •  Norway Royal Salmon ASA
  •  Campania Pesquera
  •  Tassal Group Ltd
  •  Multiexport Foods SA
  •  Dainichi Corporation
  •  Camanchaca SA
  •  P/F Bakkafrost
  •  Nireus SA
  •  Stoly Sea Farm SA
  •  Tongwei Group Co. Ltd.
  •  Kyokuyo Co. Ltd.
  •  Surapon Foods Public Company Limited
  •  Thai Union Group PCL
  •  Maruha Nichiro Corporation

The taxonomy of the aquaculture industry by its scope and segmentation is as follows:

logo By Product Types Segmentation Analysis

  • Carps
  • Crustaceans
  • Mackerel
  • Mollusca
  • Salmon
  • Trout
  • Others

logo Culture Environment Segmentation Analysis

  • Fresh Water
  • Marine Water
  • Brackish Water

logo By Channel Segmentation Analysis

  • Direct Sales
  • Distributor

logo Regional Segmentation Analysis

  • North America
    • The U.S.
    • Canada
  • Europe
    • Germany
    • The UK
    • France
    • Spain
    • Italy
    • Rest of Europe
  • Asia Pacific
    • China
    • Japan
    • India
    • South Korea
    • Southeast Asia
    • Rest of Asia Pacific
  • Latin America
    • Brazil
    • Mexico
    • Rest of Latin America
  • Middle East & Africa
    • GCC
    • South Africa
    • Rest of Middle East & Africa

Table of Content

  1. CHAPTER 1. Executive Summary
  2. CHAPTER 2. Aquaculture market – Product Type Analysis
    1. 2.1. Global Aquaculture Market – Product Type Overview
    2. 2.2. Global Aquaculture Market Share, by Product Type, 2018 & 2025 (USD Billion)
    3. 2.3. Global Aquaculture Market share, by Product Type, 2018 & 2025 (Kilo Tons)
    4. 2.4. Carps
      1. 2.4.1. Global Carps Aquaculture Market, 2016-2026 (USD Billion)
      2. 2.4.2. Global Carps Aquaculture Market, 2016-2026 (Kilo Tons)
    5. 2.5. Crustaceans
      1. 2.5.1. Global Crustaceans Aquaculture Market, 2016-2026 (USD Billion)
      2. 2.5.2. Global Crustaceans Aquaculture Market, 2016-2026 (Kilo Tons)
    6. 2.6. Mackerel
      1. 2.6.1. Global Mackerel Aquaculture Market, 2016-2026 (USD Billion)
      2. 2.6.2. Global Mackerel Aquaculture Market, 2016-2026 (Kilo Tons)
    7. 2.7. Mollusca
      1. 2.7.1. Global Mollusca Aquaculture Market, 2016-2026 (USD Billion)
      2. 2.7.2. Global Mollusca Aquaculture Market, 2016-2026 (Kilo Tons)
    8. 2.8. Salmon
      1. 2.8.1. Global Salmon Aquaculture Market, 2016-2026 (USD Billion)
      2. 2.8.2. Global Salmon Aquaculture Market, 2016-2026 (Kilo Tons)
    9. 2.9. Trout
      1. 2.9.1. Global Trout Aquaculture Market, 2016-2026 (USD Billion)
      2. 2.9.2. Global Trout Aquaculture Market, 2016-2026 (Kilo Tons)
    10. 2.10. Others
      1. 2.10.1. Global Others Aquaculture Market, 2016-2026 (USD Billion)
      2. 2.10.2. Global Others Aquaculture Market, 2016-2026 (Kilo Tons)
  3. CHAPTER 3. Aquaculture market – Culture Environment Analysis
    1. 3.1. Global Aquaculture Market – Culture Environment Overview
    2. 3.2. Global Aquaculture Market Share, by Culture Environment, 2018 & 2025 (USD Billion)
    3. 3.3. Global Aquaculture Market share, by Culture Environment, 2018 & 2025 (Kilo Tons)
    4. 3.4. Fresh Water
      1. 3.4.1. Global Fresh Water Aquaculture Market, 2016-2026 (USD Billion)
      2. 3.4.2. Global Fresh Water Aquaculture Market, 2016-2026 (Kilo Tons)
    5. 3.5. Marine Water
      1. 3.5.1. Global Marine Water Aquaculture Market, 2016-2026 (USD Billion)
      2. 3.5.2. Global Marine Water Aquaculture Market, 2016-2026 (Kilo Tons)
    6. 3.6. Brackish Water
      1. 3.6.1. Global Brackish Water Aquaculture Market, 2016-2026 (USD Billion)
      2. 3.6.2. Global Brackish Water Aquaculture Market, 2016-2026 (Kilo Tons)
  4. CHAPTER 4. Aquaculture market – Channel Analysis
    1. 4.1. Global Aquaculture Market – Channel Overview
    2. 4.2. Global Aquaculture Market Share, by Channel, 2018 & 2025 (USD Billion)
    3. 4.3. Global Aquaculture Market share, by Channel, 2018 & 2025 (Kilo Tons)
    4. 4.4. Direct Sales
      1. 4.4.1. Global Direct Sales Aquaculture Market, 2016-2026 (USD Billion)
      2. 4.4.2. Global Direct Sales Aquaculture Market, 2016-2026 (Kilo Tons)
    5. 4.5. Distributor
      1. 4.5.1. Global Distributor Aquaculture Market, 2016-2026 (USD Billion)
      2. 4.5.2. Global Distributor Aquaculture Market, 2016-2026 (Kilo Tons)
  5. CHAPTER 5. Aquaculture market – Regional Analysis
    1. 5.1. Global Aquaculture Market Regional Overview
    2. 5.2. Global Aquaculture Market Share, by Region, 2018 & 2025 (Value)
    3. 5.3. Global Aquaculture Market Share, by Region, 2018 & 2025 (Volume)
    4. 5.4. North America
      1. 5.4.1. North America Aquaculture Market size and forecast, 2016-2026
      2. 5.4.2. North America Aquaculture Market, by Country, 2018 - 2025 (USD Billion)
      3. 5.4.3. North America Market size and forecast, 2016-2026 (Kilo Tons)
      4. 5.4.4. North America Aquaculture Market, by Country, 2018 - 2025 (Kilo Tons)
      5. 5.4.5. North America Aquaculture Market, by Product Type, 2016-2026
        1. 5.4.5.1. North America Aquaculture Market, by Product Type, 2016-2026 (USD Billion)
        2. 5.4.5.2. North America Aquaculture Market, by Product Type, 2016-2026 (Kilo Tons)
      6. 5.4.6. North America Aquaculture Market, by Culture Environment, 2016-2026
        1. 5.4.6.1. North America Aquaculture Market, by Culture Environment, 2016-2026 (USD Billion)
        2. 5.4.6.2. North America Aquaculture Market, by Culture Environment, 2016-2026 (Kilo Tons)
      7. 5.4.7. North America Aquaculture Market, by Channel, 2016-2026
        1. 5.4.7.1. North America Aquaculture Market, by Channel, 2016-2026 (USD Billion)
        2. 5.4.7.2. North America Aquaculture Market, by Channel, 2016-2026 (Kilo Tons)
      8. 5.4.8. U.S.
        1. 5.4.8.1. U.S. Market size and forecast, 2016-2026 (USD Billion)
        2. 5.4.8.2. U.S. Market size and forecast, 2016-2026 (Kilo Tons)
      9. 5.4.9. Canada
        1. 5.4.9.1. Canada Market size and forecast, 2016-2026 (USD Billion)
        2. 5.4.9.2. Canada Market size and forecast, 2016-2026 (Kilo Tons)
    5. 5.5. Europe
      1. 5.5.1. Europe Aquaculture Market size and forecast, 2016-2026
      2. 5.5.2. Europe Aquaculture Market, by Country, 2018 - 2025 (USD Billion)
      3. 5.5.3. Europe Market size and forecast, 2016-2026 (Kilo Tons)
      4. 5.5.4. Europe Aquaculture Market, by Country, 2018 - 2025 (Kilo Tons)
      5. 5.5.5. Europe Aquaculture Market, by Product Type, 2016-2026
        1. 5.5.5.1. Europe Aquaculture Market, by Product Type, 2016-2026 (USD Billion)
        2. 5.5.5.2. Europe Aquaculture Market, by Product Type, 2016-2026 (Kilo Tons)
      6. 5.5.6. Europe Aquaculture Market, by Culture Environment, 2016-2026
        1. 5.5.6.1. Europe Aquaculture Market, by Culture Environment, 2016-2026 (USD Billion)
        2. 5.5.6.2. Europe Aquaculture Market, by Culture Environment, 2016-2026 (Kilo Tons)
      7. 5.5.7. Europe Aquaculture Market, by Channel, 2016-2026
        1. 5.5.7.1. Europe Aquaculture Market, by Channel, 2016-2026 (USD Billion)
        2. 5.5.7.2. Europe Aquaculture Market, by Channel, 2016-2026 (Kilo Tons)
      8. 5.5.8. Germany
        1. 5.5.8.1. Germany Market size and forecast, 2016-2026 (USD Billion)
        2. 5.5.8.2. Germany Market size and forecast, 2016-2026 (Kilo Tons)
      9. 5.5.9. France
        1. 5.5.9.1. France Market size and forecast, 2016-2026 (USD Billion)
        2. 5.5.9.2. France Market size and forecast, 2016-2026 (Kilo Tons)
      10. 5.5.10. U.K.
        1. 5.5.10.1. U.K. Market size and forecast, 2016-2026 (USD Billion)
        2. 5.5.10.2. U.K. Market size and forecast, 2016-2026 (Kilo Tons)
      11. 5.5.11. Italy
        1. 5.5.11.1. Italy Market size and forecast, 2016-2026 (USD Billion)
        2. 5.5.11.2. Italy Market size and forecast, 2016-2026 (Kilo Tons)
      12. 5.5.12. Spain
        1. 5.5.12.1. Spain Market size and forecast, 2016-2026 (USD Billion)
        2. 5.5.12.2. Spain Market size and forecast, 2016-2026 (Kilo Tons)
      13. 5.5.13. Rest of Europe
        1. 5.5.13.1. Rest of Europe Market size and forecast, 2016-2026 (USD Billion)
        2. 5.5.13.2. Rest of Europe Market size and forecast, 2016-2026 (Kilo Tons)
    6. 5.6. Asia Pacific
      1. 5.6.1. Asia Pacific Aquaculture Market size and forecast, 2016-2026
      2. 5.6.2. Asia Pacific Aquaculture Market, by Country, 2018 - 2025 (USD Billion)
      3. 5.6.3. Asia Pacific Market size and forecast, 2016-2026 (Kilo Tons)
      4. 5.6.4. Asia Pacific Aquaculture Market, by Country, 2018 - 2025 (Kilo Tons)
      5. 5.6.5. Asia Pacific Aquaculture Market, by Product Type, 2016-2026
        1. 5.6.5.1. Asia Pacific Aquaculture Market, by Product Type, 2016-2026 (USD Billion)
        2. 5.6.5.2. Asia Pacific Aquaculture Market, by Product Type, 2016-2026 (Kilo Tons)
      6. 5.6.6. Asia Pacific Aquaculture Market, by Culture Environment, 2016-2026
        1. 5.6.6.1. Asia Pacific Aquaculture Market, by Culture Environment, 2016-2026 (USD Billion)
        2. 5.6.6.2. Asia Pacific Aquaculture Market, by Culture Environment, 2016-2026 (Kilo Tons)
      7. 5.6.7. Asia Pacific Aquaculture Market, by Channel, 2016-2026
        1. 5.6.7.1. Asia Pacific Aquaculture Market, by Channel, 2016-2026 (USD Billion)
        2. 5.6.7.2. Asia Pacific Aquaculture Market, by Channel, 2016-2026 (Kilo Tons)
      8. 5.6.8. China
        1. 5.6.8.1. China Market size and forecast, 2016-2026 (USD Billion)
        2. 5.6.8.2. China Market size and forecast, 2016-2026 (Kilo Tons)
      9. 5.6.9. Japan
        1. 5.6.9.1. Japan Market size and forecast, 2016-2026 (USD Billion)
        2. 5.6.9.2. Japan Market size and forecast, 2016-2026 (Kilo Tons)
      10. 5.6.10. India
        1. 5.6.10.1. India Market size and forecast, 2016-2026 (USD Billion)
        2. 5.6.10.2. India Market size and forecast, 2016-2026 (Kilo Tons)
      11. 5.6.11. South Korea
        1. 5.6.11.1. South Korea Market size and forecast, 2016-2026 (USD Billion)
        2. 5.6.11.2. South Korea Market size and forecast, 2016-2026 (Kilo Tons)
      12. 5.6.12. South-East Asia
        1. 5.6.12.1. South-East Asia Market size and forecast, 2016-2026 (USD Billion)
        2. 5.6.12.2. South-East Asia Market size and forecast, 2016-2026 (Kilo Tons)
      13. 5.6.13. Rest of Asia Pacific
        1. 5.6.13.1. Rest of Asia Pacific Market size and forecast, 2016-2026 (USD Billion)
        2. 5.6.13.2. Rest of Asia Pacific Market size and forecast, 2016-2026 (Kilo Tons)
    7. 5.7. Latin America
      1. 5.7.1. Latin America Aquaculture Market size and forecast, 2016-2026
      2. 5.7.2. Latin America Aquaculture Market, by Country, 2018 - 2025 (USD Billion)
      3. 5.7.3. Latin America Market size and forecast, 2016-2026 (Kilo Tons)
      4. 5.7.4. Latin America Aquaculture Market, by Country, 2018 - 2025 (Kilo Tons)
      5. 5.7.5. Latin America Aquaculture Market, by Product Type, 2016-2026
        1. 5.7.5.1. Latin America Aquaculture Market, by Product Type, 2016-2026 (USD Billion)
        2. 5.7.5.2. Latin America Aquaculture Market, by Product Type, 2016-2026 (Kilo Tons)
      6. 5.7.6. Latin America Aquaculture Market, by Culture Environment, 2016-2026
        1. 5.7.6.1. Latin America Aquaculture Market, by Culture Environment, 2016-2026 (USD Billion)
        2. 5.7.6.2. Latin America Aquaculture Market, by Culture Environment, 2016-2026 (Kilo Tons)
      7. 5.7.7. Latin America Aquaculture Market, by Channel, 2016-2026
        1. 5.7.7.1. Latin America Aquaculture Market, by Channel, 2016-2026 (USD Billion)
        2. 5.7.7.2. Latin America Aquaculture Market, by Channel, 2016-2026 (Kilo Tons)
      8. 5.7.8. Brazil
        1. 5.7.8.1. Brazil Market size and forecast, 2016-2026 (USD Billion)
        2. 5.7.8.2. Brazil Market size and forecast, 2016-2026 (Kilo Tons)
      9. 5.7.9. Mexico
        1. 5.7.9.1. Mexico Market size and forecast, 2016-2026 (USD Billion)
        2. 5.7.9.2. Mexico Market size and forecast, 2016-2026 (Kilo Tons)
      10. 5.7.10. Rest of Latin America
        1. 5.7.10.1. Rest of Latin America Market size and forecast, 2016-2026 (USD Billion)
        2. 5.7.10.2. Rest of Latin America Market size and forecast, 2016-2026 (Kilo Tons)
    8. 5.8. The Middle-East and Africa
      1. 5.8.1. The Middle-East and Africa Aquaculture Market size and forecast, 2016-2026
      2. 5.8.2. The Middle-East and Africa Aquaculture Market, by Country, 2018 - 2025 (USD Billion)
      3. 5.8.3. The Middle-East and Africa Market size and forecast, 2016-2026 (Kilo Tons)
      4. 5.8.4. The Middle-East and Africa Aquaculture Market, by Country, 2018 - 2025 (Kilo Tons)
      5. 5.8.5. The Middle-East and Africa Aquaculture Market, by Product Type, 2016-2026
        1. 5.8.5.1. The Middle-East and Africa Aquaculture Market, by Product Type, 2016-2026 (USD Billion)
        2. 5.8.5.2. The Middle-East and Africa Aquaculture Market, by Product Type, 2016-2026 (Kilo Tons)
      6. 5.8.6. The Middle-East and Africa Aquaculture Market, by Culture Environment, 2016-2026
        1. 5.8.6.1. The Middle-East and Africa Aquaculture Market, by Culture Environment, 2016-2026 (USD Billion)
        2. 5.8.6.2. The Middle-East and Africa Aquaculture Market, by Culture Environment, 2016-2026 (Kilo Tons)
      7. 5.8.7. The Middle-East and Africa Aquaculture Market, by Channel, 2016-2026
        1. 5.8.7.1. The Middle-East and Africa Aquaculture Market, by Channel, 2016-2026 (USD Billion)
        2. 5.8.7.2. The Middle-East and Africa Aquaculture Market, by Channel, 2016-2026 (Kilo Tons)
      8. 5.8.8. GCC Countries
        1. 5.8.8.1. GCC Countries Market size and forecast, 2016-2026 (USD Billion)
        2. 5.8.8.2. GCC Countries Market size and forecast, 2016-2026 (Kilo Tons)
      9. 5.8.9. South Africa
        1. 5.8.9.1. South Africa Market size and forecast, 2016-2026 (USD Billion)
        2. 5.8.9.2. South Africa Market size and forecast, 2016-2026 (Kilo Tons)
      10. 5.8.10. Rest of Middle-East Africa
        1. 5.8.10.1. Rest of Middle-East Africa Market size and forecast, 2016-2026 (USD Billion)
        2. 5.8.10.2. Rest of Middle-East Africa Market size and forecast, 2016-2026 (Kilo Tons)
  6. CHAPTER 6. Aquaculture Production, Consumption, Export, Import by Regions
    1. 6.1. Global Aquaculture production and revenue, 2015-2025 (USD Billion) (Kilo Tons)
    2. 6.2. Global Import and Export Analysis, by Region
  7. CHAPTER 7. Aquaculture market – Competitive Landscape
    1. 7.1. Competitor Market Share – Revenue
    2. 7.2. Market Concentration Rate Analysis, Top 3 and Top 5 Players
    3. 7.3. Competitor Market Share – Volume
    4. 7.4. Strategic Development
      1. 7.4.1. Acquisitions and Mergers
      2. 7.4.2. New Products
      3. 7.4.3. Research & Development Activities
  8. CHAPTER 8. Company Profiles
    1. 8.1. Nippon Suisan Kaisha Ltd,
      1. 8.1.1. Company Overview
      2. 8.1.2. Nippon Suisan Kaisha Ltd, Sales, Revenue, Price, and Gross Margin
      3. 8.1.3. Product portfolio
      4. 8.1.4. Recent initiatives
    2. 8.2. MOWI ASA, SalMar ASA,
      1. 8.2.1. Company Overview
      2. 8.2.2. MOWI ASA, SalMar ASA, Sales, Revenue, Price, and Gross Margin
      3. 8.2.3. Product portfolio
      4. 8.2.4. Recent initiatives
    3. 8.3. Cooke Aquaculture Inc.,
      1. 8.3.1. Company Overview
      2. 8.3.2. Cooke Aquaculture Inc., Sales, Revenue, Price, and Gross Margin
      3. 8.3.3. Product portfolio
      4. 8.3.4. Recent initiatives
    4. 8.4. Austevoll Seafood ASA,
      1. 8.4.1. Company Overview
      2. 8.4.2. Austevoll Seafood ASA, Sales, Revenue, Price, and Gross Margin
      3. 8.4.3. Product portfolio
      4. 8.4.4. Recent initiatives
    5. 8.5. Norway Royal Salmon ASA,
      1. 8.5.1. Company Overview
      2. 8.5.2. Norway Royal Salmon ASA, Sales, Revenue, Price, and Gross Margin
      3. 8.5.3. Product portfolio
      4. 8.5.4. Recent initiatives
    6. 8.6. Campania Pesquera,
      1. 8.6.1. Company Overview
      2. 8.6.2. Campania Pesquera, Sales, Revenue, Price, and Gross Margin
      3. 8.6.3. Product portfolio
      4. 8.6.4. Recent initiatives
    7. 8.7. Tassal Group Ltd,
      1. 8.7.1. Company Overview
      2. 8.7.2. Tassal Group Ltd, Sales, Revenue, Price, and Gross Margin
      3. 8.7.3. Product portfolio
      4. 8.7.4. Recent initiatives
    8. 8.8. Multiexport Foods SA,
      1. 8.8.1. Company Overview
      2. 8.8.2. Multiexport Foods SA, Sales, Revenue, Price, and Gross Margin
      3. 8.8.3. Product portfolio
      4. 8.8.4. Recent initiatives
    9. 8.9. Dainichi Corporation,
      1. 8.9.1. Company Overview
      2. 8.9.2. Dainichi Corporation, Sales, Revenue, Price, and Gross Margin
      3. 8.9.3. Product portfolio
      4. 8.9.4. Recent initiatives
    10. 8.10. Camanchaca SA,
      1. 8.10.1. Company Overview
      2. 8.10.2. Camanchaca SA, Sales, Revenue, Price, and Gross Margin
      3. 8.10.3. Product portfolio
      4. 8.10.4. Recent initiatives
    11. 8.11. P/F Bakkafrost,
      1. 8.11.1. Company Overview
      2. 8.11.2. P/F Bakkafrost, Sales, Revenue, Price, and Gross Margin
      3. 8.11.3. Product portfolio
      4. 8.11.4. Recent initiatives
    12. 8.12. Nireus SA,
      1. 8.12.1. Company Overview
      2. 8.12.2. Nireus SA, Sales, Revenue, Price, and Gross Margin
      3. 8.12.3. Product portfolio
      4. 8.12.4. Recent initiatives
    13. 8.13. Stoly Sea Farm SA,
      1. 8.13.1. Company Overview
      2. 8.13.2. Stoly Sea Farm SA, Sales, Revenue, Price, and Gross Margin
      3. 8.13.3. Product portfolio
      4. 8.13.4. Recent initiatives
    14. 8.14. Tongwei Group Co. Ltd.,
      1. 8.14.1. Company Overview
      2. 8.14.2. Tongwei Group Co. Ltd., Sales, Revenue, Price, and Gross Margin
      3. 8.14.3. Product portfolio
      4. 8.14.4. Recent initiatives
    15. 8.15. Kyokuyo Co. Ltd.,
      1. 8.15.1. Company Overview
      2. 8.15.2. Kyokuyo Co. Ltd., Sales, Revenue, Price, and Gross Margin
      3. 8.15.3. Product portfolio
      4. 8.15.4. Recent initiatives
    16. 8.16. Surapon Foods Public Company Limited,
      1. 8.16.1. Company Overview
      2. 8.16.2. Surapon Foods Public Company Limited, Sales, Revenue, Price, and Gross Margin
      3. 8.16.3. Product portfolio
      4. 8.16.4. Recent initiatives
    17. 8.17. Thai Union Group PCL,
      1. 8.17.1. Company Overview
      2. 8.17.2. Thai Union Group PCL, Sales, Revenue, Price, and Gross Margin
      3. 8.17.3. Product portfolio
      4. 8.17.4. Recent initiatives
    18. 8.18. Maruha Nichiro Corporation,
      1. 8.18.1. Company Overview
      2. 8.18.2. Maruha Nichiro Corporation, Sales, Revenue, Price, and Gross Margin
      3. 8.18.3. Product portfolio
      4. 8.18.4. Recent initiatives
    19. 8.19. others
      1. 8.19.1. Company Overview
      2. 8.19.2. others Sales, Revenue, Price, and Gross Margin
      3. 8.19.3. Product portfolio
      4. 8.19.4. Recent initiatives
  9. CHAPTER 9. Aquaculture — Industry Analysis
    1. 9.1. Introduction and Taxonomy
    2. 9.2. Aquaculture Market – Key Trends
      1. 9.2.1. Market Drivers
      2. 9.2.2. Market Restraints
      3. 9.2.3. Market Opportunities
    3. 9.3. Value Chain Analysis
    4. 9.4. Key Mandates and Regulations
    5. 9.5. Technology Roadmap and Timeline
    6. 9.6. Aquaculture market – Attractiveness Analysis
      1. 9.6.1. By Product Type
      2. 9.6.2. By Culture Environment
      3. 9.6.3. By Channel
      4. 9.6.4. By Region
  10. CHAPTER 10. Raw Material analysis
    1. 10.1. Aquaculture Key Raw Material Analysis
      1. 10.1.1. Key Raw Materials
      2. 10.1.2. Price Trend of Key Raw Materials
    2. 10.2. Key Suppliers of Raw Materials
    3. 10.3. Proportion of Manufacturing Cost Structure
      1. 10.3.1. Raw Materials
      2. 10.3.2. Labor Cost
    4. 10.4. Manufacturing Expenses Analysis of Aquaculture
  11. CHAPTER 11. Industrial Chain, Sourcing Strategy and Downstream Buyers
    1. 11.1. Aquaculture Industrial Chain Analysis
    2. 11.2. Upstream Raw Materials Sourcing
      1. 11.2.1. Risk Mitigation:
      2. 11.2.2. Supplier Relationships:
      3. 11.2.3. Business Processes:
      4. 11.2.4. Securing the Product:
    3. 11.3. Raw Materials Sources of Aquaculture Major Manufacturers in 2016
    4. 11.4. Downstream Buyers
    5. 11.5. Distributors/Traders List
  12. CHAPTER 12. Marketing Strategy Analysis, Distributors
    1. 12.1. Marketing Channel
    2. 12.2. Direct Marketing
    3. 12.3. Indirect Marketing
    4. 12.4. Marketing Channel Development Trend
    5. 12.5. Economic/Political Environmental Change
  13. CHAPTER 13. Report Conclusion
  14. CHAPTER 14. Research Approach & Methodology
    1. 14.1. Report Description
    2. 14.2. Research Scope
    3. 14.3. Research Methodology
      1. 14.3.1. Secondary Research
      2. 14.3.2. Primary Research
      3. 14.3.3. Models
        1. 14.3.3.1. Company Share Analysis Model
        2. 14.3.3.2. Revenue Based Modeling
        3. 14.3.3.3. Research Limitations

        List of Figures

        FIG. 1 Global Aquaculture Market, 2016-2026 (USD Billion)
        FIG. 2 Global Aquaculture Market Share, by Product Type, 2018 & 2025 (USD Billion)
        FIG. 3 Global Aquaculture Market share, by Product Type, 2018 & 2025 (Kilo Tons)
        FIG. 4 Global Carps Aquaculture Market, 2016-2026 (USD Billion)
        FIG. 5 Global Carps Aquaculture  Market, 2016-2026 (Kilo Tons)
        FIG. 6 Global Crustaceans Aquaculture Market, 2016-2026 (USD Billion)
        FIG. 7 Global Crustaceans Aquaculture  Market, 2016-2026 (Kilo Tons)
        FIG. 8 Global Mackerel Aquaculture Market, 2016-2026 (USD Billion)
        FIG. 9 Global Mackerel Aquaculture  Market, 2016-2026 (Kilo Tons)
        FIG. 10 Global Mollusca Aquaculture Market, 2016-2026 (USD Billion)
        FIG. 11 Global Mollusca Aquaculture  Market, 2016-2026 (Kilo Tons)
        FIG. 12 Global Salmon Aquaculture Market, 2016-2026 (USD Billion)
        FIG. 13 Global Salmon Aquaculture  Market, 2016-2026 (Kilo Tons)
        FIG. 14 Global Trout Aquaculture Market, 2016-2026 (USD Billion)
        FIG. 15 Global Trout Aquaculture  Market, 2016-2026 (Kilo Tons)
        FIG. 16 Global Others Aquaculture Market, 2016-2026 (USD Billion)
        FIG. 17 Global Others Aquaculture  Market, 2016-2026 (Kilo Tons)
        FIG. 18 Global Aquaculture Market Share, by Culture Environment, 2018 & 2025 (USD Billion)
        FIG. 19 Global Aquaculture Market share, by Culture Environment, 2018 & 2025 (Kilo Tons)
        FIG. 20 Global Fresh Water Aquaculture Market, 2016-2026 (USD Billion)
        FIG. 21 Global Fresh Water Aquaculture  Market, 2016-2026 (Kilo Tons)
        FIG. 22 Global Marine Water Aquaculture Market, 2016-2026 (USD Billion)
        FIG. 23 Global Marine Water Aquaculture  Market, 2016-2026 (Kilo Tons)
        FIG. 24 Global Brackish Water Aquaculture Market, 2016-2026 (USD Billion)
        FIG. 25 Global Brackish Water Aquaculture  Market, 2016-2026 (Kilo Tons)
        FIG. 26 Global Aquaculture Market Share, by Channel, 2018 & 2025 (USD Billion)
        FIG. 27 Global Aquaculture Market share, by Channel, 2018 & 2025 (Kilo Tons)
        FIG. 28 Global Direct Sales Aquaculture Market, 2016-2026 (USD Billion)
        FIG. 29 Global Direct Sales Aquaculture  Market, 2016-2026 (Kilo Tons)
        FIG. 30 Global Distributor Aquaculture Market, 2016-2026 (USD Billion)
        FIG. 31 Global Distributor Aquaculture  Market, 2016-2026 (Kilo Tons)
        FIG. 32 Global Aquaculture Market Share, by Region, 2018 & 2025
        FIG. 33 Global Aquaculture Market Share, by Region, 2018 & 2025
        FIG. 34 North America Aquaculture Market, 2016-2026
        FIG. 35 North America Aquaculture  Market, 2016-2026 (Kilo Tons)
        FIG. 36 U.S. Aquaculture Market, 2016-2026
        FIG. 37 U.S. Aquaculture  Market, 2016-2026 (Kilo Tons)
        FIG. 38 Canada Aquaculture Market, 2016-2026
        FIG. 39 Canada Aquaculture  Market, 2016-2026 (Kilo Tons)
        FIG. 40 Europe Aquaculture Market, 2016-2026
        FIG. 41 Europe Aquaculture  Market, 2016-2026 (Kilo Tons)
        FIG. 42 Germany Aquaculture Market, 2016-2026
        FIG. 43 Germany Aquaculture  Market, 2016-2026 (Kilo Tons)
        FIG. 44 France Aquaculture Market, 2016-2026
        FIG. 45 France Aquaculture  Market, 2016-2026 (Kilo Tons)
        FIG. 46 U.K. Aquaculture Market, 2016-2026
        FIG. 47 U.K. Aquaculture  Market, 2016-2026 (Kilo Tons)
        FIG. 48 Italy Aquaculture Market, 2016-2026
        FIG. 49 Italy Aquaculture  Market, 2016-2026 (Kilo Tons)
        FIG. 50 Spain Aquaculture Market, 2016-2026
        FIG. 51 Spain Aquaculture  Market, 2016-2026 (Kilo Tons)
        FIG. 52 Rest of Europe Aquaculture Market, 2016-2026
        FIG. 53 Rest of Europe Aquaculture  Market, 2016-2026 (Kilo Tons)
        FIG. 54 Asia Pacific Aquaculture Market, 2016-2026
        FIG. 55 Asia Pacific Aquaculture  Market, 2016-2026 (Kilo Tons)
        FIG. 56 China Aquaculture Market, 2016-2026
        FIG. 57 China Aquaculture  Market, 2016-2026 (Kilo Tons)
        FIG. 58 Japan Aquaculture Market, 2016-2026
        FIG. 59 Japan Aquaculture  Market, 2016-2026 (Kilo Tons)
        FIG. 60 India Aquaculture Market, 2016-2026
        FIG. 61 India Aquaculture  Market, 2016-2026 (Kilo Tons)
        FIG. 62 South  Korea Aquaculture Market, 2016-2026
        FIG. 63 South  Korea Aquaculture  Market, 2016-2026 (Kilo Tons)
        FIG. 64 South-East Asia Aquaculture Market, 2016-2026
        FIG. 65 South-East Asia Aquaculture  Market, 2016-2026 (Kilo Tons)
        FIG. 66 Rest of Asia Pacific Aquaculture Market, 2016-2026
        FIG. 67 Rest of Asia Pacific Aquaculture  Market, 2016-2026 (Kilo Tons)
        FIG. 68 Latin America Aquaculture Market, 2016-2026
        FIG. 69 Latin America Aquaculture  Market, 2016-2026 (Kilo Tons)
        FIG. 70 Brazil Aquaculture Market, 2016-2026
        FIG. 71 Brazil Aquaculture  Market, 2016-2026 (Kilo Tons)
        FIG. 72 Mexico Aquaculture Market, 2016-2026
        FIG. 73 Mexico Aquaculture  Market, 2016-2026 (Kilo Tons)
        FIG. 74 Rest of Latin America Aquaculture Market, 2016-2026
        FIG. 75 Rest of Latin America Aquaculture  Market, 2016-2026 (Kilo Tons)
        FIG. 76 The Middle-East and Africa Aquaculture Market, 2016-2026
        FIG. 77 The Middle-East and Africa Aquaculture  Market, 2016-2026 (Kilo Tons)
        FIG. 78 GCC Countries Aquaculture Market, 2016-2026
        FIG. 79 GCC Countries Aquaculture  Market, 2016-2026 (Kilo Tons)
        FIG. 80 South Africa Aquaculture Market, 2016-2026
        FIG. 81 South Africa Aquaculture  Market, 2016-2026 (Kilo Tons)
        FIG. 82 Rest of Middle-East Africa Aquaculture Market, 2016-2026
        FIG. 83 Rest of Middle-East Africa Aquaculture  Market, 2016-2026 (Kilo Tons)
        FIG. 84 Global Aquaculture production and revenue, 2015-2025 (USD Billion) (Kilo Tons)
        FIG. 85 North America Aquaculture production and revenue, 2015-2025 (USD Billion) (Kilo Tons)
        FIG. 86 Europe Aquaculture production and revenue, 2015-2025 (USD Billion) (Kilo Tons)
        FIG. 87 Asia Pacific Aquaculture production and revenue, 2015-2025 (USD Billion) (Kilo Tons)
        FIG. 88 Latin America Aquaculture production and revenue, 2015-2025 (USD Billion) (Kilo Tons)
        FIG. 89 Middle East and Africa Aquaculture production and revenue, 2015-2025 (USD Billion) (Kilo Tons)
        FIG. 90 Competitor Market Share – Revenue
        FIG. 91 Competitor Market Share – Volume
        FIG. 92 Nippon Suisan Kaisha Ltd, Revenue and Growth Rate
        FIG. 93 Nippon Suisan Kaisha Ltd, Market Share
        FIG. 94 MOWI ASA, SalMar ASA, Revenue and Growth Rate
        FIG. 95 MOWI ASA, SalMar ASA, Market Share
        FIG. 96 Cooke Aquaculture Inc., Revenue and Growth Rate
        FIG. 97 Cooke Aquaculture Inc., Market Share
        FIG. 98 Austevoll Seafood ASA, Revenue and Growth Rate
        FIG. 99 Austevoll Seafood ASA, Market Share
        FIG. 100 Norway Royal Salmon ASA, Revenue and Growth Rate
        FIG. 101 Norway Royal Salmon ASA, Market Share
        FIG. 102 Campania Pesquera, Revenue and Growth Rate
        FIG. 103 Campania Pesquera, Market Share
        FIG. 104 Tassal Group Ltd, Revenue and Growth Rate
        FIG. 105 Tassal Group Ltd, Market Share
        FIG. 106 Multiexport Foods SA, Revenue and Growth Rate
        FIG. 107 Multiexport Foods SA, Market Share
        FIG. 108 Dainichi Corporation, Revenue and Growth Rate
        FIG. 109 Dainichi Corporation, Market Share
        FIG. 110 Camanchaca SA, Revenue and Growth Rate
        FIG. 111 Camanchaca SA, Market Share
        FIG. 112 P/F Bakkafrost, Revenue and Growth Rate
        FIG. 113 P/F Bakkafrost, Market Share
        FIG. 114 Nireus SA, Revenue and Growth Rate
        FIG. 115 Nireus SA, Market Share
        FIG. 116 Stoly Sea Farm SA, Revenue and Growth Rate
        FIG. 117 Stoly Sea Farm SA, Market Share
        FIG. 118 Tongwei Group Co. Ltd., Revenue and Growth Rate
        FIG. 119 Tongwei Group Co. Ltd., Market Share
        FIG. 120 Kyokuyo Co. Ltd., Revenue and Growth Rate
        FIG. 121 Kyokuyo Co. Ltd., Market Share
        FIG. 122 Surapon Foods Public Company Limited, Revenue and Growth Rate
        FIG. 123 Surapon Foods Public Company Limited, Market Share
        FIG. 124 Thai Union Group PCL, Revenue and Growth Rate
        FIG. 125 Thai Union Group PCL, Market Share
        FIG. 126 Maruha Nichiro Corporation, Revenue and Growth Rate
        FIG. 127 Maruha Nichiro Corporation, Market Share
        FIG. 128 others Revenue and Growth Rate
        FIG. 129 others Market Share
        FIG. 130 Market Dynamics
        FIG. 131 Global Aquaculture – Value Chain Analysis
        FIG. 132 Key Mandates and Regulations
        FIG. 133 Technology Roadmap and Timeline
        FIG. 134 Market Attractiveness Analysis – By Product Type
        FIG. 135 Market Attractiveness Analysis – By Culture Environment
        FIG. 136 Market Attractiveness Analysis – By Channel
        FIG. 137 Market Attractiveness Analysis – By Region
        FIG. 138 Manufacturing Cost Structure of Aquaculture
        FIG. 139 Aquaculture Industrial Chain Analysis
        FIG. 140 Market Channel
        FIG. 141 Marketing Channel Development Trend
        FIG. 142 Growth in World Gross Product, 2008-2018
        

        List of Tables

        TABLE 1 Global Aquaculture market, 2018 & 2025 (USD Billion)
        TABLE 2 Global Aquaculture market, by Product Type, 2016-2026 (USD Billion)
        TABLE 3 Global Aquaculture market, by Product Type, 2016-2026 (Kilo Tons)
        TABLE 4 Global Aquaculture market, by Culture Environment, 2016-2026 (USD Billion)
        TABLE 5 Global Aquaculture market, by Culture Environment, 2016-2026 (Kilo Tons)
        TABLE 6 Global Aquaculture market, by Channel, 2016-2026 (USD Billion)
        TABLE 7 Global Aquaculture market, by Channel, 2016-2026 (Kilo Tons)
        TABLE 8 Global Aquaculture market, by region, 2016-2026 (USD Billion)
        TABLE 9 Global Aquaculture market, by region, 2016-2026 (Kilo Tons)
        TABLE 10 North America Aquaculture Market, by Product Type, 2016-2026 (USD Billion)
        TABLE 11 North America Aquaculture Market, by Product Type, 2016-2026 (Kilo Tons)
        TABLE 12 North America Aquaculture Market, by Culture Environment, 2016-2026 (USD Billion)
        TABLE 13 North America Aquaculture Market, by Culture Environment, 2016-2026 (Kilo Tons)
        TABLE 14 North America Aquaculture Market, by Channel, 2016-2026 (USD Billion)
        TABLE 15 North America Aquaculture Market, by Channel, 2016-2026 (Kilo Tons)
        TABLE 16 Europe Aquaculture Market, by Product Type, 2016-2026 (USD Billion)
        TABLE 17 Europe Aquaculture Market, by Product Type, 2016-2026 (Kilo Tons)
        TABLE 18 Europe Aquaculture Market, by Culture Environment, 2016-2026 (USD Billion)
        TABLE 19 Europe Aquaculture Market, by Culture Environment, 2016-2026 (Kilo Tons)
        TABLE 20 Europe Aquaculture Market, by Channel, 2016-2026 (USD Billion)
        TABLE 21 Europe Aquaculture Market, by Channel, 2016-2026 (Kilo Tons)
        TABLE 22 Asia Pacific Aquaculture Market, by Product Type, 2016-2026 (USD Billion)
        TABLE 23 Asia Pacific Aquaculture Market, by Product Type, 2016-2026 (Kilo Tons)
        TABLE 24 Asia Pacific Aquaculture Market, by Culture Environment, 2016-2026 (USD Billion)
        TABLE 25 Asia Pacific Aquaculture Market, by Culture Environment, 2016-2026 (Kilo Tons)
        TABLE 26 Asia Pacific Aquaculture Market, by Channel, 2016-2026 (USD Billion)
        TABLE 27 Asia Pacific Aquaculture Market, by Channel, 2016-2026 (Kilo Tons)
        TABLE 28 Latin America Aquaculture Market, by Product Type, 2016-2026 (USD Billion)
        TABLE 29 Latin America Aquaculture Market, by Product Type, 2016-2026 (Kilo Tons)
        TABLE 30 Latin America Aquaculture Market, by Culture Environment, 2016-2026 (USD Billion)
        TABLE 31 Latin America Aquaculture Market, by Culture Environment, 2016-2026 (Kilo Tons)
        TABLE 32 Latin America Aquaculture Market, by Channel, 2016-2026 (USD Billion)
        TABLE 33 Latin America Aquaculture Market, by Channel, 2016-2026 (Kilo Tons)
        TABLE 34 The Middle-East and Africa Aquaculture Market, by Product Type, 2016-2026 (USD Billion)
        TABLE 35 The Middle-East and Africa Aquaculture Market, by Product Type, 2016-2026 (Kilo Tons)
        TABLE 36 The Middle-East and Africa Aquaculture Market, by Culture Environment, 2016-2026 (USD Billion)
        TABLE 37 The Middle-East and Africa Aquaculture Market, by Culture Environment, 2016-2026 (Kilo Tons)
        TABLE 38 The Middle-East and Africa Aquaculture Market, by Channel, 2016-2026 (USD Billion)
        TABLE 39 The Middle-East and Africa Aquaculture Market, by Channel, 2016-2026 (Kilo Tons)
        TABLE 40 North America Aquaculture Production, Consumption, Export, Import, 2016-2019
        TABLE 41 Europe Aquaculture Production, Consumption, Export, Import, 2016-2019
        TABLE 42 Asia Pacific Aquaculture Production, Consumption, Export, Import, 2016-2019
        TABLE 43 Latin America Aquaculture Production, Consumption, Export, Import, 2016-2019
        TABLE 44 Middle East & Africa Aquaculture Production, Consumption, Export, Import, 2016-2019
        TABLE 45 Global Aquaculture Market - Company Revenue Analysis 2016-2019 (USD Billion)
        TABLE 46 Global Aquaculture Market - Company Revenue Share Analysis 2016-2019(%)
        TABLE 47 Global Aquaculture Market - Company Volume Analysis 2016-2019 (Kilo Tons)
        TABLE 48 Global Aquaculture Market - Company Volume Share Analysis 2016-2019(%)
        TABLE 49 Acquisitions and Mergers
        TABLE 50 New Product/Service Launch
        TABLE 51 Research & Development Activities
        TABLE 52 Market Drivers
        TABLE 53 Market Restraints
        TABLE 54 Market Opportunities
        TABLE 55 Production Base and Market Concentration Rate of Raw Material
        TABLE 56 Key Suppliers of Raw Materials
        TABLE 57 Raw Materials Sources of Aquaculture Major Manufacturers in 2016
        TABLE 58 Major Buyers of Aquaculture
        TABLE 59 Distributors/Traders of Aquaculture by Region

Industry Major Market Players

  •  Nippon Suisan Kaisha Ltd
  •  MOWI ASA
  •  SalMar ASA
  •  Cooke Aquaculture Inc.
  •  Austevoll Seafood ASA
  •  Norway Royal Salmon ASA
  •  Campania Pesquera
  •  Tassal Group Ltd
  •  Multiexport Foods SA
  •  Dainichi Corporation
  •  Camanchaca SA
  •  P/F Bakkafrost
  •  Nireus SA
  •  Stoly Sea Farm SA
  •  Tongwei Group Co. Ltd.
  •  Kyokuyo Co. Ltd.
  •  Surapon Foods Public Company Limited
  •  Thai Union Group PCL
  •  Maruha Nichiro Corporation