Search Market Research Report

Discover Our Latest Reports
Discover Our Featured Reports
Discover Top Selling Reports

Antithrombin Market Size, Share, Growth Report 2026

report img

Antithrombin Market By Source (Human, Goat Milk, & Others), By Application (Therapeutics, Diagnostics, Research, & Others), By Dosage Form (Lyophilized & Liquid), By Route (Oral & Parental), And By Regions - Global & Regional Industry Perspective, Comprehensive Analysis, and Forecast, 2021 - 2026

Industry Insights

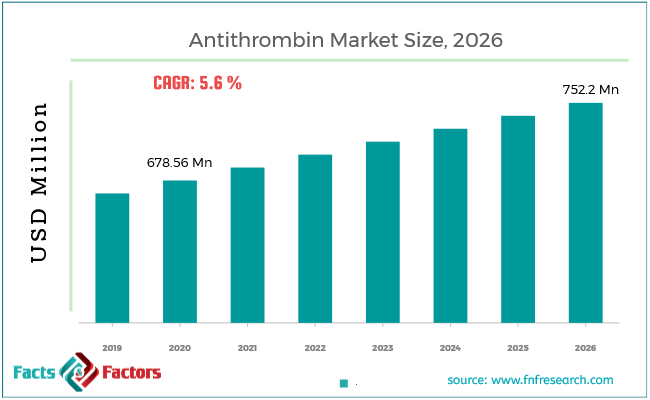
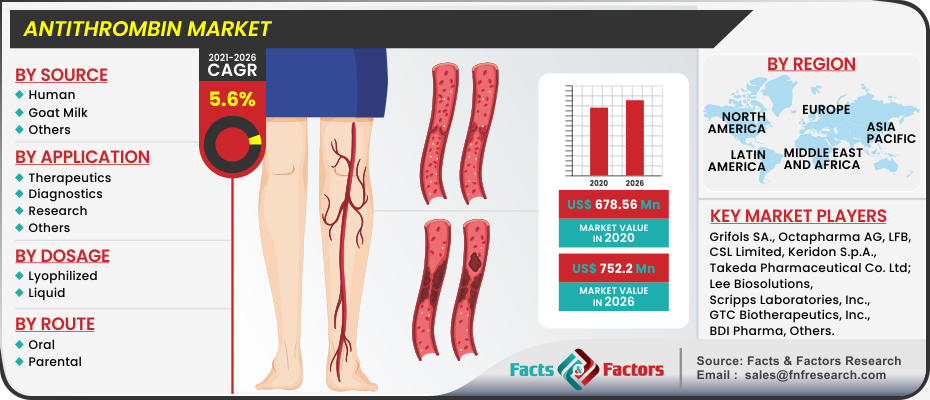
[196+ Pages Report] The latest market study titled “Antithrombin (AT) Market” aims to bring to the notice of the readers that this report covers a completely comprehensive and extensive overview of the market from both the global and regional perspectives. We at Facts and Factors interpolate that the market value for the global Antithrombin Market was projected to be around USD 678.56 Million in the year 2020 and is expected to grow with a CAGR value of 5.6% to push the market at a forecast value of USD 752.2 Million by the end of the year 2026.

Antithrombin Market Size

To know more about this report | Request Free Sample Copy

logoMarket Overview

Antithrombin (AT) is a protein bonded in the human body which plays a pivotal role in decreasing the chances of blood clots as it intervenes as a natural blood thinner. AT is used in surgical procedures at an extensive pace for its natural ability to prevent blood clots. Antithrombin is a natural glycoprotein that is produced by the liver and consists of a range of 432 amino acids and further contains three disulfide bonds alongside four possible glycosylation sites. Recent studies have concluded that deficiency of antithrombin in the human body often leads to excessive bleeding disorders which can prove to be fatal in case of late detection.

logoIndustry Growth Factors

The driving forces behind the growth related to the growing prevalence of disorders include sepsis, congenital antithrombin deficiency, disseminated intravascular coagulation (DIC), and extracorporeal membrane oxygenation (EMCO) coupled with a rising trend of open-heart surgeries. Furthermore, thrombotic diseases often require a longer base of treatment, and thus, there is an increase in the sale of antithrombin drugs which later add to the growth of the antithrombin market. Additionally, the increased usage of rapid diagnostic testing boosts the market value of the antithrombin market during the forecast period.

The rising prevalence of people suffering from antithrombin deficiency and increased usage of antithrombin during cardiac surgeries will further open new revenue opportunities for the market. An increase in genetically identifiable thrombophilia will further boost the sales of the antithrombin market. Increased functionality of antithrombin drugs has prompted the integration of the latter during phase 2 and phase 3 drug trials for a range of blood clotting disorders. Moreover, increasing applications of biologics and the high initial cost of antithrombin drugs will hamper the growth of the market to a certain extent.

Antithrombin Market

To know more about this report | Request Free Sample Copy

logoSegmentation Analysis

The global antithrombin market can be segmented on the basis of source, application, dosage form, route, and region.

On the basis of source, the global antithrombin market can be divided into human, goat milk, and others. The goat milk segment is expected to witness the largest market share during the forecast due to easy availability, cost-effectiveness, and proven clinical efficacy. On the basis of application, the global antithrombin market can be fragmented into therapeutics, diagnostics, research, and others. The therapeutics segment is expected to witness the largest market share during the forecast in terms of global revenue collection. Factors pertaining to the dominant position can be contributed to the increasing prevalence of antithrombin deficiency and the increasing cases of bleeding during surgical procedures.

Additional factors include growing surgical requirements and the rising prevalence of antithrombin deficiencies such as nephrotic syndrome, liver failure, and severe burns associated with the aftermath. On the basis of dosage form, the global antithrombin market can be broken down into lyophilized and liquid. The lyophilized segment is expected to witness the largest market share during the forecast period. On the basis of the route, the global antithrombin market can be segmented into oral and parental. The oral segment will account for the largest market share due to easy application and access to the human anatomy.

logo Regional Analysis

Asia-Pacific is expected to witness the largest market share during the forecast period owing to global revenue collection. The presence of emerging economies like China and India in the region contributing heavily to the market will establish a strong foothold for the antithrombin market. Additional factors for the dominant position of the market in the region can be contributed to increasing in non-refundable income among consumers and widened spending power on healthcare. Moreover, ongoing studies reveal that the occurrence of venous thromboembolism (VTE) in the Asian population is less than in the Western hemisphere. Rising awareness among patients will further boost the sales of antithrombin drug volume during the forecast.

logoReport Scope

Report Attribute

Details

Market Size in 2020

USD 678.56 Million

Projected Market Size in 2026

USD 752.2 Million

CAGR Growth Rate

5.6% CAGR

Base Year

2020

Forecast Years

2021-2026

Key Market Players

Grifols SA., Octapharma AG, LFB, CSL Limited, Takeda Pharmaceutical Company Limited, Keridon S.p.A., Lee Biosolutions, Scripps Laboratories, Inc., GTC Biotherapeutics, Inc., and BDI Pharma, among others.

Key Segment

By Source, By Application, By Dosage Form, By Region

Major Regions Covered

North America, Europe, Asia Pacific, Latin America, and the Middle East & Africa

Purchase Options

Request customized purchase options to meet your research needs. Explore purchase options

logo Competitive Players

The global competitive players in the global antithrombin market are

  • Grifols SA.
  • Octapharma AG
  • LFB
  • CSL Limited
  • Takeda Pharmaceutical Company Limited
  • Keridon S.p.A.
  • Lee Biosolutions
  • Scripps Laboratories Inc.
  • GTC Biotherapeutics Inc.
  • BDI Pharma
  • among others

logo By Source Segment Analysis

  • Human
  • Goat Milk
  • Others

logo By Application Segment Analysis

  • Therapeutics
  • Diagnostics
  • Research
  • Others

logo By Dosage Form Segment Analysis

  • Lyophilized
  • Liquid

logo By Route Segment Analysis

  • Oral
  • Parental

logo By Regional Segment Analysis

  • North America
    • U.S.
    • Canada
  • Europe
    • UK
    • France
    • Germany
    • Italy
    • Spain
    • Rest of Europe
  • Asia Pacific
    • China
    • Japan
    • India
    • South Korea
    • Southeast Asia
    • Rest of Asia Pacific
  • Latin America
    • Brazil
    • Mexico
    • Rest of Latin America
  • Middle East and Africa
    • GCC Countries
    • South Africa
    • Rest of MEA

Table of Content

  1. Chapter 1 Executive Summary
    1. 1.1. Introduction of Antithrombin
    2. 1.2. Global Antithrombin Market, 2020 & 2026 (USD Million)
    3. 1.3. Global Antithrombin Market, 2016 – 2026 (USD Million)
    4. 1.4. Global Antithrombin Market Absolute Revenue Opportunity, 2016 – 2026 (USD Million)
    5. 1.5. Global Antithrombin Market Incremental Revenue Opportunity, 2020 – 2026 (USD Million)
  2. Chapter 2 Antithrombin Market – Source Analysis
    1. 2.1. Global Antithrombin Market – Source Overview
    2. 2.2. Global Antithrombin Market Share, by Source, 2020 & 2026 (USD Million)
    3. 2.3. Human
      1. 2.3.1. Global Human Antithrombin Market, 2016 – 2026 (USD Million)
    4. 2.4. Goat Milk
      1. 2.4.1. Global Goat Milk Antithrombin Market, 2016 – 2026 (USD Million)
    5. 2.5. Others
      1. 2.5.1. Global Others Antithrombin Market, 2016 – 2026 (USD Million)
  3. Chapter 3 Antithrombin Market – Application Analysis
    1. 3.1. Global Antithrombin Market – Application Overview
    2. 3.2. Global Antithrombin Market Share, by Application, 2020 & 2026 (USD Million)
    3. 3.3. Therapeutics
      1. 3.3.1. Global Therapeutics Antithrombin Market, 2016 – 2026 (USD Million)
    4. 3.4. Diagnostics
      1. 3.4.1. Global Diagnostics Antithrombin Market, 2016 – 2026 (USD Million)
    5. 3.5. Research
      1. 3.5.1. Global Research Antithrombin Market, 2016 – 2026 (USD Million)
    6. 3.6. Others
      1. 3.6.1. Global Others Antithrombin Market, 2016 – 2026 (USD Million)
  4. Chapter 4 Antithrombin Market – Dosage Form Analysis
    1. 4.1. Global Antithrombin Market – Dosage Form Overview
    2. 4.2. Global Antithrombin Market Share, by Dosage Form, 2020 & 2026 (USD Million)
    3. 4.3. Lyophilized
      1. 4.3.1. Global Lyophilized Antithrombin Market, 2016 – 2026 (USD Million)
    4. 4.4. Liquid
      1. 4.4.1. Global Liquid Antithrombin Market, 2016 – 2026 (USD Million)
  5. Chapter 5 Antithrombin Market – Route Analysis
    1. 5.1. Global Antithrombin Market – Route Overview
    2. 5.2. Global Antithrombin Market Share, by Route, 2020 & 2026 (USD Million)
    3. 5.3. Oral
      1. 5.3.1. Global Oral Antithrombin Market, 2016 – 2026 (USD Million)
    4. 5.4. Parental
      1. 5.4.1. Global Parental Antithrombin Market, 2016 – 2026 (USD Million)
  6. Chapter 6 Antithrombin Market – Regional Analysis
    1. 6.1. Global Antithrombin Market Regional Overview
    2. 6.2. Global Antithrombin Market Share, by Region, 2020 & 2026 (USD Million)
    3. 6.3. North America
      1. 6.3.1. North America Antithrombin Market, 2016 – 2026 (USD Million)
        1. 6.3.1.1. North America Antithrombin Market, by Country, 2016 - 2026 (USD Million)
      2. 6.3.2. North America Antithrombin Market, by Source, 2016 – 2026
        1. 6.3.2.1. North America Antithrombin Market, by Source, 2016 – 2026 (USD Million)
      3. 6.3.3. North America Antithrombin Market, by Application, 2016 – 2026
        1. 6.3.3.1. North America Antithrombin Market, by Application, 2016 – 2026 (USD Million)
      4. 6.3.4. North America Antithrombin Market, by Dosage Form, 2016 – 2026
        1. 6.3.4.1. North America Antithrombin Market, by Dosage Form, 2016 – 2026 (USD Million)
      5. 6.3.5. North America Antithrombin Market, by Route, 2016 – 2026
        1. 6.3.5.1. North America Antithrombin Market, by Route, 2016 – 2026 (USD Million)
      6. 6.3.6. U.S.
        1. 6.3.6.1. U.S. Antithrombin Market, 2016 – 2026 (USD Million)
      7. 6.3.7. Canada
        1. 6.3.7.1. Canada Antithrombin Market, 2016 – 2026 (USD Million)
    4. 6.4. Europe
      1. 6.4.1. Europe Antithrombin Market, 2016 – 2026 (USD Million)
        1. 6.4.1.1. Europe Antithrombin Market, by Country, 2016 - 2026 (USD Million)
      2. 6.4.2. Europe Antithrombin Market, by Source, 2016 – 2026
        1. 6.4.2.1. Europe Antithrombin Market, by Source, 2016 – 2026 (USD Million)
      3. 6.4.3. Europe Antithrombin Market, by Application, 2016 – 2026
        1. 6.4.3.1. Europe Antithrombin Market, by Application, 2016 – 2026 (USD Million)
      4. 6.4.4. Europe Antithrombin Market, by Dosage Form, 2016 – 2026
        1. 6.4.4.1. Europe Antithrombin Market, by Dosage Form, 2016 – 2026 (USD Million)
      5. 6.4.5. Europe Antithrombin Market, by Route, 2016 – 2026
        1. 6.4.5.1. Europe Antithrombin Market, by Route, 2016 – 2026 (USD Million)
      6. 6.4.6. Germany
        1. 6.4.6.1. Germany Antithrombin Market, 2016 – 2026 (USD Million)
      7. 6.4.7. France
        1. 6.4.7.1. France Antithrombin Market, 2016 – 2026 (USD Million)
      8. 6.4.8. U.K.
        1. 6.4.8.1. U.K. Antithrombin Market, 2016 – 2026 (USD Million)
      9. 6.4.9. Italy
        1. 6.4.9.1. Italy Antithrombin Market, 2016 – 2026 (USD Million)
      10. 6.4.10. Spain
        1. 6.4.10.1. Spain Antithrombin Market, 2016 – 2026 (USD Million)
      11. 6.4.11. Rest of Europe
        1. 6.4.11.1. Rest of Europe Antithrombin Market, 2016 – 2026 (USD Million)
    5. 6.5. Asia Pacific
      1. 6.5.1. Asia Pacific Antithrombin Market, 2016 – 2026 (USD Million)
        1. 6.5.1.1. Asia Pacific Antithrombin Market, by Country, 2016 - 2026 (USD Million)
      2. 6.5.2. Asia Pacific Antithrombin Market, by Source, 2016 – 2026
        1. 6.5.2.1. Asia Pacific Antithrombin Market, by Source, 2016 – 2026 (USD Million)
      3. 6.5.3. Asia Pacific Antithrombin Market, by Application, 2016 – 2026
        1. 6.5.3.1. Asia Pacific Antithrombin Market, by Application, 2016 – 2026 (USD Million)
      4. 6.5.4. Asia Pacific Antithrombin Market, by Dosage Form, 2016 – 2026
        1. 6.5.4.1. Asia Pacific Antithrombin Market, by Dosage Form, 2016 – 2026 (USD Million)
      5. 6.5.5. Asia Pacific Antithrombin Market, by Route, 2016 – 2026
        1. 6.5.5.1. Asia Pacific Antithrombin Market, by Route, 2016 – 2026 (USD Million)
      6. 6.5.6. China
        1. 6.5.6.1. China Antithrombin Market, 2016 – 2026 (USD Million)
      7. 6.5.7. Japan
        1. 6.5.7.1. Japan Antithrombin Market, 2016 – 2026 (USD Million)
      8. 6.5.8. India
        1. 6.5.8.1. India Antithrombin Market, 2016 – 2026 (USD Million)
      9. 6.5.9. South Korea
        1. 6.5.9.1. South Korea Antithrombin Market, 2016 – 2026 (USD Million)
      10. 6.5.10. South-East Asia
        1. 6.5.10.1. South-East Asia Antithrombin Market, 2016 – 2026 (USD Million)
      11. 6.5.11. Rest of Asia Pacific
        1. 6.5.11.1. Rest of Asia Pacific Antithrombin Market, 2016 – 2026 (USD Million)
    6. 6.6. Latin America
      1. 6.6.1. Latin America Antithrombin Market, 2016 – 2026 (USD Million)
        1. 6.6.1.1. Latin America Antithrombin Market, by Country, 2016 - 2026 (USD Million)
      2. 6.6.2. Latin America Antithrombin Market, by Source, 2016 – 2026
        1. 6.6.2.1. Latin America Antithrombin Market, by Source, 2016 – 2026 (USD Million)
      3. 6.6.3. Latin America Antithrombin Market, by Application, 2016 – 2026
        1. 6.6.3.1. Latin America Antithrombin Market, by Application, 2016 – 2026 (USD Million)
      4. 6.6.4. Latin America Antithrombin Market, by Dosage Form, 2016 – 2026
        1. 6.6.4.1. Latin America Antithrombin Market, by Dosage Form, 2016 – 2026 (USD Million)
      5. 6.6.5. Latin America Antithrombin Market, by Route, 2016 – 2026
        1. 6.6.5.1. Latin America Antithrombin Market, by Route, 2016 – 2026 (USD Million)
      6. 6.6.6. Brazil
        1. 6.6.6.1. Brazil Antithrombin Market, 2016 – 2026 (USD Million)
      7. 6.6.7. Mexico
        1. 6.6.7.1. Mexico Antithrombin Market, 2016 – 2026 (USD Million)
      8. 6.6.8. Rest of Latin America
        1. 6.6.8.1. Rest of Latin America Antithrombin Market, 2016 – 2026 (USD Million)
    7. 6.7. The Middle-East and Africa
      1. 6.7.1. The Middle-East and Africa Antithrombin Market, 2016 – 2026 (USD Million)
        1. 6.7.1.1. The Middle-East and Africa Antithrombin Market, by Country, 2016 - 2026 (USD Million)
      2. 6.7.2. The Middle-East and Africa Antithrombin Market, by Source, 2016 – 2026
        1. 6.7.2.1. The Middle-East and Africa Antithrombin Market, by Source, 2016 – 2026 (USD Million)
      3. 6.7.3. The Middle-East and Africa Antithrombin Market, by Application, 2016 – 2026
        1. 6.7.3.1. The Middle-East and Africa Antithrombin Market, by Application, 2016 – 2026 (USD Million)
      4. 6.7.4. The Middle-East and Africa Antithrombin Market, by Dosage Form, 2016 – 2026
        1. 6.7.4.1. The Middle-East and Africa Antithrombin Market, by Dosage Form, 2016 – 2026 (USD Million)
      5. 6.7.5. The Middle-East and Africa Antithrombin Market, by Route, 2016 – 2026
        1. 6.7.5.1. The Middle-East and Africa Antithrombin Market, by Route, 2016 – 2026 (USD Million)
      6. 6.7.6. GCC Countries
        1. 6.7.6.1. GCC Countries Antithrombin Market, 2016 – 2026 (USD Million)
      7. 6.7.7. South Africa
        1. 6.7.7.1. South Africa Antithrombin Market, 2016 – 2026 (USD Million)
      8. 6.7.8. Rest of Middle-East Africa
        1. 6.7.8.1. Rest of Middle-East Africa Antithrombin Market, 2016 – 2026 (USD Million)
  7. Chapter 7 Antithrombin Market – Competitive Landscape
    1. 7.1. Competitor Market Share – Revenue
    2. 7.2. Market Concentration Rate Analysis, Top 3 and Top 5 Players
    3. 7.3. Strategic Developments
      1. 7.3.1. Acquisitions and Mergers
      2. 7.3.2. New Products
      3. 7.3.3. Research & Development Activities
  8. Chapter 8 Company Profiles
    1. 8.1. Grifols SA
      1. 8.1.1. Company Overview
      2. 8.1.2. Product/Service Portfolio
      3. 8.1.3. Grifols SA Sales, Revenue, and Gross Margin
      4. 8.1.4. Grifols SA Revenue and Growth Rate
      5. 8.1.5. Grifols SA Market Share
      6. 8.1.6. Recent Initiatives, Funding/VC Activities, and Technological Innovations
    2. 8.2. Octapharma AG
      1. 8.2.1. Company Overview
      2. 8.2.2. Product/Service Portfolio
      3. 8.2.3. Octapharma AG Sales, Revenue, and Gross Margin
      4. 8.2.4. Octapharma AG Revenue and Growth Rate
      5. 8.2.5. Octapharma AG Market Share
      6. 8.2.6. Recent Initiatives, Funding/VC Activities, and Technological Innovations
    3. 8.3. LFB
      1. 8.3.1. Company Overview
      2. 8.3.2. Product/Service Portfolio
      3. 8.3.3. LFB Sales, Revenue, and Gross Margin
      4. 8.3.4. LFB Revenue and Growth Rate
      5. 8.3.5. LFB Market Share
      6. 8.3.6. Recent Initiatives, Funding/VC Activities, and Technological Innovations
    4. 8.4. CSL Limited
      1. 8.4.1. Company Overview
      2. 8.4.2. Product/Service Portfolio
      3. 8.4.3. CSL Limited Sales, Revenue, and Gross Margin
      4. 8.4.4. CSL Limited Revenue and Growth Rate
      5. 8.4.5. CSL Limited Market Share
      6. 8.4.6. Recent Initiatives, Funding/VC Activities, and Technological Innovations
    5. 8.5. Takeda Pharmaceutical Company Limited
      1. 8.5.1. Company Overview
      2. 8.5.2. Product/Service Portfolio
      3. 8.5.3. Takeda Pharmaceutical Company Limited Sales, Revenue, and Gross Margin
      4. 8.5.4. Takeda Pharmaceutical Company Limited Revenue and Growth Rate
      5. 8.5.5. Takeda Pharmaceutical Company Limited Market Share
      6. 8.5.6. Recent Initiatives, Funding/VC Activities, and Technological Innovations
    6. 8.6. Keridon S.p.A.
      1. 8.6.1. Company Overview
      2. 8.6.2. Product/Service Portfolio
      3. 8.6.3. Keridon S.p.A. Sales, Revenue, and Gross Margin
      4. 8.6.4. Keridon S.p.A. Revenue and Growth Rate
      5. 8.6.5. Keridon S.p.A. Market Share
      6. 8.6.6. Recent Initiatives, Funding/VC Activities, and Technological Innovations
    7. 8.7. Lee Biosolutions
      1. 8.7.1. Company Overview
      2. 8.7.2. Product/Service Portfolio
      3. 8.7.3. Lee Biosolutions Sales, Revenue, and Gross Margin
      4. 8.7.4. Lee Biosolutions Revenue and Growth Rate
      5. 8.7.5. Lee Biosolutions Market Share
      6. 8.7.6. Recent Initiatives, Funding/VC Activities, and Technological Innovations
    8. 8.8. Scripps Laboratories Inc
      1. 8.8.1. Company Overview
      2. 8.8.2. Product/Service Portfolio
      3. 8.8.3. Scripps Laboratories Inc Sales, Revenue, and Gross Margin
      4. 8.8.4. Scripps Laboratories Inc Revenue and Growth Rate
      5. 8.8.5. Scripps Laboratories Inc Market Share
      6. 8.8.6. Recent Initiatives, Funding/VC Activities, and Technological Innovations
    9. 8.9. GTC Biotherapeutics Inc
      1. 8.9.1. Company Overview
      2. 8.9.2. Product/Service Portfolio
      3. 8.9.3. GTC Biotherapeutics Inc Sales, Revenue, and Gross Margin
      4. 8.9.4. GTC Biotherapeutics Inc Revenue and Growth Rate
      5. 8.9.5. GTC Biotherapeutics Inc Market Share
      6. 8.9.6. Recent Initiatives, Funding/VC Activities, and Technological Innovations
    10. 8.10. BDI Pharma
      1. 8.10.1. Company Overview
      2. 8.10.2. Product/Service Portfolio
      3. 8.10.3. BDI Pharma Sales, Revenue, and Gross Margin
      4. 8.10.4. BDI Pharma Revenue and Growth Rate
      5. 8.10.5. BDI Pharma Market Share
      6. 8.10.6. Recent Initiatives, Funding/VC Activities, and Technological Innovations
  9. Chapter 9 Antithrombin — Industry Analysis
    1. 9.1. Introduction and Taxonomy
    2. 9.2. Antithrombin Market – Key Trends
      1. 9.2.1. Market Drivers
      2. 9.2.2. Market Restraints
      3. 9.2.3. Market Opportunities
    3. 9.3. Value Chain Analysis
    4. 9.4. Key Mandates and Regulations
    5. 9.5. Technology Roadmap and Timeline
    6. 9.6. Antithrombin Market – Attractiveness Analysis
      1. 9.6.1. By Source
      2. 9.6.2. By Application
      3. 9.6.3. By Dosage Form
      4. 9.6.4. By Route
      5. 9.6.5. By Region
  10. Chapter 10 Industrial Chain, Sourcing Strategy, and Downstream Buyers
    1. 10.1. Antithrombin Industrial Chain Analysis
    2. 10.2. Downstream Buyers
    3. 10.3. Distributors/Traders List
  11. Chapter 11 Marketing Strategy Analysis
    1. 11.1. Marketing Channel
    2. 11.2. Direct Marketing
    3. 11.3. Indirect Marketing
    4. 11.4. Marketing Channel Development Trends
    5. 11.5. Economic/Political Environmental Change
  12. Chapter 12 Report Conclusion & Key Insights
    1. 12.1. Key Insights from Primary Interviews & Surveys Respondents
    2. 12.2. Key Takeaways from Analysts, Consultants, and Industry Leaders
  13. Chapter 13 Research Approach & Methodology
    1. 13.1. Report Description
    2. 13.2. Research Scope
    3. 13.3. Research Methodology
      1. 13.3.1. Secondary Research
      2. 13.3.2. Primary Research
      3. 13.3.3. Statistical Models
        1. 13.3.3.1. Company Share Analysis Model
        2. 13.3.3.2. Revenue Based Modeling
      4. 13.3.4. Research Limitations

      List of Figures

      Fig.1	Product Picture of Antithrombin
      Fig.2	Global Antithrombin Market, 2016 – 2026 (USD Million)
      Fig.3	Global Antithrombin Market Absolute Revenue Opportunity, 2016 – 2026 (USD Million)
      Fig.4	Global Antithrombin Market Incremental Revenue Opportunity, 2020 – 2026 (USD Million)
      Fig.5	Global Antithrombin Market Share, by Source, 2020 & 2026 (USD Million)
      Fig.6	Global Human Antithrombin Market, 2016 – 2026 (USD Million)
      Fig.7	Global Goat Milk Antithrombin Market, 2016 – 2026 (USD Million)
      Fig.8	Global Others Antithrombin Market, 2016 – 2026 (USD Million)
      Fig.9	Global Antithrombin Market Share, by Application, 2020 & 2026 (USD Million)
      Fig.10	Global Therapeutics Antithrombin Market, 2016 – 2026 (USD Million)
      Fig.11	Global Diagnostics Antithrombin Market, 2016 – 2026 (USD Million)
      Fig.12	Global Research Antithrombin Market, 2016 – 2026 (USD Million)
      Fig.13	Global Others Antithrombin Market, 2016 – 2026 (USD Million)
      Fig.14	Global Antithrombin Market Share, by Dosage Form, 2020 & 2026 (USD Million)
      Fig.15	Global Lyophilized  Antithrombin Market, 2016 – 2026 (USD Million)
      Fig.16	Global Liquid Antithrombin Market, 2016 – 2026 (USD Million)
      Fig.17	Global Antithrombin Market Share, by Route, 2020 & 2026 (USD Million)
      Fig.18	Global Oral Antithrombin Market, 2016 – 2026 (USD Million)
      Fig.19	Global Parental Antithrombin Market, 2016 – 2026 (USD Million)
      Fig.20	Global Antithrombin Market Share, by Region, 2020 & 2026 (USD Million)
      Fig.21	North America Antithrombin Market, 2016 – 2026 (USD Million)
      Fig.22	U.S. Antithrombin Market, 2016 – 2026 (USD Million)
      Fig.23	Canada Antithrombin Market, 2016 – 2026 (USD Million)
      Fig.24	Europe Antithrombin Market, 2016 – 2026 (USD Million)
      Fig.25	Germany Antithrombin Market, 2016 – 2026 (USD Million)
      Fig.26	France Antithrombin Market, 2016 – 2026 (USD Million)
      Fig.27	U.K. Antithrombin Market, 2016 – 2026 (USD Million)
      Fig.28	Italy Antithrombin Market, 2016 – 2026 (USD Million)
      Fig.29	Spain Antithrombin Market, 2016 – 2026 (USD Million)
      Fig.30	Rest of Europe Antithrombin Market, 2016 – 2026 (USD Million)
      Fig.31	Asia Pacific Antithrombin Market, 2016 – 2026 (USD Million)
      Fig.32	China Antithrombin Market, 2016 – 2026 (USD Million)
      Fig.33	Japan Antithrombin Market, 2016 – 2026 (USD Million)
      Fig.34	India Antithrombin Market, 2016 – 2026 (USD Million)
      Fig.35	South  Korea Antithrombin Market, 2016 – 2026 (USD Million)
      Fig.36	South-East Asia Antithrombin Market, 2016 – 2026 (USD Million)
      Fig.37	Rest of Asia Pacific Antithrombin Market, 2016 – 2026 (USD Million)
      Fig.38	Latin America Antithrombin Market, 2016 – 2026 (USD Million)
      Fig.39	Brazil Antithrombin Market, 2016 – 2026 (USD Million)
      Fig.40	Mexico Antithrombin Market, 2016 – 2026 (USD Million)
      Fig.41	Rest of Latin America Antithrombin Market, 2016 – 2026 (USD Million)
      Fig.42	The Middle-East and Africa Antithrombin Market, 2016 – 2026 (USD Million)
      Fig.43	GCC Countries Antithrombin Market, 2016 – 2026 (USD Million)
      Fig.44	South Africa Antithrombin Market, 2016 – 2026 (USD Million)
      Fig.45	Rest of Middle-East Africa Antithrombin Market, 2016 – 2026 (USD Million)
      Fig.46	Competitor Market Share – Revenue
      Fig.47	Grifols SA Revenue and Growth Rate
      Fig.48	Grifols SA Market Share
      Fig.49	Octapharma AG Revenue and Growth Rate
      Fig.50	Octapharma AG Market Share
      Fig.51	LFB Revenue and Growth Rate
      Fig.52	LFB Market Share
      Fig.53	CSL Limited Revenue and Growth Rate
      Fig.54	CSL Limited Market Share
      Fig.55	Takeda Pharmaceutical Company Limited Revenue and Growth Rate
      Fig.56	Takeda Pharmaceutical Company Limited Market Share
      Fig.57	Keridon S.p.A. Revenue and Growth Rate
      Fig.58	Keridon S.p.A. Market Share
      Fig.59	Lee Biosolutions Revenue and Growth Rate
      Fig.60	Lee Biosolutions Market Share
      Fig.61	Scripps Laboratories Inc Revenue and Growth Rate
      Fig.62	Scripps Laboratories Inc Market Share
      Fig.63	GTC Biotherapeutics Inc Revenue and Growth Rate
      Fig.64	GTC Biotherapeutics Inc Market Share
      Fig.65	BDI Pharma Revenue and Growth Rate
      Fig.66	BDI Pharma Market Share
      Fig.67	Market Dynamics
      Fig.68	Global Antithrombin – Value Chain Analysis
      Fig.69	Key Mandates and Regulations
      Fig.70	Technology Roadmap and Timeline
      Fig.71	Market Attractiveness Analysis – By Source
      Fig.72	Market Attractiveness Analysis – By Application
      Fig.73	Market Attractiveness Analysis – By Dosage Form
      Fig.74	Market Attractiveness Analysis – By Route
      Fig.75	Market Attractiveness Analysis – By Region
      Fig.76	Antithrombin Industrial Chain Analysis
      Fig.77	Market Channels
      Fig.78	Marketing Channel Development Trend
      Fig.79	Growth in World Gross Product, 2008-2018
      

      List of Tables

      Table 1	Global Antithrombin Market, 2020 & 2026 (USD Million)
      Table 2	Global Antithrombin Market, by Source, 2016 – 2026 (USD Million)
      Table 3	Global Antithrombin Market, by Application, 2016 – 2026 (USD Million)
      Table 4	Global Antithrombin Market, by Dosage Form, 2016 – 2026 (USD Million)
      Table 5	Global Antithrombin Market, by Route, 2016 – 2026 (USD Million)
      Table 6	Global Antithrombin Market, by Region, 2016 – 2026 (USD Million)
      Table 7	North America Antithrombin Market, by Country, 2016 – 2026 (USD Million)
      Table 8	North America Antithrombin Market, by Source, 2016 – 2026 (USD Million)
      Table 9	North America Antithrombin Market, by Application, 2016 – 2026 (USD Million)
      Table 10 North America Antithrombin Market, by Dosage Form, 2016 – 2026 (USD Million)
      Table 11 North America Antithrombin Market, by Route, 2016 – 2026 (USD Million)
      Table 12 Europe Antithrombin Market, by Country, 2016 – 2026 (USD Million)
      Table 13 Europe Antithrombin Market, by Source, 2016 – 2026 (USD Million)
      Table 14 Europe Antithrombin Market, by Application, 2016 – 2026 (USD Million)
      Table 15 Europe Antithrombin Market, by Dosage Form, 2016 – 2026 (USD Million)
      Table 16 Europe Antithrombin Market, by Route, 2016 – 2026 (USD Million)
      Table 17 Asia Pacific Antithrombin Market, by Country, 2016 – 2026 (USD Million)
      Table 18 Asia Pacific Antithrombin Market, by Source, 2016 – 2026 (USD Million)
      Table 19 Asia Pacific Antithrombin Market, by Application, 2016 – 2026 (USD Million)
      Table 20 Asia Pacific Antithrombin Market, by Dosage Form, 2016 – 2026 (USD Million)
      Table 21 Asia Pacific Antithrombin Market, by Route, 2016 – 2026 (USD Million)
      Table 22 Latin America Antithrombin Market, by Country, 2016 – 2026 (USD Million)
      Table 23 Latin America Antithrombin Market, by Source, 2016 – 2026 (USD Million)
      Table 24 Latin America Antithrombin Market, by Application, 2016 – 2026 (USD Million)
      Table 25 Latin America Antithrombin Market, by Dosage Form, 2016 – 2026 (USD Million)
      Table 26 Latin America Antithrombin Market, by Route, 2016 – 2026 (USD Million)
      Table 27 The Middle-East and Africa Antithrombin Market, by Country, 2016 – 2026 (USD Million)
      Table 28 The Middle-East and Africa Antithrombin Market, by Source, 2016 – 2026 (USD Million)
      Table 29 The Middle-East and Africa Antithrombin Market, by Application, 2016 – 2026 (USD Million)
      Table 30 The Middle-East and Africa Antithrombin Market, by Dosage Form, 2016 – 2026 (USD Million)
      Table 31 The Middle-East and Africa Antithrombin Market, by Route, 2016 – 2026 (USD Million)
      Table 32 Global Antithrombin Market - Company Revenue Analysis, 2016 – 2020 (USD Million)
      Table 33 Global Antithrombin Market - Company Revenue Share Analysis, 2016 – 2020 (%)
      Table 34 Acquisitions and Mergers
      Table 35 Market Drivers – Impact Analysis
      Table 36 Market Restraints
      Table 37 Market Opportunities
      Table 38 Major Buyers of Antithrombin
      Table 39 Distributors/Traders of Antithrombin by Region
      

Industry Major Market Players

  • Grifols SA.
  • Octapharma AG
  • LFB
  • CSL Limited
  • Takeda Pharmaceutical Company Limited
  • Keridon S.p.A.
  • Lee Biosolutions
  • Scripps Laboratories Inc.
  • GTC Biotherapeutics Inc.
  • BDI Pharma