Search Market Research Report

Discover Our Latest Reports
Discover Our Featured Reports
Discover Top Selling Reports

Antioxidant BHT Market Size, Share Global Analysis Report, 2021 – 2026

report img

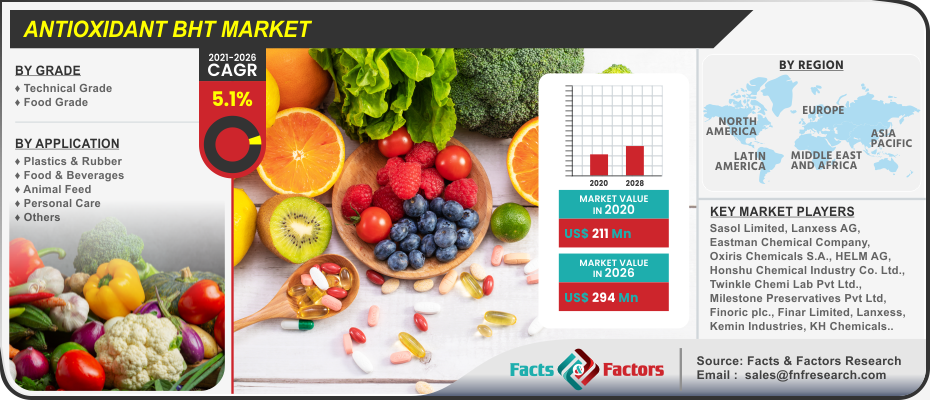
Antioxidant BHT Market By Grade (Technical Grade & Food Grade), By Application (Plastics & Rubber, Food & Beverages, Animal Feed, Personal Care, & Others), And By Regions - Global & Regional Industry Perspective, Comprehensive Analysis, and Forecast 2021 – 2026

Industry Insights

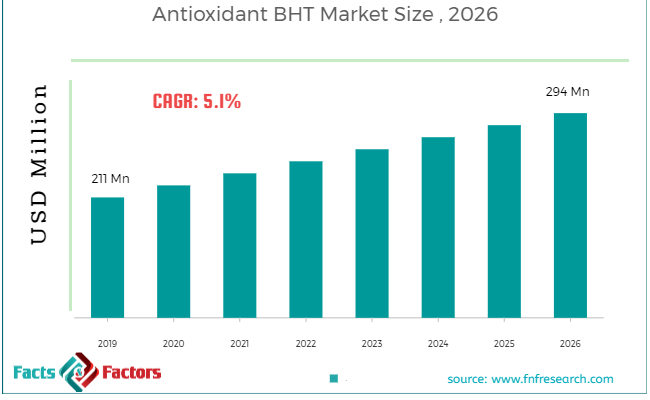
[210+ Pages Report] The latest finding surrounding the Global Antioxidant BHT Market published by Facts & Factors offers a neatly packaged and comprehensive read. We at Facts & Factors estimated the global antioxidant BHT market to reach a projected value of USD 294 Million by 2026 growing at a CAGR of 5.1% from an initial value of USD 211 Million in 2020.

Antioxidant BHT Market

To know more about this report | Request Free Sample Copy

logoMarket Overview

Butylated hydroxytoluene (BHT) or dibutlyhdroxyotoluene is a form of lipophilic organic compound that is often used for its antioxidant properties and is derived from an iteration of phenol. BHT is widely incorporated for preventing radically based medical properties oxidation among a wider range of fluids such as fuels and oils and other materials. They are also used as an antiviral drug in some cases for treating a handful of disorders and conditions; however, its use case is highly timid.


logoKey Insights from Primary Research

  • As per our primary respondents, the antioxidant BHT market is set to grow annually at a rate of around 5.1%.
  • It was established through primary research that the antioxidant BHTmarket was valued at around USD 211 Million in 2020.
  • The “Food Grade” category, on the basis of type segmentation, was the leading revenue generating category accounting for around 46% share, in 2019
  • On the basis of end-user segmentation, the “Food Industry”category held the leading share at more than 46%, in 2018

logoKey Recommendations from Analysts

  • Current research is intended for finding naturally occurring antioxidants having anticancer properties from plant origin since oxidants play a crucial role in developing various human diseases. Thus, antioxidant BHT is expected to positively impact on the global market.
  • Our analysts have identified “Food” and “Cosmetics” categories as the leading investment pockets for antioxidant BHT market in terms of type and end-user segmentations respectively
  • As per our Analysts, the Food-grade segment will grow tremendously owing to antioxidant BHT is widely used in foods to preserve fats and oils. Due to the antioxidants properties of BHT, it preservestaste, vitamins, aroma, and color by preventing the oxidation of food fats & oils and its resulting rancidity.

Antioxidant BHT Market

To know more about this report | Request Free Sample Copy

The factors fuellingthe significant rise of the global antioxidant BHT market include increasing demand froma variety of end-user industries such as plastics, animal care, food & beverages, personal care, agrochemicals, lubricants, and biodiesel to name a few. Additionally, rising concerns among consumers regardingwater pollution coupled with a rising trend of wastewater recycling is expected to further increase the footprint of the global antioxidant BHT market during the advent of the forecast period. Moreover, increasing functionality of the latter in terms of antioxidant properties and as a stabilizing agent coupled with improved performance upon integration in terms of odor, color, and texture is further expected to propelthe global antioxidant BHT market to the next level during the forecast period.

The global antioxidant BHT market is expected to be driven by increased amount of R&D fordevelopment of better products and rising number of QC and R&D labs on a global scale to name a few. Furthermore, the expansion of key market players inacquiring SMEs coupled with a wave of rapid industrialization is further expected to boost the growth of the global antioxidant BHT market during the advent of the forecast period. However, rising amount of stringent regulatory norms laid by various government bodies and fluctuating prices of raw materials is expected to hamper the growth of the global antioxidant BHT market to some extent.

The global antioxidant BHT market is divided intotechnical grade and food grade on the basis of grade. The technical grade segment is expected to witness the largest market share during the advent of the forecast owing to increased useof BHT as an antioxidant agent inplastics, rubbers and elastomers, lubricating & specialty oils, industrial fats, and soy & others plant derived oils and increased functionality as a stability and anti-deterioration agent to name a few.

Based on application, theglobal antioxidant BHT market iscategorized into plastics and rubber, food & beverages, animal feed, personal care, and others. The plastics and rubbers segment is expected to witness the largest market share of the latter owing to increased demand and production from emerging economies for a wider range of application coupled with the rising demand from consumers for reusable and breakable goods to name a few.

logoReport Scope

Report Attribute

Details

Market Size in 2019

USD 211 Million

Projected Market Size in 2026

USD 294 Million

CAGR Growth Rate

5.1% CAGR

Base Year

2019

Forecast Years

2020-2026

Key Market Players

Sasol Limited, Lanxess AG, Eastman Chemical Company, Oxiris Chemicals S.A., HELM AG, Finoric plc., Honshu Chemical Industry Co. Ltd., Twinkle Chemi Lab Pvt Ltd., Milestone Preservatives Pvt Ltd, Finar Limited, Lanxess, Kemin Industries, KH Chemicals, Cayman Chemicals, Ratnagiri Chemicals Pvt Ltd., and Spectrum Chemical Manufacturing Corp, and Others

Key Segment

By Grade, Application, and Region

Major Regions Covered

North America, Europe, Asia Pacific, Latin America, and the Middle East & Africa

Purchase Options

Request customized purchase options to meet your research needs.Explore purchase options

North America is expected to witness the largest market share during the advent of the forecast owing to the rising consumption of poultry based products coupled with a rising trend of pet parenting to name a few. Additionally, factors pertaining to integration of antioxidant BTH in themanufacturing of feed for poultry, swine, fish feed, and cattle are expected to increase the footprint of the antioxidant BHT market during the advent of the forecast period.

Asia-Pacific is expected to witness the fastest growing CAGR during the advent of the forecast owing to stringent regulations for the control of VOC based emissions coupled with rising demand from emerging economies such as China, India, and Japan as the latter are the breeding grounds for plastics, chemicals, agrochemicals, and lubricants to name a few.

logoSome of the leading players in the global market include

  • Sasol Limited
  • Lanxess AG
  • Eastman Chemical Company
  • Oxiris Chemicals S.A.
  • HELM AG
  • Finoric plc.
  • Honshu Chemical Industry Co. Ltd.
  • Twinkle Chemi Lab Pvt Ltd.
  • Milestone Preservatives Pvt Ltd
  • Finar Limited
  • Lanxess
  • Kemin Industries
  • KH Chemicals
  • Cayman Chemicals
  • Ratnagiri Chemicals Pvt Ltd.
  • Spectrum Chemical Manufacturing Corp

logoBy Grade Segment Analysis

  • Technical Grade
  • Food Grade

logoBy Application Segment Analysis

  • Plastics & Rubber
  • Food & Beverages
  • Animal Feed
  • Personal Care
  • Others

logoBy Regional Segment Analysis

  • North America
    • U.S.
    • Canada
  • Europe
    • UK
    • France
    • Germany
    • Italy
    • Spain
    • Rest of Europe
  • Asia Pacific
    • China
    • Japan
    • India
    • South Korea
    • Southeast Asia
    • Rest of Asia Pacific
  • Latin America
    • Brazil
    • Mexico
    • Rest of Latin America
  • Middle East and Africa
    • GCC Countries
    • South Africa
    • Rest of MEA

Table of Content

  1. Chapter 1 Executive Summary
    1. 1.1. Introduction of Antioxidant BHT
    2. 1.2. Global Antioxidant BHT Market, 2019 & 2026 (USD Million)
    3. 1.3. Global Antioxidant BHT Market, 2016 – 2026 (USD Million)
    4. 1.4. Global Antioxidant BHT Market Absolute Revenue Opportunity, 2016 – 2026 (USD Million)
    5. 1.5. Global Antioxidant BHT Market Incremental Revenue Opportunity, 2020 – 2026 (USD Million)
  2. Chapter 2 Antioxidant BHT Market – Grade Analysis
    1. 2.1. Global Antioxidant BHT Market – Grade Overview
    2. 2.2. Global Antioxidant BHT Market Share, by Grade, 2019 & 2026 (USD Million)
    3. 2.3. Technical Grade
      1. 2.3.1. Global Technical Grade Antioxidant BHT Market, 2016 – 2026 (USD Million)
    4. 2.4. Food Grade
      1. 2.4.1. Global Food Grade Antioxidant BHT Market, 2016 – 2026 (USD Million)
  3. Chapter 3 Antioxidant BHT Market – Application Analysis
    1. 3.1. Global Antioxidant BHT Market – Application Overview
    2. 3.2. Global Antioxidant BHT Market Share, by Application, 2019 & 2026 (USD Million)
    3. 3.3. Plastics & Rubber
      1. 3.3.1. Global Plastics & Rubber Antioxidant BHT Market, 2016 – 2026 (USD Million)
    4. 3.4. Food & Beverages
      1. 3.4.1. Global Food & Beverages Antioxidant BHT Market, 2016 – 2026 (USD Million)
    5. 3.5. Animal Feed
      1. 3.5.1. Global Animal Feed Antioxidant BHT Market, 2016 – 2026 (USD Million)
    6. 3.6. Personal Care
      1. 3.6.1. Global Personal Care Antioxidant BHT Market, 2016 – 2026 (USD Million)
    7. 3.7. Others
      1. 3.7.1. Global Others Antioxidant BHT Market, 2016 – 2026 (USD Million)
  4. Chapter 4 Antioxidant BHT Market – Regional Analysis
    1. 4.1. Global Antioxidant BHT Market Regional Overview
    2. 4.2. Global Antioxidant BHT Market Share, by Region, 2019 & 2026 (USD Million)
    3. 4.3. North America
      1. 4.3.1. North America Antioxidant BHT Market, 2016 – 2026 (USD Million)
        1. 4.3.1.1. North America Antioxidant BHT Market, by Country, 2016 - 2026 (USD Million)
      2. 4.3.2. North America Antioxidant BHT Market, by Grade, 2016 – 2026
        1. 4.3.2.1. North America Antioxidant BHT Market, by Grade, 2016 – 2026 (USD Million)
      3. 4.3.3. North America Antioxidant BHT Market, by Application, 2016 – 2026
        1. 4.3.3.1. North America Antioxidant BHT Market, by Application, 2016 – 2026 (USD Million)
      4. 4.3.4. U.S.
        1. 4.3.4.1. U.S. Antioxidant BHT Market, 2016 – 2026 (USD Million)
      5. 4.3.5. Canada
        1. 4.3.5.1. Canada Antioxidant BHT Market, 2016 – 2026 (USD Million)
    4. 4.4. Europe
      1. 4.4.1. Europe Antioxidant BHT Market, 2016 – 2026 (USD Million)
        1. 4.4.1.1. Europe Antioxidant BHT Market, by Country, 2016 - 2026 (USD Million)
      2. 4.4.2. Europe Antioxidant BHT Market, by Grade, 2016 – 2026
        1. 4.4.2.1. Europe Antioxidant BHT Market, by Grade, 2016 – 2026 (USD Million)
      3. 4.4.3. Europe Antioxidant BHT Market, by Application, 2016 – 2026
        1. 4.4.3.1. Europe Antioxidant BHT Market, by Application, 2016 – 2026 (USD Million)
      4. 4.4.4. Germany
        1. 4.4.4.1. Germany Antioxidant BHT Market, 2016 – 2026 (USD Million)
      5. 4.4.5. France
        1. 4.4.5.1. France Antioxidant BHT Market, 2016 – 2026 (USD Million)
      6. 4.4.6. U.K.
        1. 4.4.6.1. U.K. Antioxidant BHT Market, 2016 – 2026 (USD Million)
      7. 4.4.7. Italy
        1. 4.4.7.1. Italy Antioxidant BHT Market, 2016 – 2026 (USD Million)
      8. 4.4.8. Spain
        1. 4.4.8.1. Spain Antioxidant BHT Market, 2016 – 2026 (USD Million)
      9. 4.4.9. Rest of Europe
        1. 4.4.9.1. Rest of Europe Antioxidant BHT Market, 2016 – 2026 (USD Million)
    5. 4.5. Asia Pacific
      1. 4.5.1. Asia Pacific Antioxidant BHT Market, 2016 – 2026 (USD Million)
        1. 4.5.1.1. Asia Pacific Antioxidant BHT Market, by Country, 2016 - 2026 (USD Million)
      2. 4.5.2. Asia Pacific Antioxidant BHT Market, by Grade, 2016 – 2026
        1. 4.5.2.1. Asia Pacific Antioxidant BHT Market, by Grade, 2016 – 2026 (USD Million)
      3. 4.5.3. Asia Pacific Antioxidant BHT Market, by Application, 2016 – 2026
        1. 4.5.3.1. Asia Pacific Antioxidant BHT Market, by Application, 2016 – 2026 (USD Million)
      4. 4.5.4. China
        1. 4.5.4.1. China Antioxidant BHT Market, 2016 – 2026 (USD Million)
      5. 4.5.5. Japan
        1. 4.5.5.1. Japan Antioxidant BHT Market, 2016 – 2026 (USD Million)
      6. 4.5.6. India
        1. 4.5.6.1. India Antioxidant BHT Market, 2016 – 2026 (USD Million)
      7. 4.5.7. South Korea
        1. 4.5.7.1. South Korea Antioxidant BHT Market, 2016 – 2026 (USD Million)
      8. 4.5.8. South-East Asia
        1. 4.5.8.1. South-East Asia Antioxidant BHT Market, 2016 – 2026 (USD Million)
      9. 4.5.9. Rest of Asia Pacific
        1. 4.5.9.1. Rest of Asia Pacific Antioxidant BHT Market, 2016 – 2026 (USD Million)
    6. 4.6. Latin America
      1. 4.6.1. Latin America Antioxidant BHT Market, 2016 – 2026 (USD Million)
        1. 4.6.1.1. Latin America Antioxidant BHT Market, by Country, 2016 - 2026 (USD Million)
      2. 4.6.2. Latin America Antioxidant BHT Market, by Grade, 2016 – 2026
        1. 4.6.2.1. Latin America Antioxidant BHT Market, by Grade, 2016 – 2026 (USD Million)
      3. 4.6.3. Latin America Antioxidant BHT Market, by Application, 2016 – 2026
        1. 4.6.3.1. Latin America Antioxidant BHT Market, by Application, 2016 – 2026 (USD Million)
      4. 4.6.4. Brazil
        1. 4.6.4.1. Brazil Antioxidant BHT Market, 2016 – 2026 (USD Million)
      5. 4.6.5. Mexico
        1. 4.6.5.1. Mexico Antioxidant BHT Market, 2016 – 2026 (USD Million)
      6. 4.6.6. Rest of Latin America
        1. 4.6.6.1. Rest of Latin America Antioxidant BHT Market, 2016 – 2026 (USD Million)
    7. 4.7. The Middle-East and Africa
      1. 4.7.1. The Middle-East and Africa Antioxidant BHT Market, 2016 – 2026 (USD Million)
        1. 4.7.1.1. The Middle-East and Africa Antioxidant BHT Market, by Country, 2016 - 2026 (USD Million)
      2. 4.7.2. The Middle-East and Africa Antioxidant BHT Market, by Grade, 2016 – 2026
        1. 4.7.2.1. The Middle-East and Africa Antioxidant BHT Market, by Grade, 2016 – 2026 (USD Million)
      3. 4.7.3. The Middle-East and Africa Antioxidant BHT Market, by Application, 2016 – 2026
        1. 4.7.3.1. The Middle-East and Africa Antioxidant BHT Market, by Application, 2016 – 2026 (USD Million)
      4. 4.7.4. GCC Countries
        1. 4.7.4.1. GCC Countries Antioxidant BHT Market, 2016 – 2026 (USD Million)
      5. 4.7.5. South Africa
        1. 4.7.5.1. South Africa Antioxidant BHT Market, 2016 – 2026 (USD Million)
      6. 4.7.6. Rest of Middle-East Africa
        1. 4.7.6.1. Rest of Middle-East Africa Antioxidant BHT Market, 2016 – 2026 (USD Million)
  5. Chapter 5 Antioxidant BHT Market – Competitive Landscape
    1. 5.1. Competitor Market Share – Revenue
    2. 5.2. Market Concentration Rate Analysis, Top 3 and Top 5 Players
    3. 5.3. Strategic Developments
      1. 5.3.1. Acquisitions and Mergers
      2. 5.3.2. New Products
      3. 5.3.3. Research & Development Activities
  6. Chapter 6 Company Profiles
    1. 6.1. Sasol Limited
      1. 6.1.1. Company Overview
      2. 6.1.2. Product/Service Portfolio
      3. 6.1.3. Sasol Limited Sales, Revenue, and Gross Margin
      4. 6.1.4. Sasol Limited Revenue and Growth Rate
      5. 6.1.5. Sasol Limited Market Share
      6. 6.1.6. Recent Initiatives, Funding/VC Activities, and Technological Innovations
    2. 6.2. Lanxess AG
      1. 6.2.1. Company Overview
      2. 6.2.2. Product/Service Portfolio
      3. 6.2.3. Lanxess AG Sales, Revenue, and Gross Margin
      4. 6.2.4. Lanxess AG Revenue and Growth Rate
      5. 6.2.5. Lanxess AG Market Share
      6. 6.2.6. Recent Initiatives, Funding/VC Activities, and Technological Innovations
    3. 6.3. Eastman Chemical Company
      1. 6.3.1. Company Overview
      2. 6.3.2. Product/Service Portfolio
      3. 6.3.3. Eastman Chemical Company Sales, Revenue, and Gross Margin
      4. 6.3.4. Eastman Chemical Company Revenue and Growth Rate
      5. 6.3.5. Eastman Chemical Company Market Share
      6. 6.3.6. Recent Initiatives, Funding/VC Activities, and Technological Innovations
    4. 6.4. Oxiris Chemicals S.A
      1. 6.4.1. Company Overview
      2. 6.4.2. Product/Service Portfolio
      3. 6.4.3. Oxiris Chemicals S.A Sales, Revenue, and Gross Margin
      4. 6.4.4. Oxiris Chemicals S.A Revenue and Growth Rate
      5. 6.4.5. Oxiris Chemicals S.A Market Share
      6. 6.4.6. Recent Initiatives, Funding/VC Activities, and Technological Innovations
    5. 6.5. HELM AG
      1. 6.5.1. Company Overview
      2. 6.5.2. Product/Service Portfolio
      3. 6.5.3. HELM AG Sales, Revenue, and Gross Margin
      4. 6.5.4. HELM AG Revenue and Growth Rate
      5. 6.5.5. HELM AG Market Share
      6. 6.5.6. Recent Initiatives, Funding/VC Activities, and Technological Innovations
    6. 6.6. Finoric plc
      1. 6.6.1. Company Overview
      2. 6.6.2. Product/Service Portfolio
      3. 6.6.3. Finoric plc Sales, Revenue, and Gross Margin
      4. 6.6.4. Finoric plc Revenue and Growth Rate
      5. 6.6.5. Finoric plc Market Share
      6. 6.6.6. Recent Initiatives, Funding/VC Activities, and Technological Innovations
    7. 6.7. Honshu Chemical Industry Co. Ltd
      1. 6.7.1. Company Overview
      2. 6.7.2. Product/Service Portfolio
      3. 6.7.3. Honshu Chemical Industry Co. Ltd Sales, Revenue, and Gross Margin
      4. 6.7.4. Honshu Chemical Industry Co. Ltd Revenue and Growth Rate
      5. 6.7.5. Honshu Chemical Industry Co. Ltd Market Share
      6. 6.7.6. Recent Initiatives, Funding/VC Activities, and Technological Innovations
    8. 6.8. Twinkle Chemi Lab Pvt Ltd
      1. 6.8.1. Company Overview
      2. 6.8.2. Product/Service Portfolio
      3. 6.8.3. Twinkle Chemi Lab Pvt Ltd Sales, Revenue, and Gross Margin
      4. 6.8.4. Twinkle Chemi Lab Pvt Ltd Revenue and Growth Rate
      5. 6.8.5. Twinkle Chemi Lab Pvt Ltd Market Share
      6. 6.8.6. Recent Initiatives, Funding/VC Activities, and Technological Innovations
    9. 6.9. Milestone Preservatives Pvt Ltd
      1. 6.9.1. Company Overview
      2. 6.9.2. Product/Service Portfolio
      3. 6.9.3. Milestone Preservatives Pvt Ltd Sales, Revenue, and Gross Margin
      4. 6.9.4. Milestone Preservatives Pvt Ltd Revenue and Growth Rate
      5. 6.9.5. Milestone Preservatives Pvt Ltd Market Share
      6. 6.9.6. Recent Initiatives, Funding/VC Activities, and Technological Innovations
    10. 6.10. Finar Limited
      1. 6.10.1. Company Overview
      2. 6.10.2. Product/Service Portfolio
      3. 6.10.3. Finar Limited Sales, Revenue, and Gross Margin
      4. 6.10.4. Finar Limited Revenue and Growth Rate
      5. 6.10.5. Finar Limited Market Share
      6. 6.10.6. Recent Initiatives, Funding/VC Activities, and Technological Innovations
    11. 6.11. Lanxess
      1. 6.11.1. Company Overview
      2. 6.11.2. Product/Service Portfolio
      3. 6.11.3. Lanxess Sales, Revenue, and Gross Margin
      4. 6.11.4. Lanxess Revenue and Growth Rate
      5. 6.11.5. Lanxess Market Share
      6. 6.11.6. Recent Initiatives, Funding/VC Activities, and Technological Innovations
    12. 6.12. Kemin Industries
      1. 6.12.1. Company Overview
      2. 6.12.2. Product/Service Portfolio
      3. 6.12.3. Kemin Industries Sales, Revenue, and Gross Margin
      4. 6.12.4. Kemin Industries Revenue and Growth Rate
      5. 6.12.5. Kemin Industries Market Share
      6. 6.12.6. Recent Initiatives, Funding/VC Activities, and Technological Innovations
    13. 6.13. KH Chemicals
      1. 6.13.1. Company Overview
      2. 6.13.2. Product/Service Portfolio
      3. 6.13.3. KH Chemicals Sales, Revenue, and Gross Margin
      4. 6.13.4. KH Chemicals Revenue and Growth Rate
      5. 6.13.5. KH Chemicals Market Share
      6. 6.13.6. Recent Initiatives, Funding/VC Activities, and Technological Innovations
    14. 6.14. Cayman Chemicals
      1. 6.14.1. Company Overview
      2. 6.14.2. Product/Service Portfolio
      3. 6.14.3. Cayman Chemicals Sales, Revenue, and Gross Margin
      4. 6.14.4. Cayman Chemicals Revenue and Growth Rate
      5. 6.14.5. Cayman Chemicals Market Share
      6. 6.14.6. Recent Initiatives, Funding/VC Activities, and Technological Innovations
    15. 6.15. Ratnagiri Chemicals Pvt Ltd
      1. 6.15.1. Company Overview
      2. 6.15.2. Product/Service Portfolio
      3. 6.15.3. Ratnagiri Chemicals Pvt Ltd Sales, Revenue, and Gross Margin
      4. 6.15.4. Ratnagiri Chemicals Pvt Ltd Revenue and Growth Rate
      5. 6.15.5. Ratnagiri Chemicals Pvt Ltd Market Share
      6. 6.15.6. Recent Initiatives, Funding/VC Activities, and Technological Innovations
    16. 6.16. Spectrum Chemical Manufacturing Corp
      1. 6.16.1. Company Overview
      2. 6.16.2. Product/Service Portfolio
      3. 6.16.3. Spectrum Chemical Manufacturing Corp Sales, Revenue, and Gross Margin
      4. 6.16.4. Spectrum Chemical Manufacturing Corp Revenue and Growth Rate
      5. 6.16.5. Spectrum Chemical Manufacturing Corp Market Share
      6. 6.16.6. Recent Initiatives, Funding/VC Activities, and Technological Innovations
  7. Chapter 7 Antioxidant BHT — Industry Analysis
    1. 7.1. Introduction and Taxonomy
    2. 7.2. Antioxidant BHT Market – Key Trends
      1. 7.2.1. Market Drivers
      2. 7.2.2. Market Restraints
      3. 7.2.3. Market Opportunities
    3. 7.3. Value Chain Analysis
    4. 7.4. Key Mandates and Regulations
    5. 7.5. Technology Roadmap and Timeline
    6. 7.6. Antioxidant BHT Market – Attractiveness Analysis
      1. 7.6.1. By Grade
      2. 7.6.2. By Application
      3. 7.6.3. By Region
  8. Chapter 8 Industrial Chain, Sourcing Strategy, and Downstream Buyers
    1. 8.1. Antioxidant BHT Industrial Chain Analysis
    2. 8.2. Downstream Buyers
    3. 8.3. Distributors/Traders List
  9. Chapter 9 Marketing Strategy Analysis
    1. 9.1. Marketing Channel
    2. 9.2. Direct Marketing
    3. 9.3. Indirect Marketing
    4. 9.4. Marketing Channel Development Trends
    5. 9.5. Economic/Political Environmental Change
  10. Chapter 10 Report Conclusion & Key Insights
    1. 10.1. Key Insights from Primary Interviews & Surveys Respondents
    2. 10.2. Key Takeaways from Analysts, Consultants, and Industry Leaders
  11. Chapter 11 Research Approach & Methodology
    1. 11.1. Report Description
    2. 11.2. Research Scope
    3. 11.3. Research Methodology
      1. 11.3.1. Secondary Research
      2. 11.3.2. Primary Research
      3. 11.3.3. Statistical Models
        1. 11.3.3.1. Company Share Analysis Model
        2. 11.3.3.2. Revenue Based Modeling
      4. 11.3.4. Research Limitations

      List of Figures

      Fig.1	Product Picture of Antioxidant BHT
      Fig.2	Global Antioxidant BHT Market, 2016 – 2026 (USD Million)
      Fig.3	Global Antioxidant BHT Market Absolute Revenue Opportunity, 2016 – 2026 (USD Million)
      Fig.4	Global Antioxidant BHT Market Incremental Revenue Opportunity, 2020 – 2026 (USD Million)
      Fig.5	Global Antioxidant BHT Market Share, by Grade, 2019 & 2026 (USD Million)
      Fig.6	Global Technical Grade  Antioxidant BHT Market, 2016 – 2026 (USD Million)
      Fig.7	Global Food Grade Antioxidant BHT Market, 2016 – 2026 (USD Million)
      Fig.8	Global Antioxidant BHT Market Share, by Application, 2019 & 2026 (USD Million)
      Fig.9	Global Plastics & Rubber  Antioxidant BHT Market, 2016 – 2026 (USD Million)
      Fig.10	Global Food & Beverages  Antioxidant BHT Market, 2016 – 2026 (USD Million)
      Fig.11	Global Animal Feed Antioxidant BHT Market, 2016 – 2026 (USD Million)
      Fig.12	Global Personal Care Antioxidant BHT Market, 2016 – 2026 (USD Million)
      Fig.13	Global Others Antioxidant BHT Market, 2016 – 2026 (USD Million)
      Fig.14	Global Antioxidant BHT Market Share, by Region, 2019 & 2026 (USD Million)
      Fig.15	North America Antioxidant BHT Market, 2016 – 2026 (USD Million)
      Fig.16	U.S. Antioxidant BHT Market, 2016 – 2026 (USD Million)
      Fig.17	Canada Antioxidant BHT Market, 2016 – 2026 (USD Million)
      Fig.18	Europe Antioxidant BHT Market, 2016 – 2026 (USD Million)
      Fig.19	Germany Antioxidant BHT Market, 2016 – 2026 (USD Million)
      Fig.20	France Antioxidant BHT Market, 2016 – 2026 (USD Million)
      Fig.21	U.K. Antioxidant BHT Market, 2016 – 2026 (USD Million)
      Fig.22	Italy Antioxidant BHT Market, 2016 – 2026 (USD Million)
      Fig.23	Spain Antioxidant BHT Market, 2016 – 2026 (USD Million)
      Fig.24	Rest of Europe Antioxidant BHT Market, 2016 – 2026 (USD Million)
      Fig.25	Asia Pacific Antioxidant BHT Market, 2016 – 2026 (USD Million)
      Fig.26	China Antioxidant BHT Market, 2016 – 2026 (USD Million)
      Fig.27	Japan Antioxidant BHT Market, 2016 – 2026 (USD Million)
      Fig.28	India Antioxidant BHT Market, 2016 – 2026 (USD Million)
      Fig.29	South  Korea Antioxidant BHT Market, 2016 – 2026 (USD Million)
      Fig.30	South-East Asia Antioxidant BHT Market, 2016 – 2026 (USD Million)
      Fig.31	Rest of Asia Pacific Antioxidant BHT Market, 2016 – 2026 (USD Million)
      Fig.32	Latin America Antioxidant BHT Market, 2016 – 2026 (USD Million)
      Fig.33	Brazil Antioxidant BHT Market, 2016 – 2026 (USD Million)
      Fig.34	Mexico Antioxidant BHT Market, 2016 – 2026 (USD Million)
      Fig.35	Rest of Latin America Antioxidant BHT Market, 2016 – 2026 (USD Million)
      Fig.36	The Middle-East and Africa Antioxidant BHT Market, 2016 – 2026 (USD Million)
      Fig.37	GCC Countries Antioxidant BHT Market, 2016 – 2026 (USD Million)
      Fig.38	South Africa Antioxidant BHT Market, 2016 – 2026 (USD Million)
      Fig.39	Rest of Middle-East Africa Antioxidant BHT Market, 2016 – 2026 (USD Million)
      Fig.40	Competitor Market Share – Revenue
      Fig.41	Sasol Limited Revenue and Growth Rate
      Fig.42	Sasol Limited Market Share
      Fig.43	Lanxess AG Revenue and Growth Rate
      Fig.44	Lanxess AG Market Share
      Fig.45	Eastman Chemical Company Revenue and Growth Rate
      Fig.46	Eastman Chemical Company Market Share
      Fig.47	Oxiris Chemicals S.A Revenue and Growth Rate
      Fig.48	Oxiris Chemicals S.A Market Share
      Fig.49	HELM AG Revenue and Growth Rate
      Fig.50	HELM AG Market Share
      Fig.51	Finoric plc Revenue and Growth Rate
      Fig.52	Finoric plc Market Share
      Fig.53	Honshu Chemical Industry Co. Ltd Revenue and Growth Rate
      Fig.54	Honshu Chemical Industry Co. Ltd Market Share
      Fig.55	Twinkle Chemi Lab Pvt Ltd Revenue and Growth Rate
      Fig.56	Twinkle Chemi Lab Pvt Ltd Market Share
      Fig.57	Milestone Preservatives Pvt Ltd Revenue and Growth Rate
      Fig.58	Milestone Preservatives Pvt Ltd Market Share
      Fig.59	Finar Limited Revenue and Growth Rate
      Fig.60	Finar Limited Market Share
      Fig.61	Lanxess Revenue and Growth Rate
      Fig.62	Lanxess Market Share
      Fig.63	Kemin Industries Revenue and Growth Rate
      Fig.64	Kemin Industries Market Share
      Fig.65	KH Chemicals Revenue and Growth Rate
      Fig.66	KH Chemicals Market Share
      Fig.67	Cayman Chemicals Revenue and Growth Rate
      Fig.68	Cayman Chemicals Market Share
      Fig.69	Ratnagiri Chemicals Pvt Ltd Revenue and Growth Rate
      Fig.70	Ratnagiri Chemicals Pvt Ltd Market Share
      Fig.71	Spectrum Chemical Manufacturing Corp Revenue and Growth Rate
      Fig.72	Spectrum Chemical Manufacturing Corp Market Share
      Fig.73	Market Dynamics
      Fig.74	Global Antioxidant BHT – Value Chain Analysis
      Fig.75	Key Mandates and Regulations
      Fig.76	Technology Roadmap and Timeline
      Fig.77	Market Attractiveness Analysis – By Grade
      Fig.78	Market Attractiveness Analysis – By Application
      Fig.79	Market Attractiveness Analysis – By Region
      Fig.80	Antioxidant BHT Industrial Chain Analysis
      Fig.81	Market Channels
      Fig.82	Marketing Channel Development Trend
      Fig.83	Growth in World Gross Product, 2008-2018
      

      List of Tables

      Table 1	Global Antioxidant BHT Market, 2019 & 2026 (USD Million)
      Table 2	Global Antioxidant BHT Market, by Grade, 2016 – 2026 (USD Million)
      Table 3	Global Antioxidant BHT Market, by Application, 2016 – 2026 (USD Million)
      Table 4	Global Antioxidant BHT Market, by Region, 2016 – 2026 (USD Million)
      Table 5	North America Antioxidant BHT Market, by Country, 2016 – 2026 (USD Million)
      Table 6	North America Antioxidant BHT Market, by Grade, 2016 – 2026 (USD Million)
      Table 7	North America Antioxidant BHT Market, by Application, 2016 – 2026 (USD Million)
      Table 8	Europe Antioxidant BHT Market, by Country, 2016 – 2026 (USD Million)
      Table 9	Europe Antioxidant BHT Market, by Grade, 2016 – 2026 (USD Million)
      Table 10 Europe Antioxidant BHT Market, by Application, 2016 – 2026 (USD Million)
      Table 11 Asia Pacific Antioxidant BHT Market, by Country, 2016 – 2026 (USD Million)
      Table 12 Asia Pacific Antioxidant BHT Market, by Grade, 2016 – 2026 (USD Million)
      Table 13 Asia Pacific Antioxidant BHT Market, by Application, 2016 – 2026 (USD Million)
      Table 14 Latin America Antioxidant BHT Market, by Country, 2016 – 2026 (USD Million)
      Table 15 Latin America Antioxidant BHT Market, by Grade, 2016 – 2026 (USD Million)
      Table 16 Latin America Antioxidant BHT Market, by Application, 2016 – 2026 (USD Million)
      Table 17 The Middle-East and Africa Antioxidant BHT Market, by Country, 2016 – 2026 (USD Million)
      Table 18 The Middle-East and Africa Antioxidant BHT Market, by Grade, 2016 – 2026 (USD Million)
      Table 19 The Middle-East and Africa Antioxidant BHT Market, by Application, 2016 – 2026 (USD Million)
      Table 20 Global Antioxidant BHT Market - Company Revenue Analysis, 2016 – 2019 (USD Million)
      Table 21 Global Antioxidant BHT Market - Company Revenue Share Analysis, 2016 – 2019 (%)
      Table 22 Acquisitions and Mergers
      Table 23 Market Drivers – Impact Analysis
      Table 24 Market Restraints
      Table 25 Market Opportunities
      Table 26 Major Buyers of Antioxidant BHT
      Table 27 Distributors/Traders of Antioxidant BHT by Region
      

Industry Major Market Players

  • Sasol Limited
  • Lanxess AG
  • Eastman Chemical Company
  • Oxiris Chemicals S.A.
  • HELM AG
  • Finoric plc.
  • Honshu Chemical Industry Co. Ltd.
  • Twinkle Chemi Lab Pvt Ltd.
  • Milestone Preservatives Pvt Ltd
  • Finar Limited
  • Lanxess
  • Kemin Industries
  • KH Chemicals
  • Cayman Chemicals
  • Ratnagiri Chemicals Pvt Ltd.
  • Spectrum Chemical Manufacturing Corp