Search Market Research Report

Discover Our Latest Reports
Discover Our Featured Reports
Discover Top Selling Reports

Aluminum Casting Market Size, Share Global Analysis Report, 2020–2026

report img

Aluminum Casting Market By Process (Die Casting, Permanent Mold Casting, and Others) and By End-Use (Transportation, Industrial, Building & Construction, and Others): Global Industry Outlook, Market Size, Business Intelligence, Consumer Preferences, Statistical Surveys, Comprehensive Analysis, Historical Developments, Current Trends, and Forecast 2020–2026

Industry Insights

This specialized and expertise oriented industry research report scrutinizes the technical and commercial business outlook of the aluminum casting industry. The report analyzes and declares the historical and current trends analysis of the aluminum casting industry and subsequently recommends the projected trends anticipated to be observed in the aluminum casting market during the upcoming years.

The aluminum casting market report analyzes and notifies the industry statistics at the global as well as regional and country levels in order to acquire a thorough perspective of the entire aluminum casting market. The historical and past insights are provided for FY 2016 to FY 2019 whereas projected trends are delivered for FY 2020 to FY 2026. The quantitative and numerical data is represented in terms of both volume (Kilo Tons) and value (USD Million) from FY 2016 – 2026.

Aluminum Casting Market Size

To know more about this report | Request Free Sample Copy


logoKey Insights from Primary Research

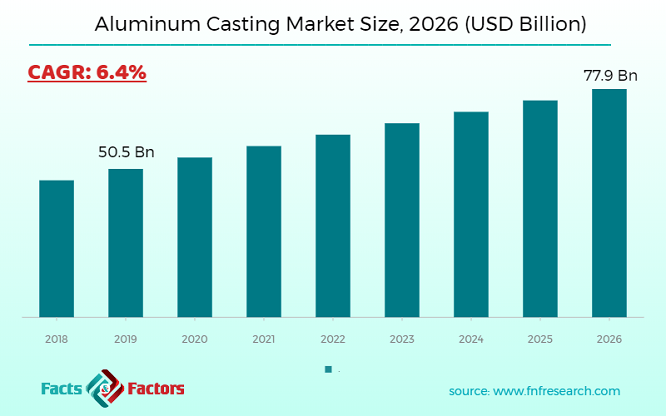
  • As per our primary respondents, the aluminum casting market is set to grow annually at a rate of around 6.4%
  • It was established through primary research that the aluminum casting market was valued at around USD 50.5 billion in 2019
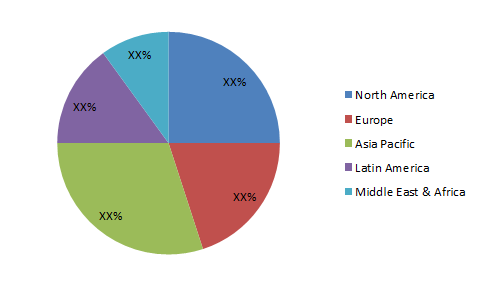
  • The Asia Pacific held the largest market share of aluminum casting in terms of revenue in 2019
  • The “Die Casting” category, on the basis of process segmentation, was the leading revenue-generating category in 2019 with 52% of market share
  • The “Transportation” category, on the basis of end-use segmentation, was the leading revenue-generating in 2019 with 59% of market share

logoKey Recommendations from Analysts

  • As per our analysts, increasing demand for general utility and sports utility vehicles are anticipated to drive the market
  • Increasing demand for lightweight vehicles on account of soaring environmental pollution, rising disposable incomes, and changing lifestyle of consumers is anticipated to boost the demand for aluminum casting
  • The growth in the transportation segment is also supported by increasing demand for aircraft, as aluminum cast products are used in manufacturing jet or aircraft engines
  • The application scope of aluminum casting is widening in agricultural equipment, construction equipment, mining equipment, and other heavy-duty machinery
  • Rapidly expanding manufacturing sector in China and India is boosting the aluminum casting market in the Asia Pacific

logoAluminum Casting Market Share – By Region

Aluminum Casting Market

To know more about this report | Request Free Sample Copy


The quantitative data is further underlined and reinforced by comprehensive qualitative data which comprises various across-the-board market dynamics. The rationales which directly or indirectly impact the aluminum casting industry are exemplified through parameters such as growth drivers, restraints, challenges, and opportunities among other impacting factors.

Throughout our research report, we have encompassed all the proven models and tools of industry analysis and extensively illustrated all the key business strategies and business models adopted in the aluminum casting industry. The report provides an all-inclusive and detailed competitive landscape prevalent in the aluminum casting market.

The report utilizes established industry analysis tools and models such as Porter’s Five Forces framework to analyze and recognize critical business strategies adopted by various stakeholders involved in the entire value chain of the aluminum casting industry. The aluminum casting market report additionally employs SWOT analysis and PESTLE analysis models for further in-depth analysis.

The report study further includes an in-depth analysis of industry players' market shares and provides an overview of leading players' market position in the aluminum casting sector. Key strategic developments in the aluminum casting market competitive landscape such as acquisitions & mergers, inaugurations of different products and services, partnerships & joint ventures, MoU agreements, VC & funding activities, R&D activities, and geographic expansion among other noteworthy activities by key players of the aluminum casting market are appropriately highlighted in the report.

Global sales of lightweight vehicles are projected to hit approximately 110 million units by 2026, according to the Automotive Research Centre. Growth is due to strict fuel emission control rules, increasing the need for lightweight materials such as aluminum. Aluminum-based vehicles provide improved acceleration and braking systems and therefore improve fuel economy.

The aluminum casting market research report delivers an acute valuation and taxonomy of the aluminum casting industry by practically splitting the market on the basis of different types, applications, and regions. Through the analysis of the historical and projected trends, all the segments and sub-segments were evaluated through the bottom-up approach, and different market sizes have been projected for FY 2020 to FY 2026. The regional segmentation of the aluminum casting industry includes the complete classification of all the major continents including North America, Latin America, Europe, Asia Pacific, and the Middle East & Africa. Further, country-wise data for the aluminum casting industry is provided for the leading economies of the world.

The aluminum casting market is segmented based on process and end-use. On the basis of process segmentation, the market is classified die casting, permanent mold casting, and others. In terms of end-use segmentation, the market is bifurcated into transportation, industrial, building & construction, and others.

logoReport Scope

Report Attribute

Details

Market Size in 2019

USD 50.5 billion

Projected Market Size in 2026

USD 77.9 billion

CAGR Growth Rate

6.4% CAGR

Base Year

2019

Forecast Years

2020-2026

Key Market Players

Alcoa Corporation, Dynacast, Ryobi Ltd., Martinrea Honsel Germany GmbH, Alcast Technologies, Endurance Technologies Limited, Aluminum Corporation of China Limited, Bodine Aluminum, Inc., Gibbs Die Casting Corporation, Consolidated Metco, Inc., Walbro and Others.

Key Segment

By Process, By End-Use, By Region

Major Regions Covered

North America, Europe, Asia Pacific, Latin America, and the Middle East & Africa

Purchase Options

Request customized purchase options to meet your research needs. Explore purchase options

logoSome of the essential players operating in the aluminum casting market, but not restricted to include

  • Alcoa Corporation
  • Dynacast
  • Ryobi Ltd.
  • Martinrea Honsel Germany GmbH
  • Alcast Technologies
  • Endurance Technologies Limited
  • Aluminum Corporation of China Limited
  • Bodine Aluminum Inc.
  • Gibbs Die Casting Corporation
  • Consolidated Metco Inc.
  • Walbro
  • and Others

The taxonomy of the aluminum casting industry by its scope and segmentation is as follows:

logo By Process Segmentation Analysis (Customizable)

  • Die Casting
  • Permanent Mold Casting
  • Others

logo By End-Use Segmentation Analysis (Customizable)

  • Transportation
  • Industrial
  • Building & Construction
  • Others

logo Regional Segmentation Analysis (Customizable)

  • North America
    • The U.S.
    • Canada
  • Europe
    • Germany
    • The UK
    • France
    • Spain
    • Italy
    • Rest of Europe
  • Asia Pacific
    • China
    • Japan
    • India
    • South Korea
    • Southeast Asia
    • Rest of Asia Pacific
  • Latin America
    • Brazil
    • Mexico
    • Rest of Latin America
  • Middle East & Africa
    • GCC
    • South Africa
    • Rest of Middle East & Africa

Table of Content

  1. CHAPTER 1. Executive Summary
  2. CHAPTER 2. Aluminum Casting market – Process Analysis
    1. 2.1. Global Aluminum Casting Market – Process Overview
    2. 2.2. Global Aluminum Casting Market Share, by Process, 2019 & 2026 (USD Million)
    3. 2.3. Global Aluminum Casting Market share, by Process, 2019 & 2026 (Kilo Tons)
    4. 2.4. Die Casting
      1. 2.4.1. Global Die Casting Aluminum Casting Market, 2016-2026 (USD Million)
      2. 2.4.2. Global Die Casting Aluminum Casting Market, 2016-2026 (Kilo Tons)
    5. 2.5. Permanent Mold Casting
      1. 2.5.1. Global Permanent Mold Casting Aluminum Casting Market, 2016-2026 (USD Million)
      2. 2.5.2. Global Permanent Mold Casting Aluminum Casting Market, 2016-2026 (Kilo Tons)
    6. 2.6. Others
      1. 2.6.1. Global Others Aluminum Casting Market, 2016-2026 (USD Million)
      2. 2.6.2. Global Others Aluminum Casting Market, 2016-2026 (Kilo Tons)
  3. CHAPTER 3. Aluminum Casting market – End-Use Analysis
    1. 3.1. Global Aluminum Casting Market – End-Use Overview
    2. 3.2. Global Aluminum Casting Market Share, by End-Use, 2019 & 2026 (USD Million)
    3. 3.3. Global Aluminum Casting Market share, by End-Use, 2019 & 2026 (Kilo Tons)
    4. 3.4. Transportation
      1. 3.4.1. Global Transportation Aluminum Casting Market, 2016-2026 (USD Million)
      2. 3.4.2. Global Transportation Aluminum Casting Market, 2016-2026 (Kilo Tons)
    5. 3.5. Industrial
      1. 3.5.1. Global Industrial Aluminum Casting Market, 2016-2026 (USD Million)
      2. 3.5.2. Global Industrial Aluminum Casting Market, 2016-2026 (Kilo Tons)
    6. 3.6. Building & Construction
      1. 3.6.1. Global Building & Construction Aluminum Casting Market, 2016-2026 (USD Million)
      2. 3.6.2. Global Building & Construction Aluminum Casting Market, 2016-2026 (Kilo Tons)
    7. 3.7. Others
      1. 3.7.1. Global Others Aluminum Casting Market, 2016-2026 (USD Million)
      2. 3.7.2. Global Others Aluminum Casting Market, 2016-2026 (Kilo Tons)
  4. CHAPTER 4. Aluminum Casting market – Regional Analysis
    1. 4.1. Global Aluminum Casting Market Regional Overview
    2. 4.2. Global Aluminum Casting Market Share, by Region, 2019 & 2026 (Value)
    3. 4.3. Global Aluminum Casting Market Share, by Region, 2019 & 2026 (Volume)
    4. 4.4. North America
      1. 4.4.1. North America Aluminum Casting Market size and forecast, 2016-2026
      2. 4.4.2. North America Aluminum Casting Market, by Country, 2019 - 2026 (USD Million)
      3. 4.4.3. North America Market size and forecast, 2016-2026 (Kilo Tons)
      4. 4.4.4. North America Aluminum Casting Market, by Country, 2019 - 2026 (Kilo Tons)
      5. 4.4.5. North America Aluminum Casting Market, by Process, 2016-2026
        1. 4.4.5.1. North America Aluminum Casting Market, by Process, 2016-2026 (USD Million)
        2. 4.4.5.2. North America Aluminum Casting Market, by Process, 2016-2026 (Kilo Tons)
      6. 4.4.6. North America Aluminum Casting Market, by End-Use, 2016-2026
        1. 4.4.6.1. North America Aluminum Casting Market, by End-Use, 2016-2026 (USD Million)
        2. 4.4.6.2. North America Aluminum Casting Market, by End-Use, 2016-2026 (Kilo Tons)
      7. 4.4.7. U.S.
        1. 4.4.7.1. U.S. Market size and forecast, 2016-2026 (USD Million)
        2. 4.4.7.2. U.S. Market size and forecast, 2016-2026 (Kilo Tons)
      8. 4.4.8. Canada
        1. 4.4.8.1. Canada Market size and forecast, 2016-2026 (USD Million)
        2. 4.4.8.2. Canada Market size and forecast, 2016-2026 (Kilo Tons)
    5. 4.5. Europe
      1. 4.5.1. Europe Aluminum Casting Market size and forecast, 2016-2026
      2. 4.5.2. Europe Aluminum Casting Market, by Country, 2019 - 2026 (USD Million)
      3. 4.5.3. Europe Market size and forecast, 2016-2026 (Kilo Tons)
      4. 4.5.4. Europe Aluminum Casting Market, by Country, 2019 - 2026 (Kilo Tons)
      5. 4.5.5. Europe Aluminum Casting Market, by Process, 2016-2026
        1. 4.5.5.1. Europe Aluminum Casting Market, by Process, 2016-2026 (USD Million)
        2. 4.5.5.2. Europe Aluminum Casting Market, by Process, 2016-2026 (Kilo Tons)
      6. 4.5.6. Europe Aluminum Casting Market, by End-Use, 2016-2026
        1. 4.5.6.1. Europe Aluminum Casting Market, by End-Use, 2016-2026 (USD Million)
        2. 4.5.6.2. Europe Aluminum Casting Market, by End-Use, 2016-2026 (Kilo Tons)
      7. 4.5.7. Germany
        1. 4.5.7.1. Germany Market size and forecast, 2016-2026 (USD Million)
        2. 4.5.7.2. Germany Market size and forecast, 2016-2026 (Kilo Tons)
      8. 4.5.8. France
        1. 4.5.8.1. France Market size and forecast, 2016-2026 (USD Million)
        2. 4.5.8.2. France Market size and forecast, 2016-2026 (Kilo Tons)
      9. 4.5.9. U.K.
        1. 4.5.9.1. U.K. Market size and forecast, 2016-2026 (USD Million)
        2. 4.5.9.2. U.K. Market size and forecast, 2016-2026 (Kilo Tons)
      10. 4.5.10. Italy
        1. 4.5.10.1. Italy Market size and forecast, 2016-2026 (USD Million)
        2. 4.5.10.2. Italy Market size and forecast, 2016-2026 (Kilo Tons)
      11. 4.5.11. Spain
        1. 4.5.11.1. Spain Market size and forecast, 2016-2026 (USD Million)
        2. 4.5.11.2. Spain Market size and forecast, 2016-2026 (Kilo Tons)
      12. 4.5.12. Rest of Europe
        1. 4.5.12.1. Rest of Europe Market size and forecast, 2016-2026 (USD Million)
        2. 4.5.12.2. Rest of Europe Market size and forecast, 2016-2026 (Kilo Tons)
    6. 4.6. Asia Pacific
      1. 4.6.1. Asia Pacific Aluminum Casting Market size and forecast, 2016-2026
      2. 4.6.2. Asia Pacific Aluminum Casting Market, by Country, 2019 - 2026 (USD Million)
      3. 4.6.3. Asia Pacific Market size and forecast, 2016-2026 (Kilo Tons)
      4. 4.6.4. Asia Pacific Aluminum Casting Market, by Country, 2019 - 2026 (Kilo Tons)
      5. 4.6.5. Asia Pacific Aluminum Casting Market, by Process, 2016-2026
        1. 4.6.5.1. Asia Pacific Aluminum Casting Market, by Process, 2016-2026 (USD Million)
        2. 4.6.5.2. Asia Pacific Aluminum Casting Market, by Process, 2016-2026 (Kilo Tons)
      6. 4.6.6. Asia Pacific Aluminum Casting Market, by End-Use, 2016-2026
        1. 4.6.6.1. Asia Pacific Aluminum Casting Market, by End-Use, 2016-2026 (USD Million)
        2. 4.6.6.2. Asia Pacific Aluminum Casting Market, by End-Use, 2016-2026 (Kilo Tons)
      7. 4.6.7. China
        1. 4.6.7.1. China Market size and forecast, 2016-2026 (USD Million)
        2. 4.6.7.2. China Market size and forecast, 2016-2026 (Kilo Tons)
      8. 4.6.8. Japan
        1. 4.6.8.1. Japan Market size and forecast, 2016-2026 (USD Million)
        2. 4.6.8.2. Japan Market size and forecast, 2016-2026 (Kilo Tons)
      9. 4.6.9. India
        1. 4.6.9.1. India Market size and forecast, 2016-2026 (USD Million)
        2. 4.6.9.2. India Market size and forecast, 2016-2026 (Kilo Tons)
      10. 4.6.10. South Korea
        1. 4.6.10.1. South Korea Market size and forecast, 2016-2026 (USD Million)
        2. 4.6.10.2. South Korea Market size and forecast, 2016-2026 (Kilo Tons)
      11. 4.6.11. South-East Asia
        1. 4.6.11.1. South-East Asia Market size and forecast, 2016-2026 (USD Million)
        2. 4.6.11.2. South-East Asia Market size and forecast, 2016-2026 (Kilo Tons)
      12. 4.6.12. Rest of Asia Pacific
        1. 4.6.12.1. Rest of Asia Pacific Market size and forecast, 2016-2026 (USD Million)
        2. 4.6.12.2. Rest of Asia Pacific Market size and forecast, 2016-2026 (Kilo Tons)
    7. 4.7. Latin America
      1. 4.7.1. Latin America Aluminum Casting Market size and forecast, 2016-2026
      2. 4.7.2. Latin America Aluminum Casting Market, by Country, 2019 - 2026 (USD Million)
      3. 4.7.3. Latin America Market size and forecast, 2016-2026 (Kilo Tons)
      4. 4.7.4. Latin America Aluminum Casting Market, by Country, 2019 - 2026 (Kilo Tons)
      5. 4.7.5. Latin America Aluminum Casting Market, by Process, 2016-2026
        1. 4.7.5.1. Latin America Aluminum Casting Market, by Process, 2016-2026 (USD Million)
        2. 4.7.5.2. Latin America Aluminum Casting Market, by Process, 2016-2026 (Kilo Tons)
      6. 4.7.6. Latin America Aluminum Casting Market, by End-Use, 2016-2026
        1. 4.7.6.1. Latin America Aluminum Casting Market, by End-Use, 2016-2026 (USD Million)
        2. 4.7.6.2. Latin America Aluminum Casting Market, by End-Use, 2016-2026 (Kilo Tons)
      7. 4.7.7. Brazil
        1. 4.7.7.1. Brazil Market size and forecast, 2016-2026 (USD Million)
        2. 4.7.7.2. Brazil Market size and forecast, 2016-2026 (Kilo Tons)
      8. 4.7.8. Mexico
        1. 4.7.8.1. Mexico Market size and forecast, 2016-2026 (USD Million)
        2. 4.7.8.2. Mexico Market size and forecast, 2016-2026 (Kilo Tons)
      9. 4.7.9. Rest of Latin America
        1. 4.7.9.1. Rest of Latin America Market size and forecast, 2016-2026 (USD Million)
        2. 4.7.9.2. Rest of Latin America Market size and forecast, 2016-2026 (Kilo Tons)
    8. 4.8. The Middle-East and Africa
      1. 4.8.1. The Middle-East and Africa Aluminum Casting Market size and forecast, 2016-2026
      2. 4.8.2. The Middle-East and Africa Aluminum Casting Market, by Country, 2019 - 2026 (USD Million)
      3. 4.8.3. The Middle-East and Africa Market size and forecast, 2016-2026 (Kilo Tons)
      4. 4.8.4. The Middle-East and Africa Aluminum Casting Market, by Country, 2019 - 2026 (Kilo Tons)
      5. 4.8.5. The Middle-East and Africa Aluminum Casting Market, by Process, 2016-2026
        1. 4.8.5.1. The Middle-East and Africa Aluminum Casting Market, by Process, 2016-2026 (USD Million)
        2. 4.8.5.2. The Middle-East and Africa Aluminum Casting Market, by Process, 2016-2026 (Kilo Tons)
      6. 4.8.6. The Middle-East and Africa Aluminum Casting Market, by End-Use, 2016-2026
        1. 4.8.6.1. The Middle-East and Africa Aluminum Casting Market, by End-Use, 2016-2026 (USD Million)
        2. 4.8.6.2. The Middle-East and Africa Aluminum Casting Market, by End-Use, 2016-2026 (Kilo Tons)
      7. 4.8.7. GCC Countries
        1. 4.8.7.1. GCC Countries Market size and forecast, 2016-2026 (USD Million)
        2. 4.8.7.2. GCC Countries Market size and forecast, 2016-2026 (Kilo Tons)
      8. 4.8.8. South Africa
        1. 4.8.8.1. South Africa Market size and forecast, 2016-2026 (USD Million)
        2. 4.8.8.2. South Africa Market size and forecast, 2016-2026 (Kilo Tons)
      9. 4.8.9. Rest of Middle-East Africa
        1. 4.8.9.1. Rest of Middle-East Africa Market size and forecast, 2016-2026 (USD Million)
        2. 4.8.9.2. Rest of Middle-East Africa Market size and forecast, 2016-2026 (Kilo Tons)
  5. CHAPTER 5. Aluminum Casting Production, Consumption, Export, Import by Regions
    1. 5.1. Global Aluminum Casting production and revenue, 2016-2026 (USD Million) (Kilo Tons)
    2. 5.2. Global Import and Export Analysis, by Region
  6. CHAPTER 6. Aluminum Casting market – Competitive Landscape
    1. 6.1. Competitor Market Share – Revenue
    2. 6.2. Market Concentration Rate Analysis, Top 3 and Top 5 Players
    3. 6.3. Competitor Market Share – Volume
    4. 6.4. Strategic Development
      1. 6.4.1. Acquisitions and Mergers
      2. 6.4.2. New Products
      3. 6.4.3. Research & Development Activities
  7. CHAPTER 7. Company Profiles
    1. 7.1. Alcoa Corporation
      1. 7.1.1. Company Overview
      2. 7.1.2. Alcoa Corporation Sales, Revenue, Price, and Gross Margin
      3. 7.1.3. Product portfolio
      4. 7.1.4. Recent initiatives
    2. 7.2. Dynacast
      1. 7.2.1. Company Overview
      2. 7.2.2. Dynacast Sales, Revenue, Price, and Gross Margin
      3. 7.2.3. Product portfolio
      4. 7.2.4. Recent initiatives
    3. 7.3. Ryobi Ltd.
      1. 7.3.1. Company Overview
      2. 7.3.2. Ryobi Ltd. Sales, Revenue, Price, and Gross Margin
      3. 7.3.3. Product portfolio
      4. 7.3.4. Recent initiatives
    4. 7.4. Martinrea Honsel Germany GmbH
      1. 7.4.1. Company Overview
      2. 7.4.2. Martinrea Honsel Germany GmbH Sales, Revenue, Price, and Gross Margin
      3. 7.4.3. Product portfolio
      4. 7.4.4. Recent initiatives
    5. 7.5. Alcast Technologies
      1. 7.5.1. Company Overview
      2. 7.5.2. Alcast Technologies Sales, Revenue, Price, and Gross Margin
      3. 7.5.3. Product portfolio
      4. 7.5.4. Recent initiatives
    6. 7.6. Endurance Technologies Limited
      1. 7.6.1. Company Overview
      2. 7.6.2. Endurance Technologies Limited Sales, Revenue, Price, and Gross Margin
      3. 7.6.3. Product portfolio
      4. 7.6.4. Recent initiatives
    7. 7.7. Aluminum Corporation of China Limited
      1. 7.7.1. Company Overview
      2. 7.7.2. Aluminum Corporation of China Limited Sales, Revenue, Price, and Gross Margin
      3. 7.7.3. Product portfolio
      4. 7.7.4. Recent initiatives
    8. 7.8. Bodine Aluminum, Inc.
      1. 7.8.1. Company Overview
      2. 7.8.2. Bodine Aluminum, Inc. Sales, Revenue, Price, and Gross Margin
      3. 7.8.3. Product portfolio
      4. 7.8.4. Recent initiatives
    9. 7.9. Gibbs Die Casting Corporation
      1. 7.9.1. Company Overview
      2. 7.9.2. Gibbs Die Casting Corporation Sales, Revenue, Price, and Gross Margin
      3. 7.9.3. Product portfolio
      4. 7.9.4. Recent initiatives
    10. 7.10. Consolidated Metco, Inc.
      1. 7.10.1. Company Overview
      2. 7.10.2. Consolidated Metco, Inc. Sales, Revenue, Price, and Gross Margin
      3. 7.10.3. Product portfolio
      4. 7.10.4. Recent initiatives
    11. 7.11. Walbro
      1. 7.11.1. Company Overview
      2. 7.11.2. Walbro Sales, Revenue, Price, and Gross Margin
      3. 7.11.3. Product portfolio
      4. 7.11.4. Recent initiatives
  8. CHAPTER 8. Aluminum Casting — Industry Analysis
    1. 8.1. Introduction and Taxonomy
    2. 8.2. Aluminum Casting Market – Key Trends
      1. 8.2.1. Market Drivers
      2. 8.2.2. Market Restraints
      3. 8.2.3. Market Opportunities
    3. 8.3. Value Chain Analysis
    4. 8.4. Key Mandates and Regulations
    5. 8.5. Technology Roadmap and Timeline
    6. 8.6. Aluminum Casting market – Attractiveness Analysis
      1. 8.6.1. By Process
      2. 8.6.2. By End-Use
      3. 8.6.3. By Region
  9. CHAPTER 9. Raw Material analysis
    1. 9.1. Aluminum Casting Key Raw Material Analysis
      1. 9.1.1. Key Raw Materials
      2. 9.1.2. Price Trend of Key Raw Materials
    2. 9.2. Key Suppliers of Raw Materials
    3. 9.3. Proportion of Manufacturing Cost Structure
      1. 9.3.1. Raw Materials
      2. 9.3.2. Labor Cost
    4. 9.4. Manufacturing Expenses Analysis of Aluminum Casting
  10. CHAPTER 10. Industrial Chain, Sourcing Strategy and Downstream Buyers
    1. 10.1. Aluminum Casting Industrial Chain Analysis
    2. 10.2. Upstream Raw Materials Sourcing
      1. 10.2.1. Risk Mitigation:
      2. 10.2.2. Supplier Relationships:
      3. 10.2.3. Business Processes:
      4. 10.2.4. Securing the Product:
    3. 10.3. Raw Materials Sources of Aluminum Casting Major Manufacturers in 2016
    4. 10.4. Downstream Buyers
    5. 10.5. Distributors/Traders List
  11. CHAPTER 11. Marketing Strategy Analysis, Distributors
    1. 11.1. Marketing Channel
    2. 11.2. Direct Marketing
    3. 11.3. Indirect Marketing
    4. 11.4. Marketing Channel Development Trend
    5. 11.5. Economic/Political Environmental Change
  12. CHAPTER 12. Report Conclusion
  13. CHAPTER 13. Research Approach & Methodology
    1. 13.1. Report Description
    2. 13.2. Research Scope
    3. 13.3. Research Methodology
      1. 13.3.1. Secondary Research
      2. 13.3.2. Primary Research
      3. 13.3.3. Models
        1. 13.3.3.1. Company Share Analysis Model
        2. 13.3.3.2. Revenue Based Modeling
        3. 13.3.3.3. Research Limitations

        List of Figures

        FIG. 1 Global Aluminum Casting Market, 2016-2026 (USD Million)
        FIG. 2 Global Aluminum Casting Market Share, by Process, 2019 & 2026 (USD Million)
        FIG. 3 Global Aluminum Casting Market share, by Process, 2019 & 2026 (Kilo Tons)
        FIG. 4 Global Die Casting Aluminum Casting Market, 2016-2026 (USD Million)
        FIG. 5 Global Die Casting Aluminum Casting  Market, 2016-2026 (Kilo Tons)
        FIG. 6 Global Permanent Mold Casting Aluminum Casting Market, 2016-2026 (USD Million)
        FIG. 7 Global Permanent Mold Casting Aluminum Casting  Market, 2016-2026 (Kilo Tons)
        FIG. 8 Global Others Aluminum Casting Market, 2016-2026 (USD Million)
        FIG. 9 Global Others Aluminum Casting  Market, 2016-2026 (Kilo Tons)
        FIG. 10 Global Aluminum Casting Market Share, by End-Use, 2019 & 2026 (USD Million)
        FIG. 11 Global Aluminum Casting Market share, by End-Use, 2019 & 2026 (Kilo Tons)
        FIG. 12 Global Transportation Aluminum Casting Market, 2016-2026 (USD Million)
        FIG. 13 Global Transportation Aluminum Casting  Market, 2016-2026 (Kilo Tons)
        FIG. 14 Global Industrial Aluminum Casting Market, 2016-2026 (USD Million)
        FIG. 15 Global Industrial Aluminum Casting  Market, 2016-2026 (Kilo Tons)
        FIG. 16 Global Building & Construction Aluminum Casting Market, 2016-2026 (USD Million)
        FIG. 17 Global Building & Construction Aluminum Casting  Market, 2016-2026 (Kilo Tons)
        FIG. 18 Global Others Aluminum Casting Market, 2016-2026 (USD Million)
        FIG. 19 Global Others Aluminum Casting  Market, 2016-2026 (Kilo Tons)
        FIG. 20 Global Aluminum Casting Market Share, by Region, 2019 & 2026
        FIG. 21 Global Aluminum Casting Market Share, by Region, 2019 & 2026
        FIG. 22 North America Aluminum Casting Market, 2016-2026
        FIG. 23 North America Aluminum Casting  Market, 2016-2026 (Kilo Tons)
        FIG. 24 U.S. Aluminum Casting Market, 2016-2026
        FIG. 25 U.S. Aluminum Casting  Market, 2016-2026 (Kilo Tons)
        FIG. 26 Canada Aluminum Casting Market, 2016-2026
        FIG. 27 Canada Aluminum Casting  Market, 2016-2026 (Kilo Tons)
        FIG. 28 Europe Aluminum Casting Market, 2016-2026
        FIG. 29 Europe Aluminum Casting  Market, 2016-2026 (Kilo Tons)
        FIG. 30 Germany Aluminum Casting Market, 2016-2026
        FIG. 31 Germany Aluminum Casting  Market, 2016-2026 (Kilo Tons)
        FIG. 32 France Aluminum Casting Market, 2016-2026
        FIG. 33 France Aluminum Casting  Market, 2016-2026 (Kilo Tons)
        FIG. 34 U.K. Aluminum Casting Market, 2016-2026
        FIG. 35 U.K. Aluminum Casting  Market, 2016-2026 (Kilo Tons)
        FIG. 36 Italy Aluminum Casting Market, 2016-2026
        FIG. 37 Italy Aluminum Casting  Market, 2016-2026 (Kilo Tons)
        FIG. 38 Spain Aluminum Casting Market, 2016-2026
        FIG. 39 Spain Aluminum Casting  Market, 2016-2026 (Kilo Tons)
        FIG. 40 Rest of Europe Aluminum Casting Market, 2016-2026
        FIG. 41 Rest of Europe Aluminum Casting  Market, 2016-2026 (Kilo Tons)
        FIG. 42 Asia Pacific Aluminum Casting Market, 2016-2026
        FIG. 43 Asia Pacific Aluminum Casting  Market, 2016-2026 (Kilo Tons)
        FIG. 44 China Aluminum Casting Market, 2016-2026
        FIG. 45 China Aluminum Casting  Market, 2016-2026 (Kilo Tons)
        FIG. 46 Japan Aluminum Casting Market, 2016-2026
        FIG. 47 Japan Aluminum Casting  Market, 2016-2026 (Kilo Tons)
        FIG. 48 India Aluminum Casting Market, 2016-2026
        FIG. 49 India Aluminum Casting  Market, 2016-2026 (Kilo Tons)
        FIG. 50 South  Korea Aluminum Casting Market, 2016-2026
        FIG. 51 South  Korea Aluminum Casting  Market, 2016-2026 (Kilo Tons)
        FIG. 52 South-East Asia Aluminum Casting Market, 2016-2026
        FIG. 53 South-East Asia Aluminum Casting  Market, 2016-2026 (Kilo Tons)
        FIG. 54 Rest of Asia Pacific Aluminum Casting Market, 2016-2026
        FIG. 55 Rest of Asia Pacific Aluminum Casting  Market, 2016-2026 (Kilo Tons)
        FIG. 56 Latin America Aluminum Casting Market, 2016-2026
        FIG. 57 Latin America Aluminum Casting  Market, 2016-2026 (Kilo Tons)
        FIG. 58 Brazil Aluminum Casting Market, 2016-2026
        FIG. 59 Brazil Aluminum Casting  Market, 2016-2026 (Kilo Tons)
        FIG. 60 Mexico Aluminum Casting Market, 2016-2026
        FIG. 61 Mexico Aluminum Casting  Market, 2016-2026 (Kilo Tons)
        FIG. 62 Rest of Latin America Aluminum Casting Market, 2016-2026
        FIG. 63 Rest of Latin America Aluminum Casting  Market, 2016-2026 (Kilo Tons)
        FIG. 64 The Middle-East and Africa Aluminum Casting Market, 2016-2026
        FIG. 65 The Middle-East and Africa Aluminum Casting  Market, 2016-2026 (Kilo Tons)
        FIG. 66 GCC Countries Aluminum Casting Market, 2016-2026
        FIG. 67 GCC Countries Aluminum Casting  Market, 2016-2026 (Kilo Tons)
        FIG. 68 South Africa Aluminum Casting Market, 2016-2026
        FIG. 69 South Africa Aluminum Casting  Market, 2016-2026 (Kilo Tons)
        FIG. 70 Rest of Middle-East Africa Aluminum Casting Market, 2016-2026
        FIG. 71 Rest of Middle-East Africa Aluminum Casting  Market, 2016-2026 (Kilo Tons)
        FIG. 72 Global Aluminum Casting production and revenue, 2016-2026 (USD Million) (Kilo Tons)
        FIG. 73 North America Aluminum Casting production and revenue, 2016-2026 (USD Million) (Kilo Tons)
        FIG. 74 Europe Aluminum Casting production and revenue, 2016-2026 (USD Million) (Kilo Tons)
        FIG. 75 Asia Pacific Aluminum Casting production and revenue, 2016-2026 (USD Million) (Kilo Tons)
        FIG. 76 Latin America Aluminum Casting production and revenue, 2016-2026 (USD Million) (Kilo Tons)
        FIG. 77 Middle East and Africa Aluminum Casting production and revenue, 2016-2026 (USD Million) (Kilo Tons)
        FIG. 78 Competitor Market Share – Revenue
        FIG. 79 Competitor Market Share – Volume
        FIG. 80 Alcoa Corporation Revenue and Growth Rate
        FIG. 81 Alcoa Corporation Market Share
        FIG. 82 Dynacast Revenue and Growth Rate
        FIG. 83 Dynacast Market Share
        FIG. 84 Ryobi Ltd. Revenue and Growth Rate
        FIG. 85 Ryobi Ltd. Market Share
        FIG. 86 Martinrea Honsel Germany GmbH Revenue and Growth Rate
        FIG. 87 Martinrea Honsel Germany GmbH Market Share
        FIG. 88 Alcast Technologies Revenue and Growth Rate
        FIG. 89 Alcast Technologies Market Share
        FIG. 90 Endurance Technologies Limited Revenue and Growth Rate
        FIG. 91 Endurance Technologies Limited Market Share
        FIG. 92 Aluminum Corporation of China Limited Revenue and Growth Rate
        FIG. 93 Aluminum Corporation of China Limited Market Share
        FIG. 94 Bodine Aluminum, Inc. Revenue and Growth Rate
        FIG. 95 Bodine Aluminum, Inc. Market Share
        FIG. 96 Gibbs Die Casting Corporation Revenue and Growth Rate
        FIG. 97 Gibbs Die Casting Corporation Market Share
        FIG. 98 Consolidated Metco, Inc. Revenue and Growth Rate
        FIG. 99 Consolidated Metco, Inc. Market Share
        FIG. 100 Walbro Revenue and Growth Rate
        FIG. 101 Walbro Market Share
        FIG. 102 Market Dynamics
        FIG. 103 Global Aluminum Casting – Value Chain Analysis
        FIG. 104 Key Mandates and Regulations
        FIG. 105 Technology Roadmap and Timeline
        FIG. 106 Market Attractiveness Analysis – By Process
        FIG. 107 Market Attractiveness Analysis – By End-Use
        FIG. 108 Market Attractiveness Analysis – By Region
        FIG. 109 Manufacturing Cost Structure of Aluminum Casting
        FIG. 110 Aluminum Casting Industrial Chain Analysis
        FIG. 111 Market Channel
        FIG. 112 Marketing Channel Development Trend
        FIG. 113 Growth in World Gross Product, 2008-2019
        

        List of Tables

        TABLE 1 Global Aluminum Casting market, 2019 & 2026 (USD Million)
        TABLE 2 Global Aluminum Casting market, by Process, 2016-2026 (USD Million)
        TABLE 3 Global Aluminum Casting market, by Process, 2016-2026 (Kilo Tons)
        TABLE 4 Global Aluminum Casting market, by End-Use, 2016-2026 (USD Million)
        TABLE 5 Global Aluminum Casting market, by End-Use, 2016-2026 (Kilo Tons)
        TABLE 6 Global Aluminum Casting market, by region, 2016-2026 (USD Million)
        TABLE 7 Global Aluminum Casting market, by region, 2016-2026 (Kilo Tons)
        TABLE 8 North America Aluminum Casting Market, by Process, 2016-2026 (USD Million)
        TABLE 9 North America Aluminum Casting Market, by Process, 2016-2026 (Kilo Tons)
        TABLE 10 North America Aluminum Casting Market, by End-Use, 2016-2026 (USD Million)
        TABLE 11 North America Aluminum Casting Market, by End-Use, 2016-2026 (Kilo Tons)
        TABLE 12 Europe Aluminum Casting Market, by Process, 2016-2026 (USD Million)
        TABLE 13 Europe Aluminum Casting Market, by Process, 2016-2026 (Kilo Tons)
        TABLE 14 Europe Aluminum Casting Market, by End-Use, 2016-2026 (USD Million)
        TABLE 15 Europe Aluminum Casting Market, by End-Use, 2016-2026 (Kilo Tons)
        TABLE 16 Asia Pacific Aluminum Casting Market, by Process, 2016-2026 (USD Million)
        TABLE 17 Asia Pacific Aluminum Casting Market, by Process, 2016-2026 (Kilo Tons)
        TABLE 18 Asia Pacific Aluminum Casting Market, by End-Use, 2016-2026 (USD Million)
        TABLE 19 Asia Pacific Aluminum Casting Market, by End-Use, 2016-2026 (Kilo Tons)
        TABLE 20 Latin America Aluminum Casting Market, by Process, 2016-2026 (USD Million)
        TABLE 21 Latin America Aluminum Casting Market, by Process, 2016-2026 (Kilo Tons)
        TABLE 22 Latin America Aluminum Casting Market, by End-Use, 2016-2026 (USD Million)
        TABLE 23 Latin America Aluminum Casting Market, by End-Use, 2016-2026 (Kilo Tons)
        TABLE 24 The Middle-East and Africa Aluminum Casting Market, by Process, 2016-2026 (USD Million)
        TABLE 25 The Middle-East and Africa Aluminum Casting Market, by Process, 2016-2026 (Kilo Tons)
        TABLE 26 The Middle-East and Africa Aluminum Casting Market, by End-Use, 2016-2026 (USD Million)
        TABLE 27 The Middle-East and Africa Aluminum Casting Market, by End-Use, 2016-2026 (Kilo Tons)
        TABLE 28 North America Aluminum Casting Production, Consumption, Export, Import, 2016-2019
        TABLE 29 Europe Aluminum Casting Production, Consumption, Export, Import, 2016-2019
        TABLE 30 Asia Pacific Aluminum Casting Production, Consumption, Export, Import, 2016-2019
        TABLE 31 Latin America Aluminum Casting Production, Consumption, Export, Import, 2016-2019
        TABLE 32 Middle East & Africa Aluminum Casting Production, Consumption, Export, Import, 2016-2019
        TABLE 33 Global Aluminum Casting Market - Company Revenue Analysis 2016-2019 (USD Million)
        TABLE 34 Global Aluminum Casting Market - Company Revenue Share Analysis 2016-2019(%)
        TABLE 35 Global Aluminum Casting Market - Company Volume Analysis 2016-2019 (Kilo Tons)
        TABLE 36 Global Aluminum Casting Market - Company Volume Share Analysis 2016-2019(%)
        TABLE 37 Acquisitions and Mergers
        TABLE 38 New Product/Service Launch
        TABLE 39 Research & Development Activities
        TABLE 40 Market Drivers
        TABLE 41 Market Restraints
        TABLE 42 Market Opportunities
        TABLE 43 Production Base and Market Concentration Rate of Raw Material
        TABLE 44 Key Suppliers of Raw Materials
        TABLE 45 Raw Materials Sources of Aluminum Casting Major Manufacturers in 2016
        TABLE 46 Major Buyers of Aluminum Casting
        TABLE 47 Distributors/Traders of Aluminum Casting by Region

Industry Major Market Players

  •  Alcoa Corporation
  •  Dynacast
  •  Ryobi Ltd.
  •  Martinrea Honsel Germany GmbH
  •  Alcast Technologies
  •  Endurance Technologies Limited
  •  Aluminum Corporation of China Limited
  •  Bodine Aluminum Inc.
  •  Gibbs Die Casting Corporation
  •  Consolidated Metco Inc.
  •  Walbro