Search Market Research Report

Discover Our Latest Reports
Discover Our Featured Reports
Discover Top Selling Reports

Allulose Market Size, Share Global Analysis Report, 2021 – 2026

report img

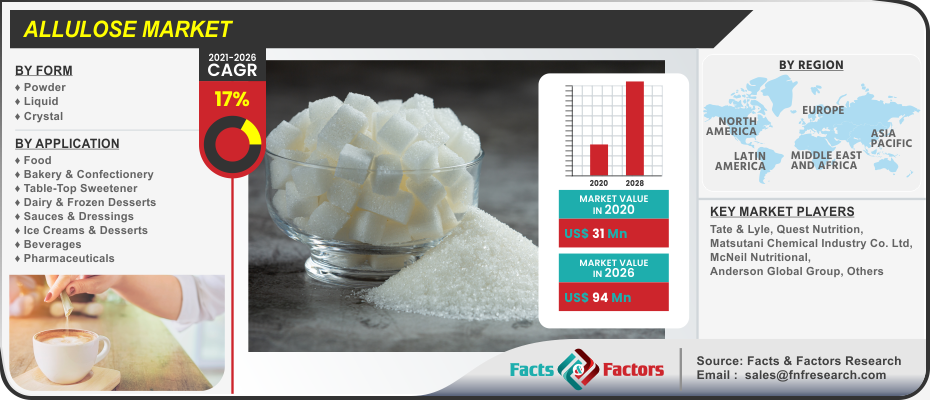
Allulose Market By Form (Powder, Liquid, & Crystal), By Application (Food, Bakery & Confectionery, Table-Top Sweetener, Dairy & Frozen Desserts, Sauces & Dressings, Ice Creams & Desserts, Beverages, & Pharmaceuticals), And By Regions - Global & Regional Industry Perspective, Comprehensive Analysis, and Forecast 2021 – 2026

Industry Insights

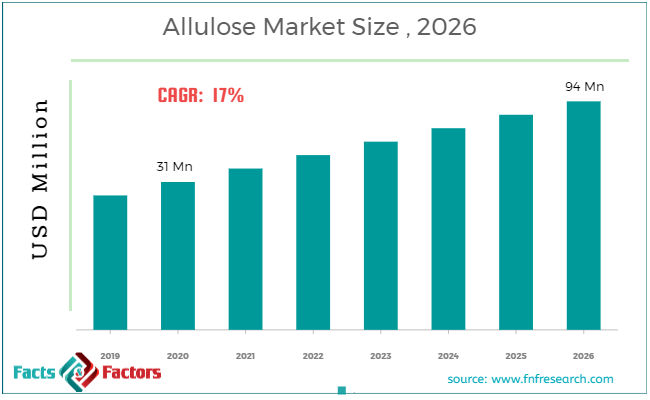
[198+ Pages Report] The latest finding surrounding the Global Allulose Market published by Facts & Factors offers a neatly packaged and comprehensive read. We at Facts & Factors estimated that the global allulose market will reach a projected value of USD 94 Million by 2026 with a growth rate of 17% CAGR from an initial value of USD 31 Million in the year 2020.

Allulose Market Size

To know more about this report | Request Free Sample Copy

logoMarket Overview

Allulose or D-Psicose or D-allulose is a form of low-calorie based monosaccharide sugar and is used in the sector of commercial food & beverage for presenting a tinge of sweetness in these ingredients. Allulose is further estimated to be 70% sweeter than the original sucrose-based sugar. Most of the commercial-based cellulose is extracted from corn and is used for yogurt, ice creams, baked goods, and other forms of high calorific value.

logoKey Insights from Primary Research

  • As per our primary respondents, the Australia allulose market is set to grow annually at a rate of around 17%.
  • It was established through primary research that the Australia allulose market was valued at around USD 31 Million in 2020.
  • In terms of volume, the Australiaallulose market stood at approximately 450 Tons, in 2019.
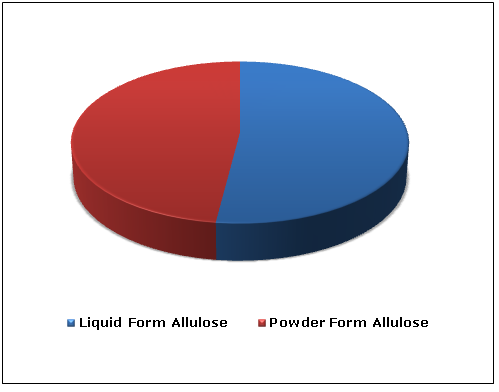
  • The “powder form allulose” category, on the basis of type segmentation, was the leading revenue-generating category accounting for more than 50% share, in 2019.
  • On the basis of application segmentation, the “dairy” category held the leading share at more than 20%, in 2019

logoKey Recommendations from Analysts

  • As per our analysts, the allulose market in Australia is not popular for many. Only concerning industries such as Beverages and Confectionery industries are aware of this potential market.
  • Growing at a CAGR of around 9%, Australiaallulose market provides numerous opportunities for all of the involved stakeholders across the entire value chain
  • Our analysts have identified “powder form allulose” and “beverages” categories as the leading investment pockets for Australiaallulose market in terms of type and application segmentations respectively

logoMarket Attractiveness – By Type

Allulose-Market-by-Aircraft-Type

To know more about this report | Request Free Sample Copy

logoIndustry Growth Factors

The driving forces for the global allulose market are the rising trend of low-calorie consumption of food articles coupled with reduced usage of sugar to name a few. Additionally, rising consumer awareness regarding health consciousness coupled with rising urbanization measures is expected to increase the footprint of the global allulose market during the advent of the forecast period. Moreover, the rising health issues due to increased consumption of sugar coupled with decreased usage of synthetic sweeteners are expected to fuel the growth of the global allulose market during the forecast period.

The global allulose market is expected to be driven due to the rising focus of the key market participants on advancing research & development activities coupled with an increasing number of diabetes patients to name a few. The launching of new products comprised of new flavors, ingredients, and textures is expected to fuel the growth of the global allulose market during the advent of the forecast duration. However, a higher cost of processing of allulose when compared to its counterparts and fluctuation prices of raw materials is expected to decrease the growth of the global allulose market during the advent of the forecast period.

Allulose Market

To know more about this report | Request Free Sample Copy

logoSegmentation Analysis

The global allulose market is segmented into form, application, and region.

On the basis of form, the global allulose market is divided into powder, liquid, and crystal. The segment pertaining to powder is expected to witness the largest market share during the advent of the forecast owing to increasing usage of the latter due to a well-blended form into yogurts, smoothies, and other drinks when compared to its counterparts coupled with rising use case scenarios among bakery based items such as biscuits, cakes, rye bread, and meat dishes to name a few. Based on application, the global allulose market is categorized into food, bakery & confectionery, table-top sweetener, dairy & frozen desserts, sauces &dressings, ice creams & desserts, beverages, and pharmaceuticals.

The bakery & confectionery foods category is expected to witness the largest market share during the advent of the forecast owing to factors pertaining to improved moisture content, increased water retention rate, and softness upon usage to name a few. Additionally, changing lifestyle of consumers coupled with rising product adoption in terms of bread, pastries, and cakes is expected to cement the dominant market share of the latter during the advent of the forecast period.

logo Report Scope

Report Attribute

Details

Market Size in 2020

USD 31 Million

Projected Market Size in 2026

USD 94 Million

CAGR Growth Rate

17% CAGR

Base Year

2020

Forecast Years

2021-2026

Key Market Players

Tate & Lyle, Quest Nutrition, Matsutani Chemical Industry Co. Ltd, McNeil Nutritional, Anderson Global Group, CJ Cheil Jedang, Cargill, Inc., Ingredion Incorporated, and Apura Ingredients, among others.

Key Segments

Form, Applications, and Region

Major Regions Covered

North America, Europe, Asia Pacific, Latin America, and Middle East & Africa

Purchase Options

Request customized purchase options to meet your research needs. Explore purchase options

logo Regional Analysis

North America is expected to witness the largest market share during the advent of the forecast owing to rising demand for allulose-based products in the food & beverage sector coupled with changing food preferences of the population to name a few. Additionally, shifting consumer preference toward a healthier outlook and habits coupled with favorable government regulations is expected to increase the footprint of the allulose market during the advent of the forecast period. Europe is expected to occupy a substantial market share after the latter region owing to recognizance of lack of serious side effects by allulose products by Europe’s regulatory bodies coupled with increasing product safety to name a few. Additionally, new product launches coupled with increasing distribution channels in the region will further upend the allulose market toward a higher consumer base.

logo Competitive Players

The key market participants for the global allulose market are :

  • Tate & Lyle
  • Quest Nutrition
  • Matsutani Chemical Industry Co. Ltd
  • McNeil Nutritional
  • Anderson Global Group
  • CJ Cheil Jedang
  • Cargill Inc.
  • Ingredion Incorporated
  • Apura Ingredients
  • among others

logo By Form Segment Analysis

  • Powder
  • Liquid
  • Crystal

logo By Application Segment Analysis

  • Food
  • Bakery & Confectionery
  • Table-Top Sweetener
  • Dairy & Frozen Desserts
  • Sauces & Dressings
  • Ice Creams & Desserts
  • Beverages
  • Pharmaceuticals

logo By Regional Segment Analysis

  • North America
    • U.S.
    • Canada
  • Europe
    • UK
    • France
    • Germany
    • Italy
    • Spain
    • Rest of Europe
  • Asia Pacific
    • China
    • Japan
    • India
    • South Korea
    • Southeast Asia
    • Rest of Asia Pacific
  • Latin America
    • Brazil
    • Mexico
    • Rest of Latin America
  • Middle East and Africa
    • GCC Countries
    • South Africa
    • Rest of MEA

Table of Content

  1. Chapter 1 Executive Summary
    1. 1.1. Introduction of Allulose
    2. 1.2. Global Allulose Market, 2019 & 2026 (USD Million)
    3. 1.3. Global Allulose Market, 2016 – 2026 (USD Million)
    4. 1.4. Global Allulose Market Absolute Revenue Opportunity, 2016 – 2026 (USD Million)
    5. 1.5. Global Allulose Market Incremental Revenue Opportunity, 2020 – 2026 (USD Million)
  2. Chapter 2 Allulose Market – Form Analysis
    1. 2.1. Global Allulose Market – Form Overview
    2. 2.2. Global Allulose Market Share, by Form, 2019 & 2026 (USD Million)
    3. 2.3. Powder
      1. 2.3.1. Global Powder Allulose Market, 2016 – 2026 (USD Million)
    4. 2.4. Liquid
      1. 2.4.1. Global Liquid Allulose Market, 2016 – 2026 (USD Million)
    5. 2.5. Crystal
      1. 2.5.1. Global Crystal Allulose Market, 2016 – 2026 (USD Million)
  3. Chapter 3 Allulose Market – Application Analysis
    1. 3.1. Global Allulose Market – Application Overview
    2. 3.2. Global Allulose Market Share, by Application, 2019 & 2026 (USD Million)
    3. 3.3. Food
      1. 3.3.1. Global Food Allulose Market, 2016 – 2026 (USD Million)
    4. 3.4. Bakery & Confectionery
      1. 3.4.1. Global Bakery & Confectionery Allulose Market, 2016 – 2026 (USD Million)
    5. 3.5. Table-Top Sweetener
      1. 3.5.1. Global Table-Top Sweetener Allulose Market, 2016 – 2026 (USD Million)
    6. 3.6. Dairy & Frozen Desserts
      1. 3.6.1. Global Dairy & Frozen Desserts Allulose Market, 2016 – 2026 (USD Million)
    7. 3.7. Sauces & Dressings
      1. 3.7.1. Global Sauces & Dressings Allulose Market, 2016 – 2026 (USD Million)
    8. 3.8. Ice Creams & Desserts
      1. 3.8.1. Global Ice Creams & Desserts Allulose Market, 2016 – 2026 (USD Million)
    9. 3.9. Beverages
      1. 3.9.1. Global Beverages Allulose Market, 2016 – 2026 (USD Million)
    10. 3.10. Pharmaceuticals
      1. 3.10.1. Global Pharmaceuticals Allulose Market, 2016 – 2026 (USD Million)
  4. Chapter 4 Allulose Market – Regional Analysis
    1. 4.1. Global Allulose Market Regional Overview
    2. 4.2. Global Allulose Market Share, by Region, 2019 & 2026 (USD Million)
    3. 4.3. North America
      1. 4.3.1. North America Allulose Market, 2016 – 2026 (USD Million)
        1. 4.3.1.1. North America Allulose Market, by Country, 2016 - 2026 (USD Million)
      2. 4.3.2. North America Allulose Market, by Form, 2016 – 2026
        1. 4.3.2.1. North America Allulose Market, by Form, 2016 – 2026 (USD Million)
      3. 4.3.3. North America Allulose Market, by Application, 2016 – 2026
        1. 4.3.3.1. North America Allulose Market, by Application, 2016 – 2026 (USD Million)
      4. 4.3.4. U.S.
        1. 4.3.4.1. U.S. Allulose Market, 2016 – 2026 (USD Million)
      5. 4.3.5. Canada
        1. 4.3.5.1. Canada Allulose Market, 2016 – 2026 (USD Million)
    4. 4.4. Europe
      1. 4.4.1. Europe Allulose Market, 2016 – 2026 (USD Million)
        1. 4.4.1.1. Europe Allulose Market, by Country, 2016 - 2026 (USD Million)
      2. 4.4.2. Europe Allulose Market, by Form, 2016 – 2026
        1. 4.4.2.1. Europe Allulose Market, by Form, 2016 – 2026 (USD Million)
      3. 4.4.3. Europe Allulose Market, by Application, 2016 – 2026
        1. 4.4.3.1. Europe Allulose Market, by Application, 2016 – 2026 (USD Million)
      4. 4.4.4. Germany
        1. 4.4.4.1. Germany Allulose Market, 2016 – 2026 (USD Million)
      5. 4.4.5. France
        1. 4.4.5.1. France Allulose Market, 2016 – 2026 (USD Million)
      6. 4.4.6. U.K.
        1. 4.4.6.1. U.K. Allulose Market, 2016 – 2026 (USD Million)
      7. 4.4.7. Italy
        1. 4.4.7.1. Italy Allulose Market, 2016 – 2026 (USD Million)
      8. 4.4.8. Spain
        1. 4.4.8.1. Spain Allulose Market, 2016 – 2026 (USD Million)
      9. 4.4.9. Rest of Europe
        1. 4.4.9.1. Rest of Europe Allulose Market, 2016 – 2026 (USD Million)
    5. 4.5. Asia Pacific
      1. 4.5.1. Asia Pacific Allulose Market, 2016 – 2026 (USD Million)
        1. 4.5.1.1. Asia Pacific Allulose Market, by Country, 2016 - 2026 (USD Million)
      2. 4.5.2. Asia Pacific Allulose Market, by Form, 2016 – 2026
        1. 4.5.2.1. Asia Pacific Allulose Market, by Form, 2016 – 2026 (USD Million)
      3. 4.5.3. Asia Pacific Allulose Market, by Application, 2016 – 2026
        1. 4.5.3.1. Asia Pacific Allulose Market, by Application, 2016 – 2026 (USD Million)
      4. 4.5.4. China
        1. 4.5.4.1. China Allulose Market, 2016 – 2026 (USD Million)
      5. 4.5.5. Japan
        1. 4.5.5.1. Japan Allulose Market, 2016 – 2026 (USD Million)
      6. 4.5.6. India
        1. 4.5.6.1. India Allulose Market, 2016 – 2026 (USD Million)
      7. 4.5.7. South Korea
        1. 4.5.7.1. South Korea Allulose Market, 2016 – 2026 (USD Million)
      8. 4.5.8. South-East Asia
        1. 4.5.8.1. South-East Asia Allulose Market, 2016 – 2026 (USD Million)
      9. 4.5.9. Rest of Asia Pacific
        1. 4.5.9.1. Rest of Asia Pacific Allulose Market, 2016 – 2026 (USD Million)
    6. 4.6. Latin America
      1. 4.6.1. Latin America Allulose Market, 2016 – 2026 (USD Million)
        1. 4.6.1.1. Latin America Allulose Market, by Country, 2016 - 2026 (USD Million)
      2. 4.6.2. Latin America Allulose Market, by Form, 2016 – 2026
        1. 4.6.2.1. Latin America Allulose Market, by Form, 2016 – 2026 (USD Million)
      3. 4.6.3. Latin America Allulose Market, by Application, 2016 – 2026
        1. 4.6.3.1. Latin America Allulose Market, by Application, 2016 – 2026 (USD Million)
      4. 4.6.4. Brazil
        1. 4.6.4.1. Brazil Allulose Market, 2016 – 2026 (USD Million)
      5. 4.6.5. Mexico
        1. 4.6.5.1. Mexico Allulose Market, 2016 – 2026 (USD Million)
      6. 4.6.6. Rest of Latin America
        1. 4.6.6.1. Rest of Latin America Allulose Market, 2016 – 2026 (USD Million)
    7. 4.7. The Middle-East and Africa
      1. 4.7.1. The Middle-East and Africa Allulose Market, 2016 – 2026 (USD Million)
        1. 4.7.1.1. The Middle-East and Africa Allulose Market, by Country, 2016 - 2026 (USD Million)
      2. 4.7.2. The Middle-East and Africa Allulose Market, by Form, 2016 – 2026
        1. 4.7.2.1. The Middle-East and Africa Allulose Market, by Form, 2016 – 2026 (USD Million)
      3. 4.7.3. The Middle-East and Africa Allulose Market, by Application, 2016 – 2026
        1. 4.7.3.1. The Middle-East and Africa Allulose Market, by Application, 2016 – 2026 (USD Million)
      4. 4.7.4. GCC Countries
        1. 4.7.4.1. GCC Countries Allulose Market, 2016 – 2026 (USD Million)
      5. 4.7.5. South Africa
        1. 4.7.5.1. South Africa Allulose Market, 2016 – 2026 (USD Million)
      6. 4.7.6. Rest of Middle-East Africa
        1. 4.7.6.1. Rest of Middle-East Africa Allulose Market, 2016 – 2026 (USD Million)
  5. Chapter 5 Allulose Market – Competitive Landscape
    1. 5.1. Competitor Market Share – Revenue
    2. 5.2. Market Concentration Rate Analysis, Top 3 and Top 5 Players
    3. 5.3. Strategic Developments
      1. 5.3.1. Acquisitions and Mergers
      2. 5.3.2. New Products
      3. 5.3.3. Research & Development Activities
  6. Chapter 6 Company Profiles
    1. 6.1. Tate & Lyle
      1. 6.1.1. Company Overview
      2. 6.1.2. Product/Service Portfolio
      3. 6.1.3. Tate & Lyle Sales, Revenue, and Gross Margin
      4. 6.1.4. Tate & Lyle Revenue and Growth Rate
      5. 6.1.5. Tate & Lyle Market Share
      6. 6.1.6. Recent Initiatives, Funding/VC Activities, and Technological Innovations
    2. 6.2. Quest Nutrition
      1. 6.2.1. Company Overview
      2. 6.2.2. Product/Service Portfolio
      3. 6.2.3. Quest Nutrition Sales, Revenue, and Gross Margin
      4. 6.2.4. Quest Nutrition Revenue and Growth Rate
      5. 6.2.5. Quest Nutrition Market Share
      6. 6.2.6. Recent Initiatives, Funding/VC Activities, and Technological Innovations
    3. 6.3. Matsutani Chemical Industry Co. Ltd
      1. 6.3.1. Company Overview
      2. 6.3.2. Product/Service Portfolio
      3. 6.3.3. Matsutani Chemical Industry Co. Ltd Sales, Revenue, and Gross Margin
      4. 6.3.4. Matsutani Chemical Industry Co. Ltd Revenue and Growth Rate
      5. 6.3.5. Matsutani Chemical Industry Co. Ltd Market Share
      6. 6.3.6. Recent Initiatives, Funding/VC Activities, and Technological Innovations
    4. 6.4. McNeil Nutritional
      1. 6.4.1. Company Overview
      2. 6.4.2. Product/Service Portfolio
      3. 6.4.3. McNeil Nutritional Sales, Revenue, and Gross Margin
      4. 6.4.4. McNeil Nutritional Revenue and Growth Rate
      5. 6.4.5. McNeil Nutritional Market Share
      6. 6.4.6. Recent Initiatives, Funding/VC Activities, and Technological Innovations
    5. 6.5. Anderson Global Group
      1. 6.5.1. Company Overview
      2. 6.5.2. Product/Service Portfolio
      3. 6.5.3. Anderson Global Group Sales, Revenue, and Gross Margin
      4. 6.5.4. Anderson Global Group Revenue and Growth Rate
      5. 6.5.5. Anderson Global Group Market Share
      6. 6.5.6. Recent Initiatives, Funding/VC Activities, and Technological Innovations
    6. 6.6. CJ Cheil Jedang
      1. 6.6.1. Company Overview
      2. 6.6.2. Product/Service Portfolio
      3. 6.6.3. CJ Cheil Jedang Sales, Revenue, and Gross Margin
      4. 6.6.4. CJ Cheil Jedang Revenue and Growth Rate
      5. 6.6.5. CJ Cheil Jedang Market Share
      6. 6.6.6. Recent Initiatives, Funding/VC Activities, and Technological Innovations
    7. 6.7. Cargill Inc
      1. 6.7.1. Company Overview
      2. 6.7.2. Product/Service Portfolio
      3. 6.7.3. Cargill Inc Sales, Revenue, and Gross Margin
      4. 6.7.4. Cargill Inc Revenue and Growth Rate
      5. 6.7.5. Cargill Inc Market Share
      6. 6.7.6. Recent Initiatives, Funding/VC Activities, and Technological Innovations
    8. 6.8. Ingredion Incorporated
      1. 6.8.1. Company Overview
      2. 6.8.2. Product/Service Portfolio
      3. 6.8.3. Ingredion Incorporated Sales, Revenue, and Gross Margin
      4. 6.8.4. Ingredion Incorporated Revenue and Growth Rate
      5. 6.8.5. Ingredion Incorporated Market Share
      6. 6.8.6. Recent Initiatives, Funding/VC Activities, and Technological Innovations
    9. 6.9. Apura Ingredients
      1. 6.9.1. Company Overview
      2. 6.9.2. Product/Service Portfolio
      3. 6.9.3. Apura Ingredients Sales, Revenue, and Gross Margin
      4. 6.9.4. Apura Ingredients Revenue and Growth Rate
      5. 6.9.5. Apura Ingredients Market Share
      6. 6.9.6. Recent Initiatives, Funding/VC Activities, and Technological Innovations
  7. Chapter 7 Allulose — Industry Analysis
    1. 7.1. Introduction and Taxonomy
    2. 7.2. Allulose Market – Key Trends
      1. 7.2.1. Market Drivers
      2. 7.2.2. Market Restraints
      3. 7.2.3. Market Opportunities
    3. 7.3. Value Chain Analysis
    4. 7.4. Key Mandates and Regulations
    5. 7.5. Technology Roadmap and Timeline
    6. 7.6. Allulose Market – Attractiveness Analysis
      1. 7.6.1. By Form
      2. 7.6.2. By Application
      3. 7.6.3. By Region
  8. Chapter 8 Industrial Chain, Sourcing Strategy, and Downstream Buyers
    1. 8.1. Allulose Industrial Chain Analysis
    2. 8.2. Downstream Buyers
    3. 8.3. Distributors/Traders List
  9. Chapter 9 Marketing Strategy Analysis
    1. 9.1. Marketing Channel
    2. 9.2. Direct Marketing
    3. 9.3. Indirect Marketing
    4. 9.4. Marketing Channel Development Trends
    5. 9.5. Economic/Political Environmental Change
  10. Chapter 10 Report Conclusion & Key Insights
    1. 10.1. Key Insights from Primary Interviews & Surveys Respondents
    2. 10.2. Key Takeaways from Analysts, Consultants, and Industry Leaders
  11. Chapter 11 Research Approach & Methodology
    1. 11.1. Report Description
    2. 11.2. Research Scope
    3. 11.3. Research Methodology
      1. 11.3.1. Secondary Research
      2. 11.3.2. Primary Research
      3. 11.3.3. Statistical Models
        1. 11.3.3.1. Company Share Analysis Model
        2. 11.3.3.2. Revenue Based Modeling
      4. 11.3.4. Research Limitations

      List of Figures

      Fig.1	Product Picture of Allulose
      Fig.2	Global Allulose Market, 2016 – 2026 (USD Million)
      Fig.3	Global Allulose Market Absolute Revenue Opportunity, 2016 – 2026 (USD Million)
      Fig.4	Global Allulose Market Incremental Revenue Opportunity, 2020 – 2026 (USD Million)
      Fig.5	Global Allulose Market Share, by Form, 2019 & 2026 (USD Million)
      Fig.6	Global Powder  Allulose Market, 2016 – 2026 (USD Million)
      Fig.7	Global Liquid  Allulose Market, 2016 – 2026 (USD Million)
      Fig.8	Global Crystal Allulose Market, 2016 – 2026 (USD Million)
      Fig.9	Global Allulose Market Share, by Application, 2019 & 2026 (USD Million)
      Fig.10	Global Food  Allulose Market, 2016 – 2026 (USD Million)
      Fig.11	Global Bakery & Confectionery  Allulose Market, 2016 – 2026 (USD Million)
      Fig.12	Global Table-Top Sweetener  Allulose Market, 2016 – 2026 (USD Million)
      Fig.13	Global Dairy & Frozen Desserts Allulose Market, 2016 – 2026 (USD Million)
      Fig.14	Global Sauces & Dressings  Allulose Market, 2016 – 2026 (USD Million)
      Fig.15	Global Ice Creams & Desserts Allulose Market, 2016 – 2026 (USD Million)
      Fig.16	Global Beverages  Allulose Market, 2016 – 2026 (USD Million)
      Fig.17	Global Pharmaceuticals Allulose Market, 2016 – 2026 (USD Million)
      Fig.18	Global Allulose Market Share, by Region, 2019 & 2026 (USD Million)
      Fig.19	North America Allulose Market, 2016 – 2026 (USD Million)
      Fig.20	U.S. Allulose Market, 2016 – 2026 (USD Million)
      Fig.21	Canada Allulose Market, 2016 – 2026 (USD Million)
      Fig.22	Europe Allulose Market, 2016 – 2026 (USD Million)
      Fig.23	Germany Allulose Market, 2016 – 2026 (USD Million)
      Fig.24	France Allulose Market, 2016 – 2026 (USD Million)
      Fig.25	U.K. Allulose Market, 2016 – 2026 (USD Million)
      Fig.26	Italy Allulose Market, 2016 – 2026 (USD Million)
      Fig.27	Spain Allulose Market, 2016 – 2026 (USD Million)
      Fig.28	Rest of Europe Allulose Market, 2016 – 2026 (USD Million)
      Fig.29	Asia Pacific Allulose Market, 2016 – 2026 (USD Million)
      Fig.30	China Allulose Market, 2016 – 2026 (USD Million)
      Fig.31	Japan Allulose Market, 2016 – 2026 (USD Million)
      Fig.32	India Allulose Market, 2016 – 2026 (USD Million)
      Fig.33	South  Korea Allulose Market, 2016 – 2026 (USD Million)
      Fig.34	South-East Asia Allulose Market, 2016 – 2026 (USD Million)
      Fig.35	Rest of Asia Pacific Allulose Market, 2016 – 2026 (USD Million)
      Fig.36	Latin America Allulose Market, 2016 – 2026 (USD Million)
      Fig.37	Brazil Allulose Market, 2016 – 2026 (USD Million)
      Fig.38	Mexico Allulose Market, 2016 – 2026 (USD Million)
      Fig.39	Rest of Latin America Allulose Market, 2016 – 2026 (USD Million)
      Fig.40	The Middle-East and Africa Allulose Market, 2016 – 2026 (USD Million)
      Fig.41	GCC Countries Allulose Market, 2016 – 2026 (USD Million)
      Fig.42	South Africa Allulose Market, 2016 – 2026 (USD Million)
      Fig.43	Rest of Middle-East Africa Allulose Market, 2016 – 2026 (USD Million)
      Fig.44	Competitor Market Share – Revenue
      Fig.45	Tate & Lyle Revenue and Growth Rate
      Fig.46	Tate & Lyle Market Share
      Fig.47	Quest Nutrition Revenue and Growth Rate
      Fig.48	Quest Nutrition Market Share
      Fig.49	Matsutani Chemical Industry Co. Ltd Revenue and Growth Rate
      Fig.50	Matsutani Chemical Industry Co. Ltd Market Share
      Fig.51	McNeil Nutritional Revenue and Growth Rate
      Fig.52	McNeil Nutritional Market Share
      Fig.53	Anderson Global Group Revenue and Growth Rate
      Fig.54	Anderson Global Group Market Share
      Fig.55	CJ Cheil Jedang Revenue and Growth Rate
      Fig.56	CJ Cheil Jedang Market Share
      Fig.57	Cargill Inc Revenue and Growth Rate
      Fig.58	Cargill Inc Market Share
      Fig.59	Ingredion Incorporated Revenue and Growth Rate
      Fig.60	Ingredion Incorporated Market Share
      Fig.61	Apura Ingredients Revenue and Growth Rate
      Fig.62	Apura Ingredients Market Share
      Fig.63	Market Dynamics
      Fig.64	Global Allulose – Value Chain Analysis
      Fig.65	Key Mandates and Regulations
      Fig.66	Technology Roadmap and Timeline
      Fig.67	Market Attractiveness Analysis – By Form
      Fig.68	Market Attractiveness Analysis – By Application
      Fig.69	Market Attractiveness Analysis – By Region
      Fig.70	Allulose Industrial Chain Analysis
      Fig.71	Market Channels
      Fig.72	Marketing Channel Development Trend
      Fig.73	Growth in World Gross Product, 2008-2018
      

      List of Tables

      Table 1	Global Allulose Market, 2019 & 2026 (USD Million)
      Table 2	Global Allulose Market, by Form, 2016 – 2026 (USD Million)
      Table 3	Global Allulose Market, by Application, 2016 – 2026 (USD Million)
      Table 4	Global Allulose Market, by Region, 2016 – 2026 (USD Million)
      Table 5	North America Allulose Market, by Country, 2016 – 2026 (USD Million)
      Table 6	North America Allulose Market, by Form, 2016 – 2026 (USD Million)
      Table 7	North America Allulose Market, by Application, 2016 – 2026 (USD Million)
      Table 8	Europe Allulose Market, by Country, 2016 – 2026 (USD Million)
      Table 9	Europe Allulose Market, by Form, 2016 – 2026 (USD Million)
      Table 10 Europe Allulose Market, by Application, 2016 – 2026 (USD Million)
      Table 11 Asia Pacific Allulose Market, by Country, 2016 – 2026 (USD Million)
      Table 12 Asia Pacific Allulose Market, by Form, 2016 – 2026 (USD Million)
      Table 13 Asia Pacific Allulose Market, by Application, 2016 – 2026 (USD Million)
      Table 14 Latin America Allulose Market, by Country, 2016 – 2026 (USD Million)
      Table 15 Latin America Allulose Market, by Form, 2016 – 2026 (USD Million)
      Table 16 Latin America Allulose Market, by Application, 2016 – 2026 (USD Million)
      Table 17 The Middle-East and Africa Allulose Market, by Country, 2016 – 2026 (USD Million)
      Table 18 The Middle-East and Africa Allulose Market, by Form, 2016 – 2026 (USD Million)
      Table 19 The Middle-East and Africa Allulose Market, by Application, 2016 – 2026 (USD Million)
      Table 20 Global Allulose Market - Company Revenue Analysis, 2016 – 2019 (USD Million)
      Table 21 Global Allulose Market - Company Revenue Share Analysis, 2016 – 2019 (%)
      Table 22 Acquisitions and Mergers
      Table 23 Market Drivers – Impact Analysis
      Table 24 Market Restraints
      Table 25 Market Opportunities
      Table 26 Major Buyers of Allulose
      Table 27 Distributors/Traders of Allulose by Region
      

Industry Major Market Players

  • Tate & Lyle
  • Quest Nutrition
  • Matsutani Chemical Industry Co. Ltd
  • McNeil Nutritional
  • Anderson Global Group
  • CJ Cheil Jedang
  • Cargill Inc.
  • Ingredion Incorporated
  • Apura Ingredients