Search Market Research Report

Discover Our Latest Reports
Discover Our Featured Reports
Discover Top Selling Reports

Aircraft Filters Market Size, Share Global Analysis Report, 2021–2026

report img

Aircraft Filters Market by Aircraft Type (Unmanned Aerial Vehicles (UAVs), Rotary Wing, and Fixed Wing), by Sales Channel (Aftermarket and Original Equipment Manufacturer (OEM)), by Type (Air Filter, Avionics Filters, Cabin Air Filters, Odour Absorbing Filters, Engine Air Intake Filters, Fuel and Oil & Lube Filters, Hydraulic Filters, and Others (Noise Filter, and Specialty Filters)), by Application (Hydraulic System, Engine, Avionics, Pneumatic System, and Cabin), by Material (Aluminium and Plastic), by Vertical (Military Aviation, Business Aviation, Commercial Aviation, and Others), and by Regions: Global & Regional Industry Outlook, Market Size, Business Intelligence, Consumer Preferences, Statistical Surveys, Comprehensive Analysis, Historical Developments, Current Trends, and Forecast 2021–2026

Industry Insights

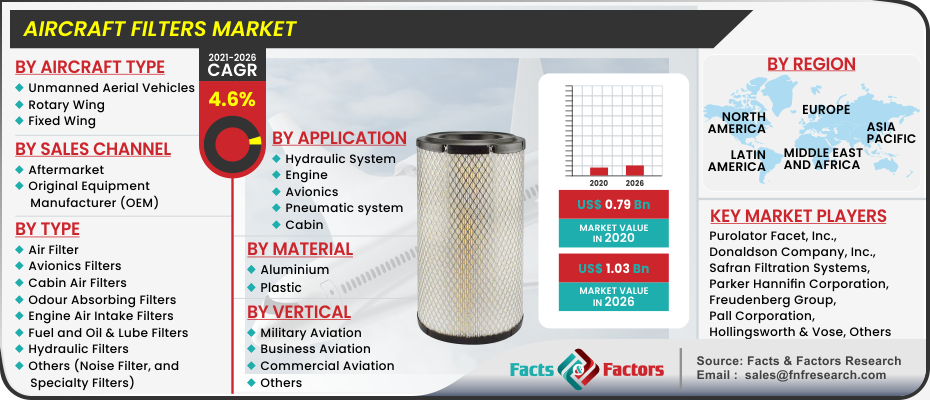
[197+ Pages Report] According to the report published by Facts and Factors, The global aircraft filters market was worth USD 0.79 Billion in 2020 and is expected to be worth about USD 1.03 Billion by 2026, growing at a CAGR of 4.6% from 2021 to 2026. The report analyzes the aircraft filters market’s drivers, restraints, and challenges and the effect they have on the demands during the projection period. In addition, the report explores emerging opportunities in the aircraft filters market.

logoMarket Overview

Filters are pieces of equipment that keep dirt, solid particles, and debris out of aircraft engines, hydraulic systems, aircraft cylinders, cabins, and other areas. Air filters are extremely important for aircraft maintenance and efficiency. It aids in improving performance and efficiency, as well as supplying passengers with clean air. These filters aid in the reduction of maintenance expenses while also ensuring a safer and more efficient functioning.

Specific filters are available from a variety of vendors that may be utilized in low-temperature situations without the use of antifreeze or mechanical heating devices. Some of the primary factors driving the growth of the Global Aircraft Filters Market during the forecast period include rising disposable income of a constantly expanding population around the world, especially in developing economies, rising demand for aircraft, rising demand for replacement aerospace filters, rising demand for UAVs, and increasing regulations on aircraft emissions. Aircraft filters are made up of filtering materials that aid in the separation of contaminants from fuels as well as the prevention of fuel pollution.

Aircraft Filters Market

To know more about this report | Request Free Sample Copy

logoIndustry Growth Factors

Factors such as increased passenger traffic, rising demand for aircraft from major countries in Asia-Pacific, Latin America, and the Middle East & Africa region, and short aircraft filter replacement cycles are expected to boost the global aircraft filter market. Over the forecast period, increased demand for speciality aircraft filters, such as microfilters, and new aircraft for military applications are expected to boost the global aircraft filter market.

A key aspect driving demand in the MRO segment is the short replacement cycle of an aircraft filter. An airplane filter's replacement cycle is determined by the number of flight hours and calendar days (whichever occurs first). This cycle can last anywhere from 6 months to 18 months, with 300 to 3,500 flying hours. A high volume of passengers entails a high number of filter cycles for the airplane.

logoCOVID-19 Impact on Aerospace Filter Market

In 2020, the COVID-19 epidemic became a global disaster, affecting the aviation industry's income, traffic, and connection. Airlines have been particularly hard hit, since they have been unable to recoup their capital and operational expenditures as a result of flight cancellations. This has generated a unique set of risks to airport operations and is hindering continued growth, affecting aerospace filter sales as well.

Furthermore, manufacturing and supply chain operations are not permitted, resulting in minimal cash flow among sector participants. This has resulted in a slight decrease in aircraft component sales and has had a significant influence on the aircraft filter industry.

logoSegmentation Analysis

The aircraft filters market is divided into two segments based on the sales channel for aircraft filters: aftermarket and original equipment manufacturer (OEM). The OEM sector is predicted to develop at the quickest CAGR in the aviation filters market during the forecast period. OEMs acquire aircraft filters from their manufacturers. The reorganization and growth of airlines' fleets is likely to boost new aircraft sales, which will drive OEM demand for filters.

Additionally, the aircraft filters market is segmented into types by air filters, avionics filters, cabin air filters, odour absorbing filters, engine air intake filters, fuel and oil & lube filters, hydraulic filters, and others based on the kind of aircraft filter (noise filter, and specialty filters).

The aircraft filters market can be segmented into hydraulic system, engine, avionics, pneumatic system, and cabin based on the application of aircraft filters. Moreover, the aircraft filters market can be segmented into two segments based on the material used in the aircraft filters: aluminium and plastic.

The aircraft filters market can be segmented into military aviation, business aviation, commercial aviation, and others based on the vertical of aircraft filters. Among the vertical categories, filter installed in military aviation are anticipated to acquire more than 40% of the market share in 2020. Demand for military aircraft has surged owing to rising spending on the defence industry across several major and emerging economies such as the U.S., India, China, and Russia.

logoReport Scope

Report Attribute

Details

Market Size in 2020

USD 0.79 Billion

Projected Market Size in 2026

USD 1.03 Billion

CAGR Growth Rate

4.6% CAGR

Base Year

2020

Forecast Years

2021-2026

Key Market Players

Purolator Facet, Inc., Donaldson Company, Inc., Safran Filtration Systems, Parker Hannifin Corporation, Freudenberg Group, Pall Corporation, Hollingsworth & Vose, Porvair plc. Recco Products, Inc., and Champion Aerospace, LLC., among others

Key Segment

By Aircraft Type, By Sales Channel, By Type, By Application, By Material, By Vertical, and By Region

Major Regions Covered

North America, Europe, Asia Pacific, Latin America, and the Middle East & Africa

Purchase Options

Request customized purchase options to meet your research needs. Explore purchase options

logo Regional Analysis

During the forecast period, North America is expected to hold the highest regional share of the aircraft filters market. In North America, the market is in its early stages, with significant aircraft manufacturers, aircraft filter manufacturers, and distributors participating. The United States and Canada are the countries in this region that are being studied for market research. The COVID-19 epidemic has had an impact on the manufacturing of raw materials, components, and assembly lines for aviation filters. Because of their application in the commercial and defence sectors, aviation systems, which include aircraft filters, are extremely important.

Despite economic uncertainty, the airplane filter markets in Europe and North America are expected to rise significantly throughout the projected period. Furthermore, the Asia-Pacific region will serve as a locomotive for global expansion, with the region's airlines and airports expanding at a rapid pace and robust economic growth.

logo Competitive Players

Some of the major market players in the market are;

  • Purolator Facet Inc.
  • Donaldson Company Inc.
  • Safran Filtration Systems
  • Parker Hannifin Corporation
  • Freudenberg Group
  • Pall Corporation
  • Hollingsworth & Vose
  • Porvair plc.
  • Recco Products Inc.
  • Champion Aerospace LLC.

logo By Aircraft Type Segmentation Analysis

  • Unmanned Aerial Vehicles (UAVs)
  • Rotary Wing
  • Fixed Wing

logo By Sales Channel Segmentation Analysis

  • Aftermarket
  • Original Equipment Manufacturer (OEM)

logo By Type Segmentation Analysis

  • Air Filter
  • Avionics Filters
  • Cabin Air Filters
  • Odour Absorbing Filters
  • Engine Air Intake Filters
  • Fuel and Oil & Lube Filters
  • Hydraulic Filters
  • Others (Noise Filter, and Specialty Filters)

logo By Application Segmentation Analysis

  • Hydraulic System
  • Engine
  • Avionics
  • Pneumatic system
  • Cabin

logo By Material Segmentation Analysis

  • Aluminium
  • Plastic

logo By Vertical Segmentation Analysis

  • Military Aviation
  • Business Aviation
  • Commercial Aviation
  • Others

logo Regional Segmentation Analysis

  • North America
    • U.S.
    • Canada
  • Europe
    • Germany
    • The UK
    • France
    • Spain
    • Italy
    • Rest of Europe
  • Asia Pacific
    • China
    • Japan
    • India
    • South Korea
    • Southeast Asia
    • Rest of Asia Pacific
  • Latin America
    • Brazil
    • Mexico
    • Rest of Latin America
  • Middle East & Africa
    • GCC Countries
    • South Africa
    • Rest of the Middle East & Africa

Table of Content

  1. Chapter 1 Executive Summary
    1. 1.1. Introduction of Aircraft Filters
    2. 1.2. Global Aircraft Filters Market, 2020 & 2026 (USD Billion)
    3. 1.3. COVID-19 Impacts on Aircraft Filters Market
      1. 1.3.1. Short Term COVID-19 Impact on the Market
      2. 1.3.2. Mid-Term COVID-19 Impact on the Market
      3. 1.3.3. Long-Term COVID-19 Impact on the Market
    4. 1.4. Business Strategies and Recommendations
    5. 1.5. COVID-19 Impacts on the Player
    6. 1.6. Global Aircraft Filters Market, 2016 – 2026 (USD Billion)
    7. 1.7. Global Aircraft Filters Market Absolute Revenue Opportunity, 2016 – 2026 (USD Billion)
    8. 1.8. Global Aircraft Filters Market Incremental Revenue Opportunity, 2020 – 2026 (USD Billion)
  2. Chapter 2 Aircraft Filters Market – Aircraft Type Analysis
    1. 2.1. Global Aircraft Filters Market – Aircraft Type Overview
    2. 2.2. Global Aircraft Filters Market Share, by Aircraft Type, 2020 & 2026 (USD Billion)
    3. 2.3. Unmanned Aerial Vehicles (UAVs)
      1. 2.3.1. Global Unmanned Aerial Vehicles (UAVs) Aircraft Filters Market, 2016 – 2026 (USD Billion)
    4. 2.4. Rotary Wing
      1. 2.4.1. Global Rotary Wing Aircraft Filters Market, 2016 – 2026 (USD Billion)
    5. 2.5. Fixed Wing
      1. 2.5.1. Global Fixed Wing Aircraft Filters Market, 2016 – 2026 (USD Billion)
  3. Chapter 3 Aircraft Filters Market – Sales Channel Analysis
    1. 3.1. Global Aircraft Filters Market – Sales Channel Overview
    2. 3.2. Global Aircraft Filters Market Share, by Sales Channel, 2020 & 2026 (USD Billion)
    3. 3.3. Aftermarket
      1. 3.3.1. Global Aftermarket Aircraft Filters Market, 2016 – 2026 (USD Billion)
    4. 3.4. Original Equipment Manufacturer (OEM)
      1. 3.4.1. Global Original Equipment Manufacturer (OEM) Aircraft Filters Market, 2016 – 2026 (USD Billion)
  4. Chapter 4 Aircraft Filters Market – Type Analysis
    1. 4.1. Global Aircraft Filters Market – Type Overview
    2. 4.2. Global Aircraft Filters Market Share, by Type, 2020 & 2026 (USD Billion)
    3. 4.3. Air Filter
      1. 4.3.1. Global Air Filter Aircraft Filters Market, 2016 – 2026 (USD Billion)
    4. 4.4. Avionics Filters
      1. 4.4.1. Global Avionics Filters Aircraft Filters Market, 2016 – 2026 (USD Billion)
    5. 4.5. Cabin Air Filters
      1. 4.5.1. Global Cabin Air Filters Aircraft Filters Market, 2016 – 2026 (USD Billion)
    6. 4.6. Odour Absorbing Filters
      1. 4.6.1. Global Odour Absorbing Filters Aircraft Filters Market, 2016 – 2026 (USD Billion)
    7. 4.7. Engine Air Intake Filters
      1. 4.7.1. Global Engine Air Intake Filters Aircraft Filters Market, 2016 – 2026 (USD Billion)
    8. 4.8. Fuel and Oil & Lube Filters
      1. 4.8.1. Global Fuel and Oil & Lube Filters Aircraft Filters Market, 2016 – 2026 (USD Billion)
    9. 4.9. Hydraulic Filters
      1. 4.9.1. Global Hydraulic Filters Aircraft Filters Market, 2016 – 2026 (USD Billion)
    10. 4.10. Others
      1. 4.10.1. Global Others Aircraft Filters Market, 2016 – 2026 (USD Billion)
  5. Chapter 5 Aircraft Filters Market – Application Analysis
    1. 5.1. Global Aircraft Filters Market – Application Overview
    2. 5.2. Global Aircraft Filters Market Share, by Application, 2020 & 2026 (USD Billion)
    3. 5.3. Hydraulic System
      1. 5.3.1. Global Hydraulic System Aircraft Filters Market, 2016 – 2026 (USD Billion)
    4. 5.4. Engine
      1. 5.4.1. Global Engine Aircraft Filters Market, 2016 – 2026 (USD Billion)
    5. 5.5. Avionics
      1. 5.5.1. Global Avionics Aircraft Filters Market, 2016 – 2026 (USD Billion)
    6. 5.6. Pneumatic system
      1. 5.6.1. Global Pneumatic system Aircraft Filters Market, 2016 – 2026 (USD Billion)
    7. 5.7. Cabin
      1. 5.7.1. Global Cabin Aircraft Filters Market, 2016 – 2026 (USD Billion)
  6. Chapter 6 Aircraft Filters Market – Material Analysis
    1. 6.1. Global Aircraft Filters Market – Material Overview
    2. 6.2. Global Aircraft Filters Market Share, by Material, 2020 & 2026 (USD Billion)
    3. 6.3. Aluminium
      1. 6.3.1. Global Aluminium Aircraft Filters Market, 2016 – 2026 (USD Billion)
    4. 6.4. Plastic
      1. 6.4.1. Global Plastic Aircraft Filters Market, 2016 – 2026 (USD Billion)
  7. Chapter 7 Aircraft Filters Market – Vertical Analysis
    1. 7.1. Global Aircraft Filters Market – Vertical Overview
    2. 7.2. Global Aircraft Filters Market Share, by Vertical, 2020 & 2026 (USD Billion)
    3. 7.3. Military Aviation
      1. 7.3.1. Global Military Aviation Aircraft Filters Market, 2016 – 2026 (USD Billion)
    4. 7.4. Business Aviation
      1. 7.4.1. Global Business Aviation Aircraft Filters Market, 2016 – 2026 (USD Billion)
    5. 7.5. Commercial Aviation
      1. 7.5.1. Global Commercial Aviation Aircraft Filters Market, 2016 – 2026 (USD Billion)
    6. 7.6. Others
      1. 7.6.1. Global Others Aircraft Filters Market, 2016 – 2026 (USD Billion)
  8. Chapter 8 Aircraft Filters Market – Regional Analysis
    1. 8.1. Global Aircraft Filters Market Regional Overview
    2. 8.2. Global Aircraft Filters Market Share, by Region, 2020 & 2026 (USD Billion)
    3. 8.3. North America
      1. 8.3.1. North America Aircraft Filters Market, 2016 – 2026 (USD Billion)
        1. 8.3.1.1. North America Aircraft Filters Market, by Country, 2016 - 2026 (USD Billion)
      2. 8.3.2. North America Aircraft Filters Market, by Aircraft Type, 2016 – 2026
        1. 8.3.2.1. North America Aircraft Filters Market, by Aircraft Type, 2016 – 2026 (USD Billion)
      3. 8.3.3. North America Aircraft Filters Market, by Sales Channel, 2016 – 2026
        1. 8.3.3.1. North America Aircraft Filters Market, by Sales Channel, 2016 – 2026 (USD Billion)
      4. 8.3.4. North America Aircraft Filters Market, by Type, 2016 – 2026
        1. 8.3.4.1. North America Aircraft Filters Market, by Type, 2016 – 2026 (USD Billion)
      5. 8.3.5. North America Aircraft Filters Market, by Application, 2016 – 2026
        1. 8.3.5.1. North America Aircraft Filters Market, by Application, 2016 – 2026 (USD Billion)
      6. 8.3.6. North America Aircraft Filters Market, by Material, 2016 – 2026
        1. 8.3.6.1. North America Aircraft Filters Market, by Material, 2016 – 2026 (USD Billion)
      7. 8.3.7. North America Aircraft Filters Market, by Vertical, 2016 – 2026
        1. 8.3.7.1. North America Aircraft Filters Market, by Vertical, 2016 – 2026 (USD Billion)
      8. 8.3.8. U.S.
        1. 8.3.8.1. U.S. Aircraft Filters Market, 2016 – 2026 (USD Billion)
      9. 8.3.9. Canada
        1. 8.3.9.1. Canada Aircraft Filters Market, 2016 – 2026 (USD Billion)
    4. 8.4. Europe
      1. 8.4.1. Europe Aircraft Filters Market, 2016 – 2026 (USD Billion)
        1. 8.4.1.1. Europe Aircraft Filters Market, by Country, 2016 - 2026 (USD Billion)
      2. 8.4.2. Europe Aircraft Filters Market, by Aircraft Type, 2016 – 2026
        1. 8.4.2.1. Europe Aircraft Filters Market, by Aircraft Type, 2016 – 2026 (USD Billion)
      3. 8.4.3. Europe Aircraft Filters Market, by Sales Channel, 2016 – 2026
        1. 8.4.3.1. Europe Aircraft Filters Market, by Sales Channel, 2016 – 2026 (USD Billion)
      4. 8.4.4. Europe Aircraft Filters Market, by Type, 2016 – 2026
        1. 8.4.4.1. Europe Aircraft Filters Market, by Type, 2016 – 2026 (USD Billion)
      5. 8.4.5. Europe Aircraft Filters Market, by Application, 2016 – 2026
        1. 8.4.5.1. Europe Aircraft Filters Market, by Application, 2016 – 2026 (USD Billion)
      6. 8.4.6. Europe Aircraft Filters Market, by Material, 2016 – 2026
        1. 8.4.6.1. Europe Aircraft Filters Market, by Material, 2016 – 2026 (USD Billion)
      7. 8.4.7. Europe Aircraft Filters Market, by Vertical, 2016 – 2026
        1. 8.4.7.1. Europe Aircraft Filters Market, by Vertical, 2016 – 2026 (USD Billion)
      8. 8.4.8. Germany
        1. 8.4.8.1. Germany Aircraft Filters Market, 2016 – 2026 (USD Billion)
      9. 8.4.9. France
        1. 8.4.9.1. France Aircraft Filters Market, 2016 – 2026 (USD Billion)
      10. 8.4.10. U.K.
        1. 8.4.10.1. U.K. Aircraft Filters Market, 2016 – 2026 (USD Billion)
      11. 8.4.11. Italy
        1. 8.4.11.1. Italy Aircraft Filters Market, 2016 – 2026 (USD Billion)
      12. 8.4.12. Spain
        1. 8.4.12.1. Spain Aircraft Filters Market, 2016 – 2026 (USD Billion)
      13. 8.4.13. Rest of Europe
        1. 8.4.13.1. Rest of Europe Aircraft Filters Market, 2016 – 2026 (USD Billion)
    5. 8.5. Asia Pacific
      1. 8.5.1. Asia Pacific Aircraft Filters Market, 2016 – 2026 (USD Billion)
        1. 8.5.1.1. Asia Pacific Aircraft Filters Market, by Country, 2016 - 2026 (USD Billion)
      2. 8.5.2. Asia Pacific Aircraft Filters Market, by Aircraft Type, 2016 – 2026
        1. 8.5.2.1. Asia Pacific Aircraft Filters Market, by Aircraft Type, 2016 – 2026 (USD Billion)
      3. 8.5.3. Asia Pacific Aircraft Filters Market, by Sales Channel, 2016 – 2026
        1. 8.5.3.1. Asia Pacific Aircraft Filters Market, by Sales Channel, 2016 – 2026 (USD Billion)
      4. 8.5.4. Asia Pacific Aircraft Filters Market, by Type, 2016 – 2026
        1. 8.5.4.1. Asia Pacific Aircraft Filters Market, by Type, 2016 – 2026 (USD Billion)
      5. 8.5.5. Asia Pacific Aircraft Filters Market, by Application, 2016 – 2026
        1. 8.5.5.1. Asia Pacific Aircraft Filters Market, by Application, 2016 – 2026 (USD Billion)
      6. 8.5.6. Asia Pacific Aircraft Filters Market, by Material, 2016 – 2026
        1. 8.5.6.1. Asia Pacific Aircraft Filters Market, by Material, 2016 – 2026 (USD Billion)
      7. 8.5.7. Asia Pacific Aircraft Filters Market, by Vertical, 2016 – 2026
        1. 8.5.7.1. Asia Pacific Aircraft Filters Market, by Vertical, 2016 – 2026 (USD Billion)
      8. 8.5.8. China
        1. 8.5.8.1. China Aircraft Filters Market, 2016 – 2026 (USD Billion)
      9. 8.5.9. Japan
        1. 8.5.9.1. Japan Aircraft Filters Market, 2016 – 2026 (USD Billion)
      10. 8.5.10. India
        1. 8.5.10.1. India Aircraft Filters Market, 2016 – 2026 (USD Billion)
      11. 8.5.11. South Korea
        1. 8.5.11.1. South Korea Aircraft Filters Market, 2016 – 2026 (USD Billion)
      12. 8.5.12. South-East Asia
        1. 8.5.12.1. South-East Asia Aircraft Filters Market, 2016 – 2026 (USD Billion)
      13. 8.5.13. Rest of Asia Pacific
        1. 8.5.13.1. Rest of Asia Pacific Aircraft Filters Market, 2016 – 2026 (USD Billion)
    6. 8.6. Latin America
      1. 8.6.1. Latin America Aircraft Filters Market, 2016 – 2026 (USD Billion)
        1. 8.6.1.1. Latin America Aircraft Filters Market, by Country, 2016 - 2026 (USD Billion)
      2. 8.6.2. Latin America Aircraft Filters Market, by Aircraft Type, 2016 – 2026
        1. 8.6.2.1. Latin America Aircraft Filters Market, by Aircraft Type, 2016 – 2026 (USD Billion)
      3. 8.6.3. Latin America Aircraft Filters Market, by Sales Channel, 2016 – 2026
        1. 8.6.3.1. Latin America Aircraft Filters Market, by Sales Channel, 2016 – 2026 (USD Billion)
      4. 8.6.4. Latin America Aircraft Filters Market, by Type, 2016 – 2026
        1. 8.6.4.1. Latin America Aircraft Filters Market, by Type, 2016 – 2026 (USD Billion)
      5. 8.6.5. Latin America Aircraft Filters Market, by Application, 2016 – 2026
        1. 8.6.5.1. Latin America Aircraft Filters Market, by Application, 2016 – 2026 (USD Billion)
      6. 8.6.6. Latin America Aircraft Filters Market, by Material, 2016 – 2026
        1. 8.6.6.1. Latin America Aircraft Filters Market, by Material, 2016 – 2026 (USD Billion)
      7. 8.6.7. Latin America Aircraft Filters Market, by Vertical, 2016 – 2026
        1. 8.6.7.1. Latin America Aircraft Filters Market, by Vertical, 2016 – 2026 (USD Billion)
      8. 8.6.8. Brazil
        1. 8.6.8.1. Brazil Aircraft Filters Market, 2016 – 2026 (USD Billion)
      9. 8.6.9. Mexico
        1. 8.6.9.1. Mexico Aircraft Filters Market, 2016 – 2026 (USD Billion)
      10. 8.6.10. Rest of Latin America
        1. 8.6.10.1. Rest of Latin America Aircraft Filters Market, 2016 – 2026 (USD Billion)
    7. 8.7. The Middle-East and Africa
      1. 8.7.1. The Middle-East and Africa Aircraft Filters Market, 2016 – 2026 (USD Billion)
        1. 8.7.1.1. The Middle-East and Africa Aircraft Filters Market, by Country, 2016 - 2026 (USD Billion)
      2. 8.7.2. The Middle-East and Africa Aircraft Filters Market, by Aircraft Type, 2016 – 2026
        1. 8.7.2.1. The Middle-East and Africa Aircraft Filters Market, by Aircraft Type, 2016 – 2026 (USD Billion)
      3. 8.7.3. The Middle-East and Africa Aircraft Filters Market, by Sales Channel, 2016 – 2026
        1. 8.7.3.1. The Middle-East and Africa Aircraft Filters Market, by Sales Channel, 2016 – 2026 (USD Billion)
      4. 8.7.4. The Middle-East and Africa Aircraft Filters Market, by Type, 2016 – 2026
        1. 8.7.4.1. The Middle-East and Africa Aircraft Filters Market, by Type, 2016 – 2026 (USD Billion)
      5. 8.7.5. The Middle-East and Africa Aircraft Filters Market, by Application, 2016 – 2026
        1. 8.7.5.1. The Middle-East and Africa Aircraft Filters Market, by Application, 2016 – 2026 (USD Billion)
      6. 8.7.6. The Middle-East and Africa Aircraft Filters Market, by Material, 2016 – 2026
        1. 8.7.6.1. The Middle-East and Africa Aircraft Filters Market, by Material, 2016 – 2026 (USD Billion)
      7. 8.7.7. The Middle-East and Africa Aircraft Filters Market, by Vertical, 2016 – 2026
        1. 8.7.7.1. The Middle-East and Africa Aircraft Filters Market, by Vertical, 2016 – 2026 (USD Billion)
      8. 8.7.8. GCC Countries
        1. 8.7.8.1. GCC Countries Aircraft Filters Market, 2016 – 2026 (USD Billion)
      9. 8.7.9. South Africa
        1. 8.7.9.1. South Africa Aircraft Filters Market, 2016 – 2026 (USD Billion)
      10. 8.7.10. Rest of Middle-East Africa
        1. 8.7.10.1. Rest of Middle-East Africa Aircraft Filters Market, 2016 – 2026 (USD Billion)
  9. Chapter 9 Aircraft Filters Market – Competitive Landscape
    1. 9.1. Competitor Market Share – Revenue
    2. 9.2. Market Concentration Rate Analysis, Top 3 and Top 5 Players
    3. 9.3. Strategic Developments
      1. 9.3.1. Acquisitions and Mergers
      2. 9.3.2. New Products
      3. 9.3.3. Research & Development Activities
  10. Chapter 10 Company Profiles
    1. 10.1. Safran Filtration Systems
      1. 10.1.1. Company Overview
      2. 10.1.2. Product/Service Portfolio
      3. 10.1.3. Safran Filtration Systems Sales, Revenue, and Gross Margin
      4. 10.1.4. Safran Filtration Systems Revenue and Growth Rate
      5. 10.1.5. Safran Filtration Systems Market Share
      6. 10.1.6. Recent Initiatives, Funding/VC Activities, and Technological Innovations
    2. 10.2. Purolator Facet Inc
      1. 10.2.1. Company Overview
      2. 10.2.2. Product/Service Portfolio
      3. 10.2.3. Purolator Facet Inc Sales, Revenue, and Gross Margin
      4. 10.2.4. Purolator Facet Inc Revenue and Growth Rate
      5. 10.2.5. Purolator Facet Inc Market Share
      6. 10.2.6. Recent Initiatives, Funding/VC Activities, and Technological Innovations
    3. 10.3. Freudenberg Group
      1. 10.3.1. Company Overview
      2. 10.3.2. Product/Service Portfolio
      3. 10.3.3. Freudenberg Group Sales, Revenue, and Gross Margin
      4. 10.3.4. Freudenberg Group Revenue and Growth Rate
      5. 10.3.5. Freudenberg Group Market Share
      6. 10.3.6. Recent Initiatives, Funding/VC Activities, and Technological Innovations
    4. 10.4. Donaldson Company Inc
      1. 10.4.1. Company Overview
      2. 10.4.2. Product/Service Portfolio
      3. 10.4.3. Donaldson Company Inc Sales, Revenue, and Gross Margin
      4. 10.4.4. Donaldson Company Inc Revenue and Growth Rate
      5. 10.4.5. Donaldson Company Inc Market Share
      6. 10.4.6. Recent Initiatives, Funding/VC Activities, and Technological Innovations
    5. 10.5. Recco Products Inc
      1. 10.5.1. Company Overview
      2. 10.5.2. Product/Service Portfolio
      3. 10.5.3. Recco Products Inc Sales, Revenue, and Gross Margin
      4. 10.5.4. Recco Products Inc Revenue and Growth Rate
      5. 10.5.5. Recco Products Inc Market Share
      6. 10.5.6. Recent Initiatives, Funding/VC Activities, and Technological Innovations
    6. 10.6. Parker Hannifin Corporation
      1. 10.6.1. Company Overview
      2. 10.6.2. Product/Service Portfolio
      3. 10.6.3. Parker Hannifin Corporation Sales, Revenue, and Gross Margin
      4. 10.6.4. Parker Hannifin Corporation Revenue and Growth Rate
      5. 10.6.5. Parker Hannifin Corporation Market Share
      6. 10.6.6. Recent Initiatives, Funding/VC Activities, and Technological Innovations
    7. 10.7. Pall Corporation
      1. 10.7.1. Company Overview
      2. 10.7.2. Product/Service Portfolio
      3. 10.7.3. Pall Corporation Sales, Revenue, and Gross Margin
      4. 10.7.4. Pall Corporation Revenue and Growth Rate
      5. 10.7.5. Pall Corporation Market Share
      6. 10.7.6. Recent Initiatives, Funding/VC Activities, and Technological Innovations
    8. 10.8. Champion Aerospace LLC
      1. 10.8.1. Company Overview
      2. 10.8.2. Product/Service Portfolio
      3. 10.8.3. Champion Aerospace LLC Sales, Revenue, and Gross Margin
      4. 10.8.4. Champion Aerospace LLC Revenue and Growth Rate
      5. 10.8.5. Champion Aerospace LLC Market Share
      6. 10.8.6. Recent Initiatives, Funding/VC Activities, and Technological Innovations
    9. 10.9. Hollingsworth & Vose
      1. 10.9.1. Company Overview
      2. 10.9.2. Product/Service Portfolio
      3. 10.9.3. Hollingsworth & Vose Sales, Revenue, and Gross Margin
      4. 10.9.4. Hollingsworth & Vose Revenue and Growth Rate
      5. 10.9.5. Hollingsworth & Vose Market Share
      6. 10.9.6. Recent Initiatives, Funding/VC Activities, and Technological Innovations
    10. 10.10. Porvair plc
      1. 10.10.1. Company Overview
      2. 10.10.2. Product/Service Portfolio
      3. 10.10.3. Porvair plc Sales, Revenue, and Gross Margin
      4. 10.10.4. Porvair plc Revenue and Growth Rate
      5. 10.10.5. Porvair plc Market Share
      6. 10.10.6. Recent Initiatives, Funding/VC Activities, and Technological Innovations
  11. Chapter 11 Aircraft Filters — Industry Analysis
    1. 11.1. Introduction and Taxonomy
    2. 11.2. Aircraft Filters Market – Key Trends
      1. 11.2.1. Market Drivers
      2. 11.2.2. Market Restraints
      3. 11.2.3. Market Opportunities
    3. 11.3. Value Chain Analysis
    4. 11.4. Key Mandates and Regulations
    5. 11.5. Technology Roadmap and Timeline
    6. 11.6. Aircraft Filters Market – Attractiveness Analysis
      1. 11.6.1. By Aircraft Type
      2. 11.6.2. By Sales Channel
      3. 11.6.3. By Type
      4. 11.6.4. By Application
      5. 11.6.5. By Material
      6. 11.6.6. By Vertical
      7. 11.6.7. By Region
  12. Chapter 12 Industrial Chain, Sourcing Strategy, and Downstream Buyers
    1. 12.1. Aircraft Filters Industrial Chain Analysis
    2. 12.2. Downstream Buyers
    3. 12.3. Distributors/Traders List
  13. Chapter 13 Marketing Strategy Analysis
    1. 13.1. Marketing Channel
    2. 13.2. Direct Marketing
    3. 13.3. Indirect Marketing
    4. 13.4. Marketing Channel Development Trends
    5. 13.5. Economic/Political Environmental Change
  14. Chapter 14 Report Conclusion & Key Insights
    1. 14.1. Key Insights from Primary Interviews & Surveys Respondents
    2. 14.2. Key Takeaways from Analysts, Consultants, and Industry Leaders
  15. Chapter 15 Research Approach & Methodology
    1. 15.1. Report Description
    2. 15.2. Research Scope
    3. 15.3. Research Methodology
      1. 15.3.1. Secondary Research
      2. 15.3.2. Primary Research
      3. 15.3.3. Statistical Models
        1. 15.3.3.1. Company Share Analysis Model
        2. 15.3.3.2. Revenue Based Modeling
      4. 15.3.4. Research Limitations

      List of Figures

      Fig.1	Product Picture of Aircraft Filters
      Fig.2	COVID-19 Impacts on Aircraft Filters Market
      Fig.3	Business Strategies and Recommendations
      Fig.4	COVID-19 Impact on the Player
      Fig.5	Global Aircraft Filters Market, 2016 – 2026 (USD Billion)
      Fig.6	Global Aircraft Filters Market Absolute Revenue Opportunity, 2016 – 2026 (USD Billion)
      Fig.7	Global Aircraft Filters Market Incremental Revenue Opportunity, 2020 – 2026 (USD Billion)
      Fig.8	Global Aircraft Filters Market Share, by Aircraft Type, 2020 & 2026 (USD Billion)
      Fig.9	Global Unmanned Aerial Vehicles (UAVs) Aircraft Filters Market, 2016 – 2026 (USD Billion)
      Fig.10	Global Rotary Wing Aircraft Filters Market, 2016 – 2026 (USD Billion)
      Fig.11	Global Fixed Wing Aircraft Filters Market, 2016 – 2026 (USD Billion)
      Fig.12	Global Aircraft Filters Market Share, by Sales Channel, 2020 & 2026 (USD Billion)
      Fig.13	Global Aftermarket Aircraft Filters Market, 2016 – 2026 (USD Billion)
      Fig.14	Global Original Equipment Manufacturer (OEM) Aircraft Filters Market, 2016 – 2026 (USD Billion)
      Fig.15	Global Aircraft Filters Market Share, by Type, 2020 & 2026 (USD Billion)
      Fig.16	Global Air Filter Aircraft Filters Market, 2016 – 2026 (USD Billion)
      Fig.17	Global Avionics Filters Aircraft Filters Market, 2016 – 2026 (USD Billion)
      Fig.18	Global Cabin Air Filters Aircraft Filters Market, 2016 – 2026 (USD Billion)
      Fig.19	Global Odour Absorbing Filters Aircraft Filters Market, 2016 – 2026 (USD Billion)
      Fig.20	Global Engine Air Intake Filters Aircraft Filters Market, 2016 – 2026 (USD Billion)
      Fig.21	Global Fuel and Oil & Lube Filters Aircraft Filters Market, 2016 – 2026 (USD Billion)
      Fig.22	Global Hydraulic Filters Aircraft Filters Market, 2016 – 2026 (USD Billion)
      Fig.23	Global Others Aircraft Filters Market, 2016 – 2026 (USD Billion)
      Fig.24	Global Aircraft Filters Market Share, by Application, 2020 & 2026 (USD Billion)
      Fig.25	Global Hydraulic System Aircraft Filters Market, 2016 – 2026 (USD Billion)
      Fig.26	Global Engine Aircraft Filters Market, 2016 – 2026 (USD Billion)
      Fig.27	Global Avionics Aircraft Filters Market, 2016 – 2026 (USD Billion)
      Fig.28	Global Pneumatic system Aircraft Filters Market, 2016 – 2026 (USD Billion)
      Fig.29	Global Cabin Aircraft Filters Market, 2016 – 2026 (USD Billion)
      Fig.30	Global Aircraft Filters Market Share, by Material, 2020 & 2026 (USD Billion)
      Fig.31	Global Aluminium Aircraft Filters Market, 2016 – 2026 (USD Billion)
      Fig.32	Global Plastic Aircraft Filters Market, 2016 – 2026 (USD Billion)
      Fig.33	Global Aircraft Filters Market Share, by Vertical, 2020 & 2026 (USD Billion)
      Fig.34	Global Military Aviation Aircraft Filters Market, 2016 – 2026 (USD Billion)
      Fig.35	Global Business Aviation Aircraft Filters Market, 2016 – 2026 (USD Billion)
      Fig.36	Global Commercial Aviation Aircraft Filters Market, 2016 – 2026 (USD Billion)
      Fig.37	Global Others Aircraft Filters Market, 2016 – 2026 (USD Billion)
      Fig.38	Global Aircraft Filters Market Share, by Region, 2020 & 2026 (USD Billion)
      Fig.39	North America Aircraft Filters Market, 2016 – 2026 (USD Billion)
      Fig.40	U.S. Aircraft Filters Market, 2016 – 2026 (USD Billion)
      Fig.41	Canada Aircraft Filters Market, 2016 – 2026 (USD Billion)
      Fig.42	Europe Aircraft Filters Market, 2016 – 2026 (USD Billion)
      Fig.43	Germany Aircraft Filters Market, 2016 – 2026 (USD Billion)
      Fig.44	France Aircraft Filters Market, 2016 – 2026 (USD Billion)
      Fig.45	U.K. Aircraft Filters Market, 2016 – 2026 (USD Billion)
      Fig.46	Italy Aircraft Filters Market, 2016 – 2026 (USD Billion)
      Fig.47	Spain Aircraft Filters Market, 2016 – 2026 (USD Billion)
      Fig.48	Rest of Europe Aircraft Filters Market, 2016 – 2026 (USD Billion)
      Fig.49	Asia Pacific Aircraft Filters Market, 2016 – 2026 (USD Billion)
      Fig.50	China Aircraft Filters Market, 2016 – 2026 (USD Billion)
      Fig.51	Japan Aircraft Filters Market, 2016 – 2026 (USD Billion)
      Fig.52	India Aircraft Filters Market, 2016 – 2026 (USD Billion)
      Fig.53	South Korea Aircraft Filters Market, 2016 – 2026 (USD Billion)
      Fig.54	South-East Asia Aircraft Filters Market, 2016 – 2026 (USD Billion)
      Fig.55	Rest of Asia Pacific Aircraft Filters Market, 2016 – 2026 (USD Billion)
      Fig.56	Latin America Aircraft Filters Market, 2016 – 2026 (USD Billion)
      Fig.57	Brazil Aircraft Filters Market, 2016 – 2026 (USD Billion)
      Fig.58	Mexico Aircraft Filters Market, 2016 – 2026 (USD Billion)
      Fig.59	Rest of Latin America Aircraft Filters Market, 2016 – 2026 (USD Billion)
      Fig.60	The Middle-East and Africa Aircraft Filters Market, 2016 – 2026 (USD Billion)
      Fig.61	GCC Countries Aircraft Filters Market, 2016 – 2026 (USD Billion)
      Fig.62	South Africa Aircraft Filters Market, 2016 – 2026 (USD Billion)
      Fig.63	Rest of Middle-East Africa Aircraft Filters Market, 2016 – 2026 (USD Billion)
      Fig.64	Competitor Market Share – Revenue
      Fig.65	Safran Filtration Systems Revenue and Growth Rate
      Fig.66	Safran Filtration Systems Market Share
      Fig.67	Purolator Facet Inc Revenue and Growth Rate
      Fig.68	Purolator Facet Inc Market Share
      Fig.69	Freudenberg Group Revenue and Growth Rate
      Fig.70	Freudenberg Group Market Share
      Fig.71	Donaldson Company Inc Revenue and Growth Rate
      Fig.72	Donaldson Company Inc Market Share
      Fig.73	Recco Products Inc Revenue and Growth Rate
      Fig.74	Recco Products Inc Market Share
      Fig.75	Parker Hannifin Corporation Revenue and Growth Rate
      Fig.76	Parker Hannifin Corporation Market Share
      Fig.77	Pall Corporation Revenue and Growth Rate
      Fig.78	Pall Corporation Market Share
      Fig.79	Champion Aerospace LLC Revenue and Growth Rate
      Fig.80	Champion Aerospace LLC Market Share
      Fig.81	Hollingsworth & Vose Revenue and Growth Rate
      Fig.82	Hollingsworth & Vose Market Share
      Fig.83	Porvair plc Revenue and Growth Rate
      Fig.84	Porvair plc Market Share
      Fig.85	Market Dynamics
      Fig.86	Global Aircraft Filters – Value Chain Analysis
      Fig.87	Key Mandates and Regulations
      Fig.88	Technology Roadmap and Timeline
      Fig.89	Market Attractiveness Analysis – By Aircraft Type
      Fig.90	Market Attractiveness Analysis – By Sales Channel
      Fig.91	Market Attractiveness Analysis – By Type
      Fig.92	Market Attractiveness Analysis – By Application
      Fig.93	Market Attractiveness Analysis – By Material
      Fig.94	Market Attractiveness Analysis – By Vertical
      Fig.95	Market Attractiveness Analysis – By Region
      Fig.96	Aircraft Filters Industrial Chain Analysis
      Fig.97	Market Channels
      Fig.98	Marketing Channel Development Trend
      Fig.99	Growth in World Gross Product, 2008-2018
      

      List of Tables

      	
      Table 1	Global Aircraft Filters Market, 2020 & 2026 (USD Billion)
      Table 2	Global Aircraft Filters Market, by Aircraft Type, 2016 – 2026 (USD Billion)
      Table 3	Global Aircraft Filters Market, by Sales Channel, 2016 – 2026 (USD Billion)
      Table 4	Global Aircraft Filters Market, by Type, 2016 – 2026 (USD Billion)
      Table 5	Global Aircraft Filters Market, by Application, 2016 – 2026 (USD Billion)
      Table 6	Global Aircraft Filters Market, by Material, 2016 – 2026 (USD Billion)
      Table 7	Global Aircraft Filters Market, by Vertical, 2016 – 2026 (USD Billion)
      Table 8	Global Aircraft Filters Market, by Region, 2016 – 2026 (USD Billion)
      Table 9	North America Aircraft Filters Market, by Country, 2016 – 2026 (USD Billion)
      Table 10 North America Aircraft Filters Market, by Aircraft Type, 2016 – 2026 (USD Billion)
      Table 11 North America Aircraft Filters Market, by Sales Channel, 2016 – 2026 (USD Billion)
      Table 12 North America Aircraft Filters Market, by Type, 2016 – 2026 (USD Billion)
      Table 13 North America Aircraft Filters Market, by Application, 2016 – 2026 (USD Billion)
      Table 14 North America Aircraft Filters Market, by Material, 2016 – 2026 (USD Billion)
      Table 15 North America Aircraft Filters Market, by Vertical, 2016 – 2026 (USD Billion)
      Table 16 Europe Aircraft Filters Market, by Country, 2016 – 2026 (USD Billion)
      Table 17 Europe Aircraft Filters Market, by Aircraft Type, 2016 – 2026 (USD Billion)
      Table 18 Europe Aircraft Filters Market, by Sales Channel, 2016 – 2026 (USD Billion)
      Table 19 Europe Aircraft Filters Market, by Type, 2016 – 2026 (USD Billion)
      Table 20 Europe Aircraft Filters Market, by Application, 2016 – 2026 (USD Billion)
      Table 21 Europe Aircraft Filters Market, by Material, 2016 – 2026 (USD Billion)
      Table 22 Europe Aircraft Filters Market, by Vertical, 2016 – 2026 (USD Billion)
      Table 23 Asia Pacific Aircraft Filters Market, by Country, 2016 – 2026 (USD Billion)
      Table 24 Asia Pacific Aircraft Filters Market, by Aircraft Type, 2016 – 2026 (USD Billion)
      Table 25 Asia Pacific Aircraft Filters Market, by Sales Channel, 2016 – 2026 (USD Billion)
      Table 26 Asia Pacific Aircraft Filters Market, by Type, 2016 – 2026 (USD Billion)
      Table 27 Asia Pacific Aircraft Filters Market, by Application, 2016 – 2026 (USD Billion)
      Table 28 Asia Pacific Aircraft Filters Market, by Material, 2016 – 2026 (USD Billion)
      Table 29 Asia Pacific Aircraft Filters Market, by Vertical, 2016 – 2026 (USD Billion)
      Table 30 Latin America Aircraft Filters Market, by Country, 2016 – 2026 (USD Billion)
      Table 31 Latin America Aircraft Filters Market, by Aircraft Type, 2016 – 2026 (USD Billion)
      Table 32 Latin America Aircraft Filters Market, by Sales Channel, 2016 – 2026 (USD Billion)
      Table 33 Latin America Aircraft Filters Market, by Type, 2016 – 2026 (USD Billion)
      Table 34 Latin America Aircraft Filters Market, by Application, 2016 – 2026 (USD Billion)
      Table 35 Latin America Aircraft Filters Market, by Material, 2016 – 2026 (USD Billion)
      Table 36 Latin America Aircraft Filters Market, by Vertical, 2016 – 2026 (USD Billion)
      Table 37 The Middle-East and Africa Aircraft Filters Market, by Country, 2016 – 2026 (USD Billion)
      Table 38 The Middle-East and Africa Aircraft Filters Market, by Aircraft Type, 2016 – 2026 (USD Billion)
      Table 39 The Middle-East and Africa Aircraft Filters Market, by Sales Channel, 2016 – 2026 (USD Billion)
      Table 40 The Middle-East and Africa Aircraft Filters Market, by Type, 2016 – 2026 (USD Billion)
      Table 41 The Middle-East and Africa Aircraft Filters Market, by Application, 2016 – 2026 (USD Billion)
      Table 42 The Middle-East and Africa Aircraft Filters Market, by Material, 2016 – 2026 (USD Billion)
      Table 43 The Middle-East and Africa Aircraft Filters Market, by Vertical, 2016 – 2026 (USD Billion)
      Table 44 Global Aircraft Filters Market - Company Revenue Analysis, 2016 – 2020 (USD Billion)
      Table 45 Global Aircraft Filters Market - Company Revenue Share Analysis, 2016 – 2020 (%)
      Table 46 Acquisitions and Mergers
      Table 47 Market Drivers – Impact Analysis
      Table 48 Market Restraints
      Table 49 Market Opportunities
      Table 50 Major Buyers of Aircraft Filters
      Table 51 Distributors/Traders of Aircraft Filters by Region
      

Industry Major Market Players

  • Purolator Facet Inc.
  • Donaldson Company Inc.
  • Safran Filtration Systems
  • Parker Hannifin Corporation
  • Freudenberg Group
  • Pall Corporation, Hollingsworth & Vose
  • Porvair plc. Recco Products Inc.
  • Champion Aerospace LLC.