Search Market Research Report

Discover Our Latest Reports
Discover Our Featured Reports
Discover Top Selling Reports

Agricultural Biologicals Market Size, Share Global Analysis Report, 2020–2026

report img

Agricultural Biologicals Market By Product Type (Biopesticides, Biostimulants, Biofertilizers and Others), Crop Type (Cereals & Grains, Oilseeds & Pulses, Fruits & Vegetables, and Others), and By Application (Foliar Spray, Seed Treatment, Soil Treatment, and Post-harvest): Global Industry Outlook, Market Size, Business Intelligence, Consumer Preferences, Statistical Surveys, Comprehensive Analysis, Historical Developments, Current Trends, and Forecast 2020–2026

Industry Insights

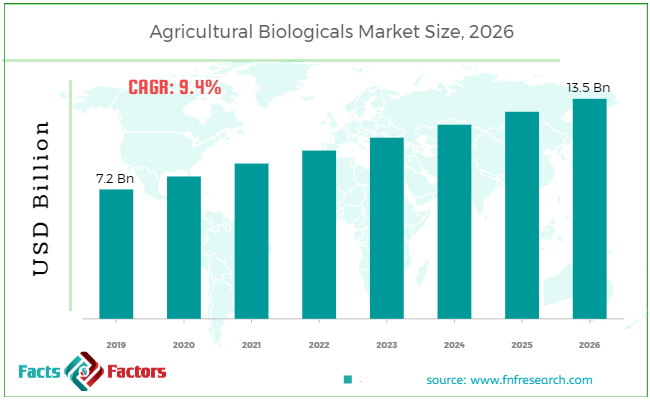
[190+ Pages Report] According to the report published by Facts Factors, the global agricultural biologicals market size was worth around USD 7.2 billion in 2019 and is predicted to grow to around USD 13.5 billion by 2026 with a compound annual growth rate (CAGR) of roughly 9.4% between 2020 and 2026. The report analyzes the global agricultural biological market drivers, restraints/challenges, and the effect they have on the demands during the projection period. In addition, the report explores emerging opportunities in the agricultural biological market.

Agricultural Biologicals Market Size

To know more about this report | Request Free Sample Copy

This specialized and expertise-oriented industry research report scrutinizes the technical and commercial business outlook of the agricultural biologicals industry. The report analyzes and declares the historical and current trends analysis of the agricultural biologicals industry and subsequently recommends the projected trends anticipated to be observed in the agricultural biologicals market during the upcoming years.

The agricultural biologicals market report analyzes and notifies the industry statistics at the global as well as regional and country levels in order to acquire a thorough perspective of the entire agricultural biologicals market. The historical and past insights are provided for FY 2016 to FY 2019 whereas projected trends are delivered for FY 2020 to FY 2026. The quantitative and numerical data is represented in terms of both volume (Kilo Tons) and value (USD Million) from FY 2016 – 2026.


logoKey Insights from Primary Research

  • The global agricultural biologicals market is anticipated to grow annually at a rate of around 9.4%
  • It was established through primary research that the market generated revenue of around USD 7.2 billion in 2019
  • The “Biopesticides” category, based on product type segmentation, was the leading revenue-generating category in 2019
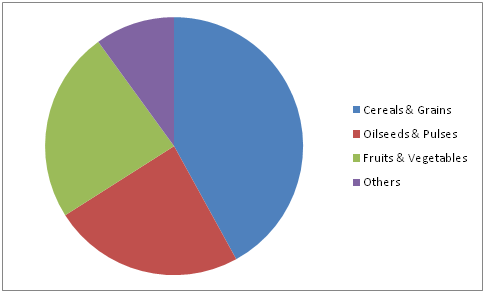
  • The “Cereals & Grains” category, based on crop type segmentation, was the leading revenue-generating category in 2019
  • The “Seed Treatment” category, based on application segmentation, was the leading revenue-generating category in 2019

logoKey Recommendations from Analysts

  • North America region dominated the global agricultural biologicals market in 2019 with a market share of around 35%
  • There increasing demand for supreme quality crops globally has led to the development of crops that can resist pest attacks to some extent with the help of agricultural biologicals hence driving the global market
  • Environmental damage caused due to the use of large quantities of harmful chemicals for crop protection is creating a demand for biological products that can replace the harmful chemicals hence boosting the global agricultural biologicals market
  • Stringent government rules and regulations on the use of chemical fertilizers in the agriculture sector are anticipated to boost the agricultural biologicals market
  • The Asia Pacific region is anticipated to grow with the fastest CAGR in the forecast period due to the emerging agriculture sector in countries such as India, South Korea, Philippines, Japan, and Thailand

logoAgricultural Biologicals Market Share in 2019 – By Crop Type

Agricultural Biologicals Market

To know more about this report | Request Free Sample Copy


The quantitative data is further underlined and reinforced by comprehensive qualitative data which comprises various across-the-board market dynamics. The rationales which directly or indirectly impact the agricultural biologicals industry are exemplified through parameters such as growth drivers, restraints, challenges, and opportunities among other impacting factors.

Throughout our research report, we have encompassed all the proven models and tools of industry analysis and extensively illustrated all the key business strategies and business models adopted in the agricultural biologicals industry. The report provides an all-inclusive and detailed competitive landscape prevalent in the agricultural biologicals market.

The report utilizes established industry analysis tools and models such as Porter’s Five Forces framework to analyze and recognize critical business strategies adopted by various stakeholders involved in the entire value chain of the agricultural biologicals industry. The agricultural biologicals market report additionally employs SWOT analysis and PESTLE analysis models for further in-depth analysis.

The report study further includes an in-depth analysis of industry players' market shares and provides an overview of leading players' market position in the agricultural biologicals sector. Key strategic developments in the agricultural biologicals market competitive landscape such as acquisitions & mergers, inaugurations of different products and services, partnerships & joint ventures, MoU agreements, VC & funding activities, R&D activities, and geographic expansion among other noteworthy activities by key players of the agricultural biologicals market are appropriately highlighted in the report.

There increasing demand for supreme quality crops globally has led to the development of crops that can resist pest attacks to some extent with the help of agricultural biological driving the global market. Environmental damage caused due to the use of large quantities of harmful chemicals for crop protection is creating a demand for biological products that can replace the harmful chemicals hence boosting the global agricultural biologicals market.

logoReport Scope

Report Attribute

Details

Market Size in 2019

USD 7.2 Billion

Projected Market Size in 2026

USD 13.5 Billion

CAGR Growth Rate

9.4% CAGR

Base Year

2019

Forecast Years

2020-2026

Key Market Players

Isagro S.P.A., Bayer AG, Marrone Bio Innovations, Vegalab S.A., Valent Biosciences, Biolchim S.P.A., Valagro, Symborg, Seipasa, Biobest Group Nv, Agrinos Inc., CBF China Bio-Fertilizer AG, Mapleton Agri Biotec, Symborg S.L., BASF SE, Syngenta Crop Protection AG, UPL, Evogene Ltd, Lallemand, Stockton Bio-AG, Rizobacter Argentina SA, Koppert Biological Systems, Andermatt Biocontrol AG, Verdesian Life Sciences, LLC, Kiwa Bio-Tech Products Group Corporation, Sigma Agri-Science, LLC, Novozymes A/S, National Fertilizers Ltd., and Others

Key Segment

By Product, Crop, Application, and Region

Major Regions Covered

North America, Europe, Asia Pacific, Latin America, and the Middle East & Africa

Purchase Options

Request customized purchase options to meet your research needs.Explore purchase options

North America region dominated the global agricultural biologicals market in 2019 with a market share of around 35% and is anticipated to continue its dominance in the forecast period. The growth of the agricultural biologicals market in the North America region is attributed to the ever-improving agricultural activities such as technological advancements, favorable government regulations, improving farming techniques, and continuous research and development initiatives.

The agricultural biologicals market research report delivers an acute valuation and taxonomy of the agricultural biologicals industry by practically splitting the market on the basis of different product types, crop types, applications, and regions. Through the analysis of the historical and projected trends, all the segments and sub-segments were evaluated through the bottom-up approach, and different market sizes have been projected for FY 2020 to FY 2026.

The regional segmentation of the agricultural biologicals industry includes the complete classification of all the major continents including North America, Latin America, Europe, Asia Pacific, and the Middle East & Africa. Further, country-wise data for the agricultural biologicals industry is provided for the leading economies of the world.

The agricultural biologicals market is segmented based on product type, crop type, and application. On the basis of product type segmentation, the market is classified into biopesticides, biostimulants, biofertilizers, and others. In terms of crop type segmentation, the market is bifurcated into cereals & grains, oilseeds & pulses, fruits & vegetables, and others. On the basis of application segmentation, the market is classified into foliar spray, seed treatment, soil treatment, and post-harvest.

logoSome of the essential players operating in the agricultural biologicals market, but not restricted to include

  • Isagro S.P.A.
  • Bayer AG
  • Marrone Bio Innovations
  • Vegalab S.A.
  • Valent Biosciences
  • Biolchim S.P.A.
  • Valagro
  • Symborg
  • Seipasa
  • Biobest Group Nv
  • Agrinos Inc.
  • CBF China Bio-Fertilizer AG
  • Mapleton Agri Biotec
  • Symborg S.L.
  • BASF SE
  • Syngenta Crop Protection AG
  • UPL
  • Evogene Ltd
  • Lallemand
  • Stockton Bio-AG
  • Rizobacter Argentina SA
  • Koppert Biological Systems
  • Andermatt Biocontrol AG
  • Verdesian Life Sciences LLC
  • Kiwa Bio-Tech Products Group Corporation
  • Sigma Agri-Science LLC
  • Novozymes A/S
  • National Fertilizers Ltd.
  • and others.

The taxonomy of the agricultural biologicals industry by its scope and segmentation is as follows:

logo By Product Type Segmentation Analysis

  • Biopesticides
  • Biostimulants
  • Biofertilizers
  • Others

logo By Crop Type Segmentation Analysis

  • Cereals & Grains
  • Oilseeds & Pulses
  • Fruits & Vegetables
  • Others

logo By Application Segmentation Analysis

  • Foliar Spray
  • Seed Treatment
  • Soil Treatment
  • Post-harvest

logo By Regional Segmentation Analysis

  • North America
    • The U.S.
    • Canada
  • Europe
    • Germany
    • The UK
    • France
    • Spain
    • Italy
    • Rest of Europe
  • Asia Pacific
    • China
    • Japan
    • India
    • South Korea
    • Southeast Asia
    • Rest of Asia Pacific
  • Latin America
    • Brazil
    • Mexico
    • Rest of Latin America
  • Middle East & Africa
    • GCC
    • South Africa
    • Rest of Middle East & Africa

Table of Content

  1. Chapter 1 Executive Summary
    1. 1.1. Introduction of Agricultural Biologicals
    2. 1.2. Global Agricultural Biologicals Market, 2019 & 2026 (USD Million)
    3. 1.3. Global Agricultural Biologicals Market, 2016 – 2026 (USD Million) (Kilo Tons)
    4. 1.4. Global Agricultural Biologicals Market Absolute Revenue Opportunity, 2016 – 2026 (USD Million)
    5. 1.5. Global Agricultural Biologicals Market Incremental Revenue Opportunity, 2020 – 2026 (USD Million)
  2. Chapter 2 Agricultural Biologicals Market – Product Type Analysis
    1. 2.1. Global Agricultural Biologicals Market – Product Type Overview
    2. 2.2. Global Agricultural Biologicals Market Share, by Product Type, 2019 & 2026 (USD Million)
    3. 2.3. Global Agricultural Biologicals Market share, by Product Type, 2019 & 2026 (Kilo Tons)
    4. 2.4. Biopesticides
      1. 2.4.1. Global Biopesticides Agricultural Biologicals Market, 2016 – 2026 (USD Million)
      2. 2.4.2. Global Biopesticides Agricultural Biologicals Market, 2016 – 2026 (Kilo Tons)
    5. 2.5. Biostimulants
      1. 2.5.1. Global Biostimulants Agricultural Biologicals Market, 2016 – 2026 (USD Million)
      2. 2.5.2. Global Biostimulants Agricultural Biologicals Market, 2016 – 2026 (Kilo Tons)
    6. 2.6. Biofertilizers
      1. 2.6.1. Global Biofertilizers Agricultural Biologicals Market, 2016 – 2026 (USD Million)
      2. 2.6.2. Global Biofertilizers Agricultural Biologicals Market, 2016 – 2026 (Kilo Tons)
    7. 2.7. Others
      1. 2.7.1. Global Others Agricultural Biologicals Market, 2016 – 2026 (USD Million)
      2. 2.7.2. Global Others Agricultural Biologicals Market, 2016 – 2026 (Kilo Tons)
  3. Chapter 3 Agricultural Biologicals Market – Crop Type Analysis
    1. 3.1. Global Agricultural Biologicals Market – Crop Type Overview
    2. 3.2. Global Agricultural Biologicals Market Share, by Crop Type, 2019 & 2026 (USD Million)
    3. 3.3. Global Agricultural Biologicals Market share, by Crop Type, 2019 & 2026 (Kilo Tons)
    4. 3.4. Cereals & Grains
      1. 3.4.1. Global Cereals & Grains Agricultural Biologicals Market, 2016 – 2026 (USD Million)
      2. 3.4.2. Global Cereals & Grains Agricultural Biologicals Market, 2016 – 2026 (Kilo Tons)
    5. 3.5. Oilseeds & Pulses
      1. 3.5.1. Global Oilseeds & Pulses Agricultural Biologicals Market, 2016 – 2026 (USD Million)
      2. 3.5.2. Global Oilseeds & Pulses Agricultural Biologicals Market, 2016 – 2026 (Kilo Tons)
    6. 3.6. Fruits & Vegetables
      1. 3.6.1. Global Fruits & Vegetables Agricultural Biologicals Market, 2016 – 2026 (USD Million)
      2. 3.6.2. Global Fruits & Vegetables Agricultural Biologicals Market, 2016 – 2026 (Kilo Tons)
    7. 3.7. Others
      1. 3.7.1. Global Others Agricultural Biologicals Market, 2016 – 2026 (USD Million)
      2. 3.7.2. Global Others Agricultural Biologicals Market, 2016 – 2026 (Kilo Tons)
  4. Chapter 4 Agricultural Biologicals Market – Application Analysis
    1. 4.1. Global Agricultural Biologicals Market – Application Overview
    2. 4.2. Global Agricultural Biologicals Market Share, by Application, 2019 & 2026 (USD Million)
    3. 4.3. Global Agricultural Biologicals Market share, by Application, 2019 & 2026 (Kilo Tons)
    4. 4.4. Foliar Spray
      1. 4.4.1. Global Foliar Spray Agricultural Biologicals Market, 2016 – 2026 (USD Million)
      2. 4.4.2. Global Foliar Spray Agricultural Biologicals Market, 2016 – 2026 (Kilo Tons)
    5. 4.5. Seed Treatment
      1. 4.5.1. Global Seed Treatment Agricultural Biologicals Market, 2016 – 2026 (USD Million)
      2. 4.5.2. Global Seed Treatment Agricultural Biologicals Market, 2016 – 2026 (Kilo Tons)
    6. 4.6. Soil Treatment
      1. 4.6.1. Global Soil Treatment Agricultural Biologicals Market, 2016 – 2026 (USD Million)
      2. 4.6.2. Global Soil Treatment Agricultural Biologicals Market, 2016 – 2026 (Kilo Tons)
    7. 4.7. Post-harvest
      1. 4.7.1. Global Post-harvest Agricultural Biologicals Market, 2016 – 2026 (USD Million)
      2. 4.7.2. Global Post-harvest Agricultural Biologicals Market, 2016 – 2026 (Kilo Tons)
  5. Chapter 5 Agricultural Biologicals Market – Regional Analysis
    1. 5.1. Global Agricultural Biologicals Market Regional Overview
    2. 5.2. Global Agricultural Biologicals Market Share, by Region, 2019 & 2026 (USD Million)
    3. 5.3. Global Agricultural Biologicals Market Share, by Region, 2019 & 2026 (Kilo Tons)
    4. 5.4. North America
      1. 5.4.1. North America Agricultural Biologicals Market, 2016 – 2026 (USD Million)
        1. 5.4.1.1. North America Agricultural Biologicals Market, by Country, 2016 – 2026 (USD Million)
      2. 5.4.2. North America Market, 2016 – 2026 (Kilo Tons)
        1. 5.4.2.1. North America Agricultural Biologicals Market, by Country, 2016 – 2026 (Kilo Tons)
      3. 5.4.3. North America Agricultural Biologicals Market, by Product Type, 2016 – 2026
        1. 5.4.3.1. North America Agricultural Biologicals Market, by Product Type, 2016 – 2026 (USD Million)
        2. 5.4.3.2. North America Agricultural Biologicals Market, by Product Type, 2016 – 2026 (Kilo Tons)
      4. 5.4.4. North America Agricultural Biologicals Market, by Crop Type, 2016 – 2026
        1. 5.4.4.1. North America Agricultural Biologicals Market, by Crop Type, 2016 – 2026 (USD Million)
        2. 5.4.4.2. North America Agricultural Biologicals Market, by Crop Type, 2016 – 2026 (Kilo Tons)
      5. 5.4.5. North America Agricultural Biologicals Market, by Application, 2016 – 2026
        1. 5.4.5.1. North America Agricultural Biologicals Market, by Application, 2016 – 2026 (USD Million)
        2. 5.4.5.2. North America Agricultural Biologicals Market, by Application, 2016 – 2026 (Kilo Tons)
      6. 5.4.6. U.S.
        1. 5.4.6.1. U.S. Agricultural Biologicals Market, 2016 – 2026 (USD Million)
        2. 5.4.6.2. U.S. Agricultural Biologicals Market, 2016 – 2026 (Kilo Tons)
      7. 5.4.7. Canada
        1. 5.4.7.1. Canada Agricultural Biologicals Market, 2016 – 2026 (USD Million)
        2. 5.4.7.2. Canada Agricultural Biologicals Market, 2016 – 2026 (Kilo Tons)
    5. 5.5. Europe
      1. 5.5.1. Europe Agricultural Biologicals Market, 2016 – 2026 (USD Million)
        1. 5.5.1.1. Europe Agricultural Biologicals Market, by Country, 2016 – 2026 (USD Million)
      2. 5.5.2. Europe Market, 2016 – 2026 (Kilo Tons)
        1. 5.5.2.1. Europe Agricultural Biologicals Market, by Country, 2016 – 2026 (Kilo Tons)
      3. 5.5.3. Europe Agricultural Biologicals Market, by Product Type, 2016 – 2026
        1. 5.5.3.1. Europe Agricultural Biologicals Market, by Product Type, 2016 – 2026 (USD Million)
        2. 5.5.3.2. Europe Agricultural Biologicals Market, by Product Type, 2016 – 2026 (Kilo Tons)
      4. 5.5.4. Europe Agricultural Biologicals Market, by Crop Type, 2016 – 2026
        1. 5.5.4.1. Europe Agricultural Biologicals Market, by Crop Type, 2016 – 2026 (USD Million)
        2. 5.5.4.2. Europe Agricultural Biologicals Market, by Crop Type, 2016 – 2026 (Kilo Tons)
      5. 5.5.5. Europe Agricultural Biologicals Market, by Application, 2016 – 2026
        1. 5.5.5.1. Europe Agricultural Biologicals Market, by Application, 2016 – 2026 (USD Million)
        2. 5.5.5.2. Europe Agricultural Biologicals Market, by Application, 2016 – 2026 (Kilo Tons)
      6. 5.5.6. Germany
        1. 5.5.6.1. Germany Agricultural Biologicals Market, 2016 – 2026 (USD Million)
        2. 5.5.6.2. Germany Agricultural Biologicals Market, 2016 – 2026 (Kilo Tons)
      7. 5.5.7. France
        1. 5.5.7.1. France Agricultural Biologicals Market, 2016 – 2026 (USD Million)
        2. 5.5.7.2. France Agricultural Biologicals Market, 2016 – 2026 (Kilo Tons)
      8. 5.5.8. U.K.
        1. 5.5.8.1. U.K. Agricultural Biologicals Market, 2016 – 2026 (USD Million)
        2. 5.5.8.2. U.K. Agricultural Biologicals Market, 2016 – 2026 (Kilo Tons)
      9. 5.5.9. Italy
        1. 5.5.9.1. Italy Agricultural Biologicals Market, 2016 – 2026 (USD Million)
        2. 5.5.9.2. Italy Agricultural Biologicals Market, 2016 – 2026 (Kilo Tons)
      10. 5.5.10. Spain
        1. 5.5.10.1. Spain Agricultural Biologicals Market, 2016 – 2026 (USD Million)
        2. 5.5.10.2. Spain Agricultural Biologicals Market, 2016 – 2026 (Kilo Tons)
      11. 5.5.11. Rest of Europe
        1. 5.5.11.1. Rest of Europe Agricultural Biologicals Market, 2016 – 2026 (USD Million)
        2. 5.5.11.2. Rest of Europe Agricultural Biologicals Market, 2016 – 2026 (Kilo Tons)
    6. 5.6. Asia Pacific
      1. 5.6.1. Asia Pacific Agricultural Biologicals Market, 2016 – 2026 (USD Million)
        1. 5.6.1.1. Asia Pacific Agricultural Biologicals Market, by Country, 2016 – 2026 (USD Million)
      2. 5.6.2. Asia Pacific Market, 2016 – 2026 (Kilo Tons)
        1. 5.6.2.1. Asia Pacific Agricultural Biologicals Market, by Country, 2016 – 2026 (Kilo Tons)
      3. 5.6.3. Asia Pacific Agricultural Biologicals Market, by Product Type, 2016 – 2026
        1. 5.6.3.1. Asia Pacific Agricultural Biologicals Market, by Product Type, 2016 – 2026 (USD Million)
        2. 5.6.3.2. Asia Pacific Agricultural Biologicals Market, by Product Type, 2016 – 2026 (Kilo Tons)
      4. 5.6.4. Asia Pacific Agricultural Biologicals Market, by Crop Type, 2016 – 2026
        1. 5.6.4.1. Asia Pacific Agricultural Biologicals Market, by Crop Type, 2016 – 2026 (USD Million)
        2. 5.6.4.2. Asia Pacific Agricultural Biologicals Market, by Crop Type, 2016 – 2026 (Kilo Tons)
      5. 5.6.5. Asia Pacific Agricultural Biologicals Market, by Application, 2016 – 2026
        1. 5.6.5.1. Asia Pacific Agricultural Biologicals Market, by Application, 2016 – 2026 (USD Million)
        2. 5.6.5.2. Asia Pacific Agricultural Biologicals Market, by Application, 2016 – 2026 (Kilo Tons)
      6. 5.6.6. China
        1. 5.6.6.1. China Agricultural Biologicals Market, 2016 – 2026 (USD Million)
        2. 5.6.6.2. China Agricultural Biologicals Market, 2016 – 2026 (Kilo Tons)
      7. 5.6.7. Japan
        1. 5.6.7.1. Japan Agricultural Biologicals Market, 2016 – 2026 (USD Million)
        2. 5.6.7.2. Japan Agricultural Biologicals Market, 2016 – 2026 (Kilo Tons)
      8. 5.6.8. India
        1. 5.6.8.1. India Agricultural Biologicals Market, 2016 – 2026 (USD Million)
        2. 5.6.8.2. India Agricultural Biologicals Market, 2016 – 2026 (Kilo Tons)
      9. 5.6.9. South Korea
        1. 5.6.9.1. South Korea Agricultural Biologicals Market, 2016 – 2026 (USD Million)
        2. 5.6.9.2. South Korea Agricultural Biologicals Market, 2016 – 2026 (Kilo Tons)
      10. 5.6.10. South-East Asia
        1. 5.6.10.1. South-East Asia Agricultural Biologicals Market, 2016 – 2026 (USD Million)
        2. 5.6.10.2. South-East Asia Agricultural Biologicals Market, 2016 – 2026 (Kilo Tons)
      11. 5.6.11. Rest of Asia Pacific
        1. 5.6.11.1. Rest of Asia Pacific Agricultural Biologicals Market, 2016 – 2026 (USD Million)
        2. 5.6.11.2. Rest of Asia Pacific Agricultural Biologicals Market, 2016 – 2026 (Kilo Tons)
    7. 5.7. Latin America
      1. 5.7.1. Latin America Agricultural Biologicals Market, 2016 – 2026 (USD Million)
        1. 5.7.1.1. Latin America Agricultural Biologicals Market, by Country, 2016 – 2026 (USD Million)
      2. 5.7.2. Latin America Market, 2016 – 2026 (Kilo Tons)
        1. 5.7.2.1. Latin America Agricultural Biologicals Market, by Country, 2016 – 2026 (Kilo Tons)
      3. 5.7.3. Latin America Agricultural Biologicals Market, by Product Type, 2016 – 2026
        1. 5.7.3.1. Latin America Agricultural Biologicals Market, by Product Type, 2016 – 2026 (USD Million)
        2. 5.7.3.2. Latin America Agricultural Biologicals Market, by Product Type, 2016 – 2026 (Kilo Tons)
      4. 5.7.4. Latin America Agricultural Biologicals Market, by Crop Type, 2016 – 2026
        1. 5.7.4.1. Latin America Agricultural Biologicals Market, by Crop Type, 2016 – 2026 (USD Million)
        2. 5.7.4.2. Latin America Agricultural Biologicals Market, by Crop Type, 2016 – 2026 (Kilo Tons)
      5. 5.7.5. Latin America Agricultural Biologicals Market, by Application, 2016 – 2026
        1. 5.7.5.1. Latin America Agricultural Biologicals Market, by Application, 2016 – 2026 (USD Million)
        2. 5.7.5.2. Latin America Agricultural Biologicals Market, by Application, 2016 – 2026 (Kilo Tons)
      6. 5.7.6. Brazil
        1. 5.7.6.1. Brazil Agricultural Biologicals Market, 2016 – 2026 (USD Million)
        2. 5.7.6.2. Brazil Agricultural Biologicals Market, 2016 – 2026 (Kilo Tons)
      7. 5.7.7. Mexico
        1. 5.7.7.1. Mexico Agricultural Biologicals Market, 2016 – 2026 (USD Million)
        2. 5.7.7.2. Mexico Agricultural Biologicals Market, 2016 – 2026 (Kilo Tons)
      8. 5.7.8. Rest of Latin America
        1. 5.7.8.1. Rest of Latin America Agricultural Biologicals Market, 2016 – 2026 (USD Million)
        2. 5.7.8.2. Rest of Latin America Agricultural Biologicals Market, 2016 – 2026 (Kilo Tons)
    8. 5.8. The Middle-East and Africa
      1. 5.8.1. The Middle-East and Africa Agricultural Biologicals Market, 2016 – 2026 (USD Million)
        1. 5.8.1.1. The Middle-East and Africa Agricultural Biologicals Market, by Country, 2016 – 2026 (USD Million)
      2. 5.8.2. The Middle-East and Africa Market, 2016 – 2026 (Kilo Tons)
        1. 5.8.2.1. The Middle-East and Africa Agricultural Biologicals Market, by Country, 2016 – 2026 (Kilo Tons)
      3. 5.8.3. The Middle-East and Africa Agricultural Biologicals Market, by Product Type, 2016 – 2026
        1. 5.8.3.1. The Middle-East and Africa Agricultural Biologicals Market, by Product Type, 2016 – 2026 (USD Million)
        2. 5.8.3.2. The Middle-East and Africa Agricultural Biologicals Market, by Product Type, 2016 – 2026 (Kilo Tons)
      4. 5.8.4. The Middle-East and Africa Agricultural Biologicals Market, by Crop Type, 2016 – 2026
        1. 5.8.4.1. The Middle-East and Africa Agricultural Biologicals Market, by Crop Type, 2016 – 2026 (USD Million)
        2. 5.8.4.2. The Middle-East and Africa Agricultural Biologicals Market, by Crop Type, 2016 – 2026 (Kilo Tons)
      5. 5.8.5. The Middle-East and Africa Agricultural Biologicals Market, by Application, 2016 – 2026
        1. 5.8.5.1. The Middle-East and Africa Agricultural Biologicals Market, by Application, 2016 – 2026 (USD Million)
        2. 5.8.5.2. The Middle-East and Africa Agricultural Biologicals Market, by Application, 2016 – 2026 (Kilo Tons)
      6. 5.8.6. GCC Countries
        1. 5.8.6.1. GCC Countries Agricultural Biologicals Market, 2016 – 2026 (USD Million)
        2. 5.8.6.2. GCC Countries Agricultural Biologicals Market, 2016 – 2026 (Kilo Tons)
      7. 5.8.7. South Africa
        1. 5.8.7.1. South Africa Agricultural Biologicals Market, 2016 – 2026 (USD Million)
        2. 5.8.7.2. South Africa Agricultural Biologicals Market, 2016 – 2026 (Kilo Tons)
      8. 5.8.8. Rest of Middle-East Africa
        1. 5.8.8.1. Rest of Middle-East Africa Agricultural Biologicals Market, 2016 – 2026 (USD Million)
        2. 5.8.8.2. Rest of Middle-East Africa Agricultural Biologicals Market, 2016 – 2026 (Kilo Tons)
  6. Chapter 6 Agricultural Biologicals Production, Consumption, Export, Import by Regions
    1. 6.1. Global Agricultural Biologicals Production and Consumption, 2016 – 2026 (Kilo Tons)
    2. 6.2. Global Import and Export Analysis, by Region
  7. Chapter 7 Agricultural Biologicals Market – Competitive Landscape
    1. 7.1. Competitor Market Share – Revenue
    2. 7.2. Market Concentration Rate Analysis, Top 3 and Top 5 Players
    3. 7.3. Competitor Market Share – Volume
    4. 7.4. Strategic Developments
      1. 7.4.1. Acquisitions and Mergers
      2. 7.4.2. New Products
      3. 7.4.3. Research & Development Activities
  8. Chapter 8 Company Profiles
    1. 8.1. BASF SE
      1. 8.1.1. Company Overview
      2. 8.1.2. Product/Service Portfolio
      3. 8.1.3. BASF SE Sales, Revenue, Price, and Gross Margin
      4. 8.1.4. BASF SE Revenue and Growth Rate
      5. 8.1.5. BASF SE Market Share
      6. 8.1.6. Recent Initiatives, Funding/VC Activities, and Technological Innovations
    2. 8.2. Isagro S.P.A.
      1. 8.2.1. Company Overview
      2. 8.2.2. Product/Service Portfolio
      3. 8.2.3. Isagro S.P.A. Sales, Revenue, Price, and Gross Margin
      4. 8.2.4. Isagro S.P.A. Revenue and Growth Rate
      5. 8.2.5. Isagro S.P.A. Market Share
      6. 8.2.6. Recent Initiatives, Funding/VC Activities, and Technological Innovations
    3. 8.3. Syngenta Crop Protection AG
      1. 8.3.1. Company Overview
      2. 8.3.2. Product/Service Portfolio
      3. 8.3.3. Syngenta Crop Protection AG Sales, Revenue, Price, and Gross Margin
      4. 8.3.4. Syngenta Crop Protection AG Revenue and Growth Rate
      5. 8.3.5. Syngenta Crop Protection AG Market Share
      6. 8.3.6. Recent Initiatives, Funding/VC Activities, and Technological Innovations
    4. 8.4. Bayer AG
      1. 8.4.1. Company Overview
      2. 8.4.2. Product/Service Portfolio
      3. 8.4.3. Bayer AG Sales, Revenue, Price, and Gross Margin
      4. 8.4.4. Bayer AG Revenue and Growth Rate
      5. 8.4.5. Bayer AG Market Share
      6. 8.4.6. Recent Initiatives, Funding/VC Activities, and Technological Innovations
    5. 8.5. UPL
      1. 8.5.1. Company Overview
      2. 8.5.2. Product/Service Portfolio
      3. 8.5.3. UPL Sales, Revenue, Price, and Gross Margin
      4. 8.5.4. UPL Revenue and Growth Rate
      5. 8.5.5. UPL Market Share
      6. 8.5.6. Recent Initiatives, Funding/VC Activities, and Technological Innovations
    6. 8.6. Marrone Bio Innovations
      1. 8.6.1. Company Overview
      2. 8.6.2. Product/Service Portfolio
      3. 8.6.3. Marrone Bio Innovations Sales, Revenue, Price, and Gross Margin
      4. 8.6.4. Marrone Bio Innovations Revenue and Growth Rate
      5. 8.6.5. Marrone Bio Innovations Market Share
      6. 8.6.6. Recent Initiatives, Funding/VC Activities, and Technological Innovations
    7. 8.7. Evogene Ltd
      1. 8.7.1. Company Overview
      2. 8.7.2. Product/Service Portfolio
      3. 8.7.3. Evogene Ltd Sales, Revenue, Price, and Gross Margin
      4. 8.7.4. Evogene Ltd Revenue and Growth Rate
      5. 8.7.5. Evogene Ltd Market Share
      6. 8.7.6. Recent Initiatives, Funding/VC Activities, and Technological Innovations
    8. 8.8. Vegalab S.A.
      1. 8.8.1. Company Overview
      2. 8.8.2. Product/Service Portfolio
      3. 8.8.3. Vegalab S.A. Sales, Revenue, Price, and Gross Margin
      4. 8.8.4. Vegalab S.A. Revenue and Growth Rate
      5. 8.8.5. Vegalab S.A. Market Share
      6. 8.8.6. Recent Initiatives, Funding/VC Activities, and Technological Innovations
    9. 8.9. Lallemand
      1. 8.9.1. Company Overview
      2. 8.9.2. Product/Service Portfolio
      3. 8.9.3. Lallemand Sales, Revenue, Price, and Gross Margin
      4. 8.9.4. Lallemand Revenue and Growth Rate
      5. 8.9.5. Lallemand Market Share
      6. 8.9.6. Recent Initiatives, Funding/VC Activities, and Technological Innovations
    10. 8.10. Valent Biosciences
      1. 8.10.1. Company Overview
      2. 8.10.2. Product/Service Portfolio
      3. 8.10.3. Valent Biosciences Sales, Revenue, Price, and Gross Margin
      4. 8.10.4. Valent Biosciences Revenue and Growth Rate
      5. 8.10.5. Valent Biosciences Market Share
      6. 8.10.6. Recent Initiatives, Funding/VC Activities, and Technological Innovations
    11. 8.11. Stockton Bio-AG
      1. 8.11.1. Company Overview
      2. 8.11.2. Product/Service Portfolio
      3. 8.11.3. Stockton Bio-AG Sales, Revenue, Price, and Gross Margin
      4. 8.11.4. Stockton Bio-AG Revenue and Growth Rate
      5. 8.11.5. Stockton Bio-AG Market Share
      6. 8.11.6. Recent Initiatives, Funding/VC Activities, and Technological Innovations
    12. 8.12. Biolchim S.P.A.
      1. 8.12.1. Company Overview
      2. 8.12.2. Product/Service Portfolio
      3. 8.12.3. Biolchim S.P.A. Sales, Revenue, Price, and Gross Margin
      4. 8.12.4. Biolchim S.P.A. Revenue and Growth Rate
      5. 8.12.5. Biolchim S.P.A. Market Share
      6. 8.12.6. Recent Initiatives, Funding/VC Activities, and Technological Innovations
    13. 8.13. Rizobacter Argentina SA
      1. 8.13.1. Company Overview
      2. 8.13.2. Product/Service Portfolio
      3. 8.13.3. Rizobacter Argentina SA Sales, Revenue, Price, and Gross Margin
      4. 8.13.4. Rizobacter Argentina SA Revenue and Growth Rate
      5. 8.13.5. Rizobacter Argentina SA Market Share
      6. 8.13.6. Recent Initiatives, Funding/VC Activities, and Technological Innovations
    14. 8.14. Valagro
      1. 8.14.1. Company Overview
      2. 8.14.2. Product/Service Portfolio
      3. 8.14.3. Valagro Sales, Revenue, Price, and Gross Margin
      4. 8.14.4. Valagro Revenue and Growth Rate
      5. 8.14.5. Valagro Market Share
      6. 8.14.6. Recent Initiatives, Funding/VC Activities, and Technological Innovations
    15. 8.15. Koppert Biological Systems
      1. 8.15.1. Company Overview
      2. 8.15.2. Product/Service Portfolio
      3. 8.15.3. Koppert Biological Systems Sales, Revenue, Price, and Gross Margin
      4. 8.15.4. Koppert Biological Systems Revenue and Growth Rate
      5. 8.15.5. Koppert Biological Systems Market Share
      6. 8.15.6. Recent Initiatives, Funding/VC Activities, and Technological Innovations
    16. 8.16. Symborg
      1. 8.16.1. Company Overview
      2. 8.16.2. Product/Service Portfolio
      3. 8.16.3. Symborg Sales, Revenue, Price, and Gross Margin
      4. 8.16.4. Symborg Revenue and Growth Rate
      5. 8.16.5. Symborg Market Share
      6. 8.16.6. Recent Initiatives, Funding/VC Activities, and Technological Innovations
    17. 8.17. Andermatt Biocontrol AG
      1. 8.17.1. Company Overview
      2. 8.17.2. Product/Service Portfolio
      3. 8.17.3. Andermatt Biocontrol AG Sales, Revenue, Price, and Gross Margin
      4. 8.17.4. Andermatt Biocontrol AG Revenue and Growth Rate
      5. 8.17.5. Andermatt Biocontrol AG Market Share
      6. 8.17.6. Recent Initiatives, Funding/VC Activities, and Technological Innovations
    18. 8.18. Seipasa
      1. 8.18.1. Company Overview
      2. 8.18.2. Product/Service Portfolio
      3. 8.18.3. Seipasa Sales, Revenue, Price, and Gross Margin
      4. 8.18.4. Seipasa Revenue and Growth Rate
      5. 8.18.5. Seipasa Market Share
      6. 8.18.6. Recent Initiatives, Funding/VC Activities, and Technological Innovations
    19. 8.19. Verdesian Life Sciences, LLC
      1. 8.19.1. Company Overview
      2. 8.19.2. Product/Service Portfolio
      3. 8.19.3. Verdesian Life Sciences, LLC Sales, Revenue, Price, and Gross Margin
      4. 8.19.4. Verdesian Life Sciences, LLC Revenue and Growth Rate
      5. 8.19.5. Verdesian Life Sciences, LLC Market Share
      6. 8.19.6. Recent Initiatives, Funding/VC Activities, and Technological Innovations
    20. 8.20. Biobest Group Nv
      1. 8.20.1. Company Overview
      2. 8.20.2. Product/Service Portfolio
      3. 8.20.3. Biobest Group Nv Sales, Revenue, Price, and Gross Margin
      4. 8.20.4. Biobest Group Nv Revenue and Growth Rate
      5. 8.20.5. Biobest Group Nv Market Share
      6. 8.20.6. Recent Initiatives, Funding/VC Activities, and Technological Innovations
    21. 8.21. Kiwa Bio-Tech Products Group Corporation
      1. 8.21.1. Company Overview
      2. 8.21.2. Product/Service Portfolio
      3. 8.21.3. Kiwa Bio-Tech Products Group Corporation Sales, Revenue, Price, and Gross Margin
      4. 8.21.4. Kiwa Bio-Tech Products Group Corporation Revenue and Growth Rate
      5. 8.21.5. Kiwa Bio-Tech Products Group Corporation Market Share
      6. 8.21.6. Recent Initiatives, Funding/VC Activities, and Technological Innovations
    22. 8.22. Agrinos Inc.
      1. 8.22.1. Company Overview
      2. 8.22.2. Product/Service Portfolio
      3. 8.22.3. Agrinos Inc. Sales, Revenue, Price, and Gross Margin
      4. 8.22.4. Agrinos Inc. Revenue and Growth Rate
      5. 8.22.5. Agrinos Inc. Market Share
      6. 8.22.6. Recent Initiatives, Funding/VC Activities, and Technological Innovations
    23. 8.23. Sigma Agri-Science, LLC
      1. 8.23.1. Company Overview
      2. 8.23.2. Product/Service Portfolio
      3. 8.23.3. Sigma Agri-Science, LLC Sales, Revenue, Price, and Gross Margin
      4. 8.23.4. Sigma Agri-Science, LLC Revenue and Growth Rate
      5. 8.23.5. Sigma Agri-Science, LLC Market Share
      6. 8.23.6. Recent Initiatives, Funding/VC Activities, and Technological Innovations
    24. 8.24. CBF China Bio-Fertilizer AG
      1. 8.24.1. Company Overview
      2. 8.24.2. Product/Service Portfolio
      3. 8.24.3. CBF China Bio-Fertilizer AG Sales, Revenue, Price, and Gross Margin
      4. 8.24.4. CBF China Bio-Fertilizer AG Revenue and Growth Rate
      5. 8.24.5. CBF China Bio-Fertilizer AG Market Share
      6. 8.24.6. Recent Initiatives, Funding/VC Activities, and Technological Innovations
    25. 8.25. Novozymes A/S
      1. 8.25.1. Company Overview
      2. 8.25.2. Product/Service Portfolio
      3. 8.25.3. Novozymes A/S Sales, Revenue, Price, and Gross Margin
      4. 8.25.4. Novozymes A/S Revenue and Growth Rate
      5. 8.25.5. Novozymes A/S Market Share
      6. 8.25.6. Recent Initiatives, Funding/VC Activities, and Technological Innovations
    26. 8.26. Mapleton Agri Biotec
      1. 8.26.1. Company Overview
      2. 8.26.2. Product/Service Portfolio
      3. 8.26.3. Mapleton Agri Biotec Sales, Revenue, Price, and Gross Margin
      4. 8.26.4. Mapleton Agri Biotec Revenue and Growth Rate
      5. 8.26.5. Mapleton Agri Biotec Market Share
      6. 8.26.6. Recent Initiatives, Funding/VC Activities, and Technological Innovations
    27. 8.27. National Fertilizers Ltd.
      1. 8.27.1. Company Overview
      2. 8.27.2. Product/Service Portfolio
      3. 8.27.3. National Fertilizers Ltd. Sales, Revenue, Price, and Gross Margin
      4. 8.27.4. National Fertilizers Ltd. Revenue and Growth Rate
      5. 8.27.5. National Fertilizers Ltd. Market Share
      6. 8.27.6. Recent Initiatives, Funding/VC Activities, and Technological Innovations
    28. 8.28. Symborg S.L.
      1. 8.28.1. Company Overview
      2. 8.28.2. Product/Service Portfolio
      3. 8.28.3. Symborg S.L. Sales, Revenue, Price, and Gross Margin
      4. 8.28.4. Symborg S.L. Revenue and Growth Rate
      5. 8.28.5. Symborg S.L. Market Share
      6. 8.28.6. Recent Initiatives, Funding/VC Activities, and Technological Innovations
  9. Chapter 9 Agricultural Biologicals — Industry Analysis
    1. 9.1. Introduction and Taxonomy
    2. 9.2. Agricultural Biologicals Market – Key Trends
      1. 9.2.1. Market Drivers
      2. 9.2.2. Market Restraints
      3. 9.2.3. Market Opportunities
    3. 9.3. Value Chain Analysis
    4. 9.4. Key Mandates and Regulations
    5. 9.5. Technology Roadmap and Timeline
    6. 9.6. Agricultural Biologicals Market – Attractiveness Analysis
      1. 9.6.1. By Product Type
      2. 9.6.2. By Crop Type
      3. 9.6.3. By Application
      4. 9.6.4. By Region
  10. Chapter 10 Raw Material Analysis
    1. 10.1. Agricultural Biologicals Key Raw Material Analysis
      1. 10.1.1. Key Raw Materials
      2. 10.1.2. Price Trend of Key Raw Materials
    2. 10.2. Key Suppliers of Raw Materials
    3. 10.3. Proportion of Manufacturing Cost Structure
      1. 10.3.1. Raw Materials Cost
      2. 10.3.2. Labor Cost
      3. 10.3.3. Manufacturing Expenses
      4. 10.3.4. Miscellaneous Expenses
    4. 10.4. Manufacturing Cost Analysis of Agricultural Biologicals
  11. Chapter 11 Industrial Chain, Sourcing Strategy, and Downstream Buyers
    1. 11.1. Agricultural Biologicals Industrial Chain Analysis
    2. 11.2. Upstream Raw Materials Sourcing
      1. 11.2.1. Risk Mitigation:
      2. 11.2.2. Supplier Relationships:
      3. 11.2.3. Business Processes:
      4. 11.2.4. Securing the Product:
    3. 11.3. Raw Materials Sources of Agricultural Biologicals Major Manufacturers
    4. 11.4. Downstream Buyers
    5. 11.5. Distributors/Traders List
  12. Chapter 12 Marketing Strategy Analysis, Distributors
    1. 12.1. Marketing Channel
    2. 12.2. Direct Marketing
    3. 12.3. Indirect Marketing
    4. 12.4. Marketing Channel Development Trends
    5. 12.5. Economic/Political Environmental Change
  13. Chapter 13 Report Conclusion & Key Insights
    1. 13.1. Key Insights from Primary Interviews & Surveys Respondents
    2. 13.2. Key Takeaways from Analysts, Consultants, and Industry Leaders
  14. Chapter 14 Research Approach & Methodology
    1. 14.1. Report Description
    2. 14.2. Research Scope
    3. 14.3. Research Methodology
      1. 14.3.1. Secondary Research
      2. 14.3.2. Primary Research
      3. 14.3.3. Statistical Models
        1. 14.3.3.1. Company Share Analysis Model
        2. 14.3.3.2. Revenue Based Modeling
      4. 14.3.4. Research Limitations

      List of Figures

      Fig.1 Product Picture of Agricultural Biologicals
      Fig.2 Global Agricultural Biologicals Market, 2016 – 2026 (USD Million)
      Fig.3 Global Agricultural Biologicals Market, 2016 – 2026 (Kilo Tons)
      Fig.4 Global Agricultural Biologicals Market Absolute Revenue Opportunity, 2016 – 2026 (USD Million)
      Fig.5 Global Agricultural Biologicals Market Incremental Revenue Opportunity, 2020 – 2026 (USD Million)
      Fig.6 Global Agricultural Biologicals Market Share, by Product Type, 2019 & 2026 (USD Million)
      Fig.7 Global Agricultural Biologicals Market Share, by Product Type, 2019 & 2026 (Kilo Tons)
      Fig.8 Global Biopesticides Agricultural Biologicals Market, 2016 – 2026 (USD Million)
      Fig.9 Global Biopesticides Agricultural Biologicals Market, 2016 – 2026 (Kilo Tons)
      Fig.10 Global Biostimulants Agricultural Biologicals Market, 2016 – 2026 (USD Million)
      Fig.11 Global Biostimulants Agricultural Biologicals Market, 2016 – 2026 (Kilo Tons)
      Fig.12 Global Biofertilizers Agricultural Biologicals Market, 2016 – 2026 (USD Million)
      Fig.13 Global Biofertilizers Agricultural Biologicals Market, 2016 – 2026 (Kilo Tons)
      Fig.14 Global Others Agricultural Biologicals Market, 2016 – 2026 (USD Million)
      Fig.15 Global Others Agricultural Biologicals Market, 2016 – 2026 (Kilo Tons)
      Fig.16 Global Agricultural Biologicals Market Share, by Crop Type, 2019 & 2026 (USD Million)
      Fig.17 Global Agricultural Biologicals Market Share, by Crop Type, 2019 & 2026 (Kilo Tons)
      Fig.18 Global Cereals & Grains Agricultural Biologicals Market, 2016 – 2026 (USD Million)
      Fig.19 Global Cereals & Grains Agricultural Biologicals Market, 2016 – 2026 (Kilo Tons)
      Fig.20 Global Oilseeds & Pulses Agricultural Biologicals Market, 2016 – 2026 (USD Million)
      Fig.21 Global Oilseeds & Pulses Agricultural Biologicals Market, 2016 – 2026 (Kilo Tons)
      Fig.22 Global Fruits & Vegetables Agricultural Biologicals Market, 2016 – 2026 (USD Million)
      Fig.23 Global Fruits & Vegetables Agricultural Biologicals Market, 2016 – 2026 (Kilo Tons)
      Fig.24 Global Others Agricultural Biologicals Market, 2016 – 2026 (USD Million)
      Fig.25 Global Others Agricultural Biologicals Market, 2016 – 2026 (Kilo Tons)
      Fig.26 Global Agricultural Biologicals Market Share, by Application, 2019 & 2026 (USD Million)
      Fig.27 Global Agricultural Biologicals Market Share, by Application, 2019 & 2026 (Kilo Tons)
      Fig.28 Global Foliar Spray Agricultural Biologicals Market, 2016 – 2026 (USD Million)
      Fig.29 Global Foliar Spray Agricultural Biologicals Market, 2016 – 2026 (Kilo Tons)
      Fig.30 Global Seed Treatment Agricultural Biologicals Market, 2016 – 2026 (USD Million)
      Fig.31 Global Seed Treatment Agricultural Biologicals Market, 2016 – 2026 (Kilo Tons)
      Fig.32 Global Soil Treatment Agricultural Biologicals Market, 2016 – 2026 (USD Million)
      Fig.33 Global Soil Treatment Agricultural Biologicals Market, 2016 – 2026 (Kilo Tons)
      Fig.34 Global Post-harvest Agricultural Biologicals Market, 2016 – 2026 (USD Million)
      Fig.35 Global Post-harvest Agricultural Biologicals Market, 2016 – 2026 (Kilo Tons)
      Fig.36 Global Agricultural Biologicals Market Share, by Region, 2019 & 2026 (USD Million)
      Fig.37 Global Agricultural Biologicals Market Share, by Region, 2019 & 2026 (Kilo Tons)
      Fig.38 North America Agricultural Biologicals Market, 2016 – 2026 (USD Million)
      Fig.39 North America Agricultural Biologicals Market, 2016 – 2026 (Kilo Tons)
      Fig.40 U.S. Agricultural Biologicals Market, 2016 – 2026 (USD Million)
      Fig.41 U.S. Agricultural Biologicals  Market, 2016 – 2026 (Kilo Tons)
      Fig.42 Canada Agricultural Biologicals Market, 2016 – 2026 (USD Million)
      Fig.43 Canada Agricultural Biologicals  Market, 2016 – 2026 (Kilo Tons)
      Fig.44 Europe Agricultural Biologicals Market, 2016 – 2026 (USD Million)
      Fig.45 Europe Agricultural Biologicals Market, 2016 – 2026 (Kilo Tons)
      Fig.46 Germany Agricultural Biologicals Market, 2016 – 2026 (USD Million)
      Fig.47 Germany Agricultural Biologicals  Market, 2016 – 2026 (Kilo Tons)
      Fig.48 France Agricultural Biologicals Market, 2016 – 2026 (USD Million)
      Fig.49 France Agricultural Biologicals  Market, 2016 – 2026 (Kilo Tons)
      Fig.50 U.K. Agricultural Biologicals Market, 2016 – 2026 (USD Million)
      Fig.51 U.K. Agricultural Biologicals  Market, 2016 – 2026 (Kilo Tons)
      Fig.52 Italy Agricultural Biologicals Market, 2016 – 2026 (USD Million)
      Fig.53 Italy Agricultural Biologicals  Market, 2016 – 2026 (Kilo Tons)
      Fig.54 Spain Agricultural Biologicals Market, 2016 – 2026 (USD Million)
      Fig.55 Spain Agricultural Biologicals  Market, 2016 – 2026 (Kilo Tons)
      Fig.56 Rest of Europe Agricultural Biologicals Market, 2016 – 2026 (USD Million)
      Fig.57 Rest of Europe Agricultural Biologicals  Market, 2016 – 2026 (Kilo Tons)
      Fig.58 Asia Pacific Agricultural Biologicals Market, 2016 – 2026 (USD Million)
      Fig.59 Asia Pacific Agricultural Biologicals Market, 2016 – 2026 (Kilo Tons)
      Fig.60 China Agricultural Biologicals Market, 2016 – 2026 (USD Million)
      Fig.61 China Agricultural Biologicals  Market, 2016 – 2026 (Kilo Tons)
      Fig.62 Japan Agricultural Biologicals Market, 2016 – 2026 (USD Million)
      Fig.63 Japan Agricultural Biologicals  Market, 2016 – 2026 (Kilo Tons)
      Fig.64 India Agricultural Biologicals Market, 2016 – 2026 (USD Million)
      Fig.65 India Agricultural Biologicals  Market, 2016 – 2026 (Kilo Tons)
      Fig.66 South  Korea Agricultural Biologicals Market, 2016 – 2026 (USD Million)
      Fig.67 South  Korea Agricultural Biologicals  Market, 2016 – 2026 (Kilo Tons)
      Fig.68 South-East Asia Agricultural Biologicals Market, 2016 – 2026 (USD Million)
      Fig.69 South-East Asia Agricultural Biologicals  Market, 2016 – 2026 (Kilo Tons)
      Fig.70 Rest of Asia Pacific Agricultural Biologicals Market, 2016 – 2026 (USD Million)
      Fig.71 Rest of Asia Pacific Agricultural Biologicals  Market, 2016 – 2026 (Kilo Tons)
      Fig.72 Latin America Agricultural Biologicals Market, 2016 – 2026 (USD Million)
      Fig.73 Latin America Agricultural Biologicals Market, 2016 – 2026 (Kilo Tons)
      Fig.74 Brazil Agricultural Biologicals Market, 2016 – 2026 (USD Million)
      Fig.75 Brazil Agricultural Biologicals  Market, 2016 – 2026 (Kilo Tons)
      Fig.76 Mexico Agricultural Biologicals Market, 2016 – 2026 (USD Million)
      Fig.77 Mexico Agricultural Biologicals  Market, 2016 – 2026 (Kilo Tons)
      Fig.78 Rest of Latin America Agricultural Biologicals Market, 2016 – 2026 (USD Million)
      Fig.79 Rest of Latin America Agricultural Biologicals  Market, 2016 – 2026 (Kilo Tons)
      Fig.80 The Middle-East and Africa Agricultural Biologicals Market, 2016 – 2026 (USD Million)
      Fig.81 The Middle-East and Africa Agricultural Biologicals Market, 2016 – 2026 (Kilo Tons)
      Fig.82 GCC Countries Agricultural Biologicals Market, 2016 – 2026 (USD Million)
      Fig.83 GCC Countries Agricultural Biologicals  Market, 2016 – 2026 (Kilo Tons)
      Fig.84 South Africa Agricultural Biologicals Market, 2016 – 2026 (USD Million)
      Fig.85 South Africa Agricultural Biologicals  Market, 2016 – 2026 (Kilo Tons)
      Fig.86 Rest of Middle-East Africa Agricultural Biologicals Market, 2016 – 2026 (USD Million)
      Fig.87 Rest of Middle-East Africa Agricultural Biologicals  Market, 2016 – 2026 (Kilo Tons)
      Fig.88 Global Agricultural Biologicals Production and Consumption, 2016 – 2026 (Kilo Tons)
      Fig.89 North America Agricultural Biologicals Production and Consumption, 2016 – 2026 (USD Million) (Kilo Tons)
      Fig.90 Europe Agricultural Biologicals Production and Consumption, 2016 – 2026 (USD Million) (Kilo Tons)
      Fig.91 Asia Pacific Agricultural Biologicals Production and Consumption, 2016 – 2026 (USD Million) (Kilo Tons)
      Fig.92 Latin America Agricultural Biologicals Production and Consumption, 2016 – 2026 (USD Million) (Kilo Tons)
      Fig.93 The Middle-East and Africa Agricultural Biologicals Production and Consumption, 2016 – 2026 (USD Million) (Kilo Tons)
      Fig.94 Competitor Market Share – Revenue
      Fig.95 Competitor Market Share – Volume
      Fig.96 BASF SE Revenue and Growth Rate
      Fig.97 BASF SE Market Share
      Fig.98 Isagro S.P.A. Revenue and Growth Rate
      Fig.99 Isagro S.P.A. Market Share
      Fig.100 Syngenta Crop Protection AG Revenue and Growth Rate
      Fig.101 Syngenta Crop Protection AG Market Share
      Fig.102 Bayer AG Revenue and Growth Rate
      Fig.103 Bayer AG Market Share
      Fig.104 UPL Revenue and Growth Rate
      Fig.105 UPL Market Share
      Fig.106 Marrone Bio Innovations Revenue and Growth Rate
      Fig.107 Marrone Bio Innovations Market Share
      Fig.108 Evogene Ltd Revenue and Growth Rate
      Fig.109 Evogene Ltd Market Share
      Fig.110 Vegalab S.A. Revenue and Growth Rate
      Fig.111 Vegalab S.A. Market Share
      Fig.112 Lallemand Revenue and Growth Rate
      Fig.113 Lallemand Market Share
      Fig.114 Valent Biosciences Revenue and Growth Rate
      Fig.115 Valent Biosciences Market Share
      Fig.116 Stockton Bio-AG Revenue and Growth Rate
      Fig.117 Stockton Bio-AG Market Share
      Fig.118 Biolchim S.P.A. Revenue and Growth Rate
      Fig.119 Biolchim S.P.A. Market Share
      Fig.120 Rizobacter Argentina SA Revenue and Growth Rate
      Fig.121 Rizobacter Argentina SA Market Share
      Fig.122 Valagro Revenue and Growth Rate
      Fig.123 Valagro Market Share
      Fig.124 Koppert Biological Systems Revenue and Growth Rate
      Fig.125 Koppert Biological Systems Market Share
      Fig.126 Symborg Revenue and Growth Rate
      Fig.127 Symborg Market Share
      Fig.128 Andermatt Biocontrol AG Revenue and Growth Rate
      Fig.129 Andermatt Biocontrol AG Market Share
      Fig.130 Seipasa Revenue and Growth Rate
      Fig.131 Seipasa Market Share
      Fig.132 Verdesian Life Sciences, LLC Revenue and Growth Rate
      Fig.133 Verdesian Life Sciences, LLC Market Share
      Fig.134 Biobest Group Nv Revenue and Growth Rate
      Fig.135 Biobest Group Nv Market Share
      Fig.136 Kiwa Bio-Tech Products Group Corporation Revenue and Growth Rate
      Fig.137 Kiwa Bio-Tech Products Group Corporation Market Share
      Fig.138 Agrinos Inc. Revenue and Growth Rate
      Fig.139 Agrinos Inc. Market Share
      Fig.140 Sigma Agri-Science, LLC Revenue and Growth Rate
      Fig.141 Sigma Agri-Science, LLC Market Share
      Fig.142 CBF China Bio-Fertilizer AG Revenue and Growth Rate
      Fig.143 CBF China Bio-Fertilizer AG Market Share
      Fig.144 Novozymes A/S Revenue and Growth Rate
      Fig.145 Novozymes A/S Market Share
      Fig.146 Mapleton Agri Biotec Revenue and Growth Rate
      Fig.147 Mapleton Agri Biotec Market Share
      Fig.148 National Fertilizers Ltd. Revenue and Growth Rate
      Fig.149 National Fertilizers Ltd. Market Share
      Fig.150 Symborg S.L. Revenue and Growth Rate
      Fig.151 Symborg S.L. Market Share
      Fig.152 Market Dynamics
      Fig.153 Global Agricultural Biologicals – Value Chain Analysis
      Fig.154 Key Mandates and Regulations
      Fig.155 Technology Roadmap and Timeline
      Fig.156 Market Attractiveness Analysis – By Product Type
      Fig.157 Market Attractiveness Analysis – By Crop Type
      Fig.158 Market Attractiveness Analysis – By Application
      Fig.159 Market Attractiveness Analysis – By Region
      Fig.160 Manufacturing Cost Structure of Agricultural Biologicals
      Fig.161 Agricultural Biologicals Industrial Chain Analysis
      Fig.162 Market Channels
      Fig.163 Marketing Channel Development Trend
      Fig.164 Growth in World Gross Product, 2008-2018

      List of Tables

      Table 1 Global Agricultural Biologicals Market, 2019 & 2026 (USD Million)
      Table 2 Global Agricultural Biologicals Market, by Product Type, 2016 – 2026 (USD Million)
      Table 3 Global Agricultural Biologicals Market, by Product Type, 2016 – 2026 (Kilo Tons)
      Table 4 Global Agricultural Biologicals Market, by Crop Type, 2016 – 2026 (USD Million)
      Table 5 Global Agricultural Biologicals Market, by Crop Type, 2016 – 2026 (Kilo Tons)
      Table 6 Global Agricultural Biologicals Market, by Application, 2016 – 2026 (USD Million)
      Table 7 Global Agricultural Biologicals Market, by Application, 2016 – 2026 (Kilo Tons)
      Table 8 Global Agricultural Biologicals Market, by Region, 2016 – 2026 (USD Million)
      Table 9 Global Agricultural Biologicals Market, by Region, 2016 – 2026 (Kilo Tons)
      Table 10 North America Agricultural Biologicals Market, by Country, 2016 – 2026 (USD Million)
      Table 11 North America Agricultural Biologicals Market, by Country, 2016 – 2026 (Kilo Tons)
      Table 12 North America Agricultural Biologicals Market, by Product Type, 2016 – 2026 (USD Million)
      Table 13 North America Agricultural Biologicals Market, by Product Type, 2016 – 2026 (Kilo Tons)
      Table 14 North America Agricultural Biologicals Market, by Crop Type, 2016 – 2026 (USD Million)
      Table 15 North America Agricultural Biologicals Market, by Crop Type, 2016 – 2026 (Kilo Tons)
      Table 16 North America Agricultural Biologicals Market, by Application, 2016 – 2026 (USD Million)
      Table 17 North America Agricultural Biologicals Market, by Application, 2016 – 2026 (Kilo Tons)
      Table 18 Europe Agricultural Biologicals Market, by Country, 2016 – 2026 (USD Million)
      Table 19 Europe Agricultural Biologicals Market, by Country, 2016 – 2026 (Kilo Tons)
      Table 20 Europe Agricultural Biologicals Market, by Product Type, 2016 – 2026 (USD Million)
      Table 21 Europe Agricultural Biologicals Market, by Product Type, 2016 – 2026 (Kilo Tons)
      Table 22 Europe Agricultural Biologicals Market, by Crop Type, 2016 – 2026 (USD Million)
      Table 23 Europe Agricultural Biologicals Market, by Crop Type, 2016 – 2026 (Kilo Tons)
      Table 24 Europe Agricultural Biologicals Market, by Application, 2016 – 2026 (USD Million)
      Table 25 Europe Agricultural Biologicals Market, by Application, 2016 – 2026 (Kilo Tons)
      Table 26 Asia Pacific Agricultural Biologicals Market, by Country, 2016 – 2026 (USD Million)
      Table 27 Asia Pacific Agricultural Biologicals Market, by Country, 2016 – 2026 (Kilo Tons)
      Table 28 Asia Pacific Agricultural Biologicals Market, by Product Type, 2016 – 2026 (USD Million)
      Table 29 Asia Pacific Agricultural Biologicals Market, by Product Type, 2016 – 2026 (Kilo Tons)
      Table 30 Asia Pacific Agricultural Biologicals Market, by Crop Type, 2016 – 2026 (USD Million)
      Table 31 Asia Pacific Agricultural Biologicals Market, by Crop Type, 2016 – 2026 (Kilo Tons)
      Table 32 Asia Pacific Agricultural Biologicals Market, by Application, 2016 – 2026 (USD Million)
      Table 33 Asia Pacific Agricultural Biologicals Market, by Application, 2016 – 2026 (Kilo Tons)
      Table 34 Latin America Agricultural Biologicals Market, by Country, 2016 – 2026 (USD Million)
      Table 35 Latin America Agricultural Biologicals Market, by Country, 2016 – 2026 (Kilo Tons)
      Table 36 Latin America Agricultural Biologicals Market, by Product Type, 2016 – 2026 (USD Million)
      Table 37 Latin America Agricultural Biologicals Market, by Product Type, 2016 – 2026 (Kilo Tons)
      Table 38 Latin America Agricultural Biologicals Market, by Crop Type, 2016 – 2026 (USD Million)
      Table 39 Latin America Agricultural Biologicals Market, by Crop Type, 2016 – 2026 (Kilo Tons)
      Table 40 Latin America Agricultural Biologicals Market, by Application, 2016 – 2026 (USD Million)
      Table 41 Latin America Agricultural Biologicals Market, by Application, 2016 – 2026 (Kilo Tons)
      Table 42 The Middle-East and Africa Agricultural Biologicals Market, by Country, 2016 – 2026 (USD Million)
      Table 43 The Middle-East and Africa Agricultural Biologicals Market, by Country, 2016 – 2026 (Kilo Tons)
      Table 44 The Middle-East and Africa Agricultural Biologicals Market, by Product Type, 2016 – 2026 (USD Million)
      Table 45 The Middle-East and Africa Agricultural Biologicals Market, by Product Type, 2016 – 2026 (Kilo Tons)
      Table 46 The Middle-East and Africa Agricultural Biologicals Market, by Crop Type, 2016 – 2026 (USD Million)
      Table 47 The Middle-East and Africa Agricultural Biologicals Market, by Crop Type, 2016 – 2026 (Kilo Tons)
      Table 48 The Middle-East and Africa Agricultural Biologicals Market, by Application, 2016 – 2026 (USD Million)
      Table 49 The Middle-East and Africa Agricultural Biologicals Market, by Application, 2016 – 2026 (Kilo Tons)
      Table 50 North America Agricultural Biologicals Production, Consumption, Export, Import, 2016 – 2019
      Table 51 Europe Agricultural Biologicals Production, Consumption, Export, Import, 2016 – 2019
      Table 52 Asia Pacific Agricultural Biologicals Production, Consumption, Export, Import, 2016 – 2019
      Table 53 Latin America Agricultural Biologicals Production, Consumption, Export, Import, 2016 – 2019
      Table 54 The Middle-East and Africa Agricultural Biologicals Production, Consumption, Export, Import, 2016 – 2019
      Table 55 Global Agricultural Biologicals Market - Company Revenue Analysis, 2016 – 2019 (USD Million)
      Table 56 Global Agricultural Biologicals Market - Company Revenue Share Analysis, 2016 – 2019 (%)
      Table 57 Global Agricultural Biologicals Market - Company Volume Analysis, 2016 – 2019 (Kilo Tons)
      Table 58 Global Agricultural Biologicals Market - Company Volume Share Analysis, 2016 – 2019 (%)
      Table 59 Acquisitions and Mergers
      Table 60 Market Drivers – Impact Analysis
      Table 61 Market Restraints
      Table 62 Market Opportunities
      Table 63 Production Base and Market Concentration Rate of Raw Material
      Table 64 Key Suppliers of Raw Materials
      Table 65 Raw Materials Sources of Agricultural Biologicals Major Manufacturers
      Table 66 Major Buyers of Agricultural Biologicals
      Table 67 Distributors/Traders of Agricultural Biologicals by Region

Industry Major Market Players

  •  Isagro S.P.A.
  •  Bayer AG
  •  Marrone Bio Innovations
  •  Vegalab S.A.
  •  Valent Biosciences
  •  Biolchim S.P.A.
  •  Valagro
  •  Symborg
  •  Seipasa
  •  Biobest Group Nv
  •  Agrinos Inc.
  •  CBF China Bio-Fertilizer AG
  •  Mapleton Agri Biotec
  •  Symborg S.L.
  •  BASF SE
  •  Syngenta Crop Protection AG
  •  UPL
  •  Evogene Ltd
  •  Lallemand
  •  Stockton Bio-AG
  •  Rizobacter Argentina SA
  •  Koppert Biological Systems
  •  ermatt Biocontrol AG
  •  Verdesian Life Sciences LLC