Search Market Research Report

Discover Our Latest Reports
Discover Our Featured Reports
Discover Top Selling Reports

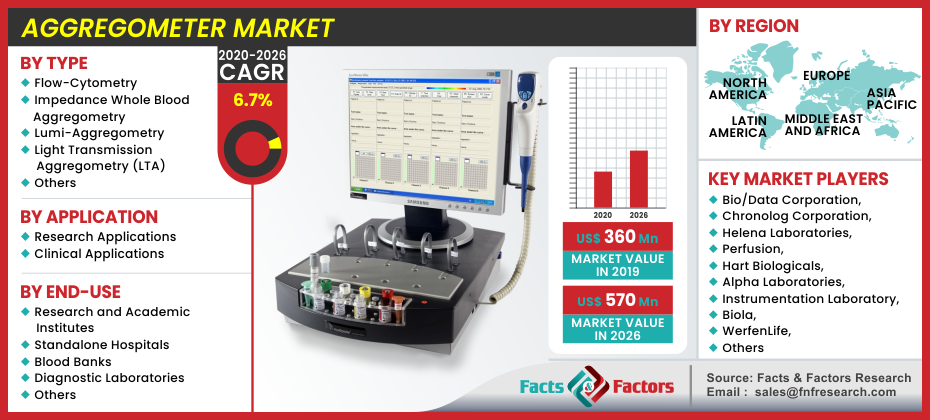
Aggregometer Market Size, Share Global Analysis Report, , 2020 – 2026

report img

Aggregometer Market By Type (Iimpedance Whole Blood Aggregometry, Light Transmission Aggregometry (LTA), Lumi-Aggregometry, Flow-Cytometry, and Others), By Application (Clinical Applications, and Research Applications), By End-Use (Standalone Hospitals, Diagnostic Laboratories, Research and Academic Institutes, Blood Banks, and Others): Global Industry Perspective, Comprehensive Analysis, and Forecast, 2020 – 2026

Industry Insights

[189+ Pages Report] The worldwide demand (consumption) for the Aggregometer market was estimated at about USD 360 Million in 2019 and is anticipated to register a revenue of around USD 570 Million by end of 2026, growing at a CAGR of around 6.7% between 2020 and 2026.

logoMarket Overview

The aggregometer, also known as a platelet aggregation method, is a device that has been used to determine the function of platelets since the twentieth century. Platelets play an important role in blood coagulation and wound healing, which is accomplished by a mechanism called platelet aggregation. Platelets are thought to play a part in thrombotic, vascular ischemic, and hemorrhagic disorders. As a result, anti-platelet therapy (APT) is considered the gold standard for many coronary disorders, prompting the creation of new anti-platelet medications as well as a variety of tests to assess platelet function. Platelets, also known as thrombocytes, are a type of cell found in our bodies that aid in the prevention of excessive bleeding caused by internal or external injuries. Platelets aid in blood coagulation, avoiding blood loss, and are thus one of the body's most essential cells. The platelet aggregometer is used to keep track of platelet function.

logoIndustry Growth Factors

The rising burden of chronic diseases, the growing geriatric population, and technological advances in platelet aggregometer are all contributing to the growth of the platelet aggregation devices industry. The platelet aggregometer market is expected to rise due to the rising prevalence of platelet dysfunctioning diseases. The platelet aggregometer market is expected to expand due to increased research around rare diseases such as Bernard-Soulier Disease (BSS) and Glanzmann Thrombasthenia (GT) around the world using the platelet aggregometer. While platelet aggregometry is a time-consuming method, the results obtained using a platelet aggregometer are more accurate and stable, and as a result, it is widely used for laboratory evaluation, which is expected to drive the platelet aggregometer market. It also aids in the evaluation of platelet function, i.e. aiding in the process of preventing bleeding, and minor variations in platelet function may have a negative impact on a person's health who is already suffering from an acute illness. The prevalence of platelet-related disorders is often high in chronic disease as well as in patients with dietary nutrition abnormalities, which leads to the evaluation of normal platelet function and count, which is necessary for normal function, which is expected to drive the platelet aggregometer market.

Aggregometer Market

To know more about this report | Request Free Sample Copy

The global burden of cardiac mortality is rising due to an increase in the occurrence of heart attacks such as stroke and coronary heart disease, which has fueled the growth of the platelet aggregation devices industry. Cardiovascular disease, for example, is identified as the underlying cause of death in the American Heart Association Research Report 2018, accounting for nearly 836,546 deaths in the United States. Platelet aggregation devices, which are used to diagnose bleeding disorders, are expected to see an increase in demand as the prevalence of bleeding disorders rises. Immune thrombocytopenia was projected to be 4 per 100,000 in children and 3 per 100,000 in adults worldwide in 2020, according to data presented by Genetic Home Reference.

logoSegmentation Analysis

The market for aggregometer is divided into three categories: form, application, and end-use. The market is classified into flow cytometry, impedance whole blood aggregometry, lumi-aggregometry, light transmission aggregometry (LTA), and others based on the product form. Among these, LTA is the gold standard method for determining platelet function. LTA is the most commonly used screening technique for excessive platelet activity and antiplatelet therapy management. The market is divided into analysis and clinical applications based on the application. Since the aggregometer has been the most widely used equipment in clinical laboratories as a strong analytical instrument for decades, the clinical applications segment is expected to hold the largest market share. It can be used to determine the inhibitory and excitatory effects of drugs on platelets, as well as to evaluate the effectiveness of antiplatelet therapy drugs in humans. It's also used in in vitro studies to evaluate platelet production in human samples before clinical trials. The total range of systems in an aggregometer is equal to the number of individual measurements that can be run at the same time. The total range of systems in an aggregometer is equal to the number of individual measurements that can be run at the same time.

logo Regional Analysis

Due to the higher number of procedures performed in the region, North America is expected to dominate the global platelet aggregometer market in terms of revenue. Due to the higher adoption of the platelet aggregometer in the area for various test evaluations, Europe is projected to be the second most lucrative market. The platelet aggregometer market in Latin America is expected to develop steadily over the forecast period, owing to the platelet aggregometer's growing adoption. With rapidly rising product penetration, Asia-Pacific is expected to be the fastest-growing market. Because of the low acceptance of the product and low test volume in the field, MEA is the least profitable platelet aggregometer sector.

logoReport Scope

Report Attribute

Details

Market Size in 2019

USD 360 Million

Projected Market Size in 2026

USD 570 Million

CAGR Growth Rate

6.7% CAGR

Base Year

2019

Forecast Years

2020-2026

Key Market Players

Bio/Data Corporation, Chronolog Corporation, Helena Laboratories, Perfusion, Hart Biologicals, Alpha Laboratories, Instrumentation Laboratory, Biola, WerfenLife, S.A.F. Hoffmann-La Roche Ltd, Siemens Healthineers AG, Tem Group, Sysmex Corporation, Haemonetics Corporation, Drucker Diagnostics, and Others. These key players in order to obtain a reputed position in the global market have implemented several strategies such as signing agreements, bonds, contracts, partnerships, joint ventures, new product launches, collaborations, and mergers & acquisitions.

Key Segment

By Type, By Application, By Application, By End-Use, By Region

Major Regions Covered

North America, Europe, Asia Pacific, Latin America, and the Middle East & Africa

Purchase Options

Request customized purchase options to meet your research needs. Explore purchase options

logo Competitive Players

The major players dominating the global aggregometer market in terms of revenue and development are:

  • Bio/Data Corporation
  • Chronolog Corporation
  • Helena Laboratories
  • Perfusion
  • Hart Biologicals
  • Alpha Laboratories
  • Instrumentation Laboratory
  • Biola
  • WerfenLife
  • S.A.F. Hoffmann-La Roche Ltd
  • Siemens Healthineers AG
  • Tem Group
  • Sysmex Corporation
  • Haemonetics Corporation
  • Drucker Diagnostics
  • and Others.

These key players in order to obtain a reputed position in the global market have implemented several strategies such as signing agreements, bonds, contracts, partnerships, joint ventures, new product launches, collaborations, and mergers & acquisitions.

logo COVID-19 Analysis

Due to the higher number of procedures performed in the region, North America is expected to dominate the global platelet aggregometer market in terms of revenue. Due to the higher adoption of the platelet aggregometer in the area for various test evaluations, Europe is projected to be the second most lucrative market. However, growing evidence of COVID 19's impact on platelet aggregation has led to an increase in research studies on the process.

logo By Type Segmentation Analysis:

  • Flow-Cytometry
  • Impedance Whole Blood Aggregometry
  • Lumi-Aggregometry
  • Light Transmission Aggregometry (LTA)
  • Others

logo By Application Segmentation Analysis

  • Research Applications
  • Clinical Applications

logo By End-Use Segmentation Analysis

  • Research and Academic Institutes
  • Standalone Hospitals
  • Blood Banks
  • Diagnostic Laboratories
  • Others

logo Regional Segment Analysis

  • North America
    • U.S.
    • Canada
  • Europe
    • U.K.
    • France
    • Germany
    • Rest of Europe
  • Asia Pacific
    • China
    • Japan
    • India
    • South Korea
    • Rest of Asia Pacific
  • Latin America
    • Brazil
    • Rest of Latin America
  • The Middle East and Africa
    • GCC Countries
    • South Africa
    • Rest of MEA

Table of Content

  1. Chapter 1 Executive Summary
    1. 1.1. Introduction of Aggregometer
    2. 1.2. Global Aggregometer Market, 2019 & 2026 (USD Million)
    3. 1.3. Global Aggregometer Market, 2016 – 2026 (USD Million) (Units)
    4. 1.4. Global Aggregometer Market Absolute Revenue Opportunity, 2016 – 2026 (USD Million)
    5. 1.5. Global Aggregometer Market Incremental Revenue Opportunity, 2020 – 2026 (USD Million)
  2. Chapter 2 Aggregometer Market – Type Analysis
    1. 2.1. Global Aggregometer Market – Type Overview
    2. 2.2. Global Aggregometer Market Share, by Type, 2019 & 2026 (USD Million)
    3. 2.3. Global Aggregometer Market share, by Type, 2019 & 2026 (Units)
    4. 2.4. Iimpedance Whole Blood Aggregometry
      1. 2.4.1. Global Iimpedance Whole Blood Aggregometry Aggregometer Market, 2016 – 2026 (USD Million)
      2. 2.4.2. Global Iimpedance Whole Blood Aggregometry Aggregometer Market, 2016 – 2026 (Units)
    5. 2.5. Light Transmission Aggregometry (LTA)
      1. 2.5.1. Global Light Transmission Aggregometry (LTA) Aggregometer Market, 2016 – 2026 (USD Million)
      2. 2.5.2. Global Light Transmission Aggregometry (LTA) Aggregometer Market, 2016 – 2026 (Units)
    6. 2.6. Lumi-Aggregometry
      1. 2.6.1. Global Lumi-Aggregometry Aggregometer Market, 2016 – 2026 (USD Million)
      2. 2.6.2. Global Lumi-Aggregometry Aggregometer Market, 2016 – 2026 (Units)
    7. 2.7. Flow-Cytometry
      1. 2.7.1. Global Flow-Cytometry Aggregometer Market, 2016 – 2026 (USD Million)
      2. 2.7.2. Global Flow-Cytometry Aggregometer Market, 2016 – 2026 (Units)
    8. 2.8. Others
      1. 2.8.1. Global Others Aggregometer Market, 2016 – 2026 (USD Million)
      2. 2.8.2. Global Others Aggregometer Market, 2016 – 2026 (Units)
  3. Chapter 3 Aggregometer Market – Application Analysis
    1. 3.1. Global Aggregometer Market – Application Overview
    2. 3.2. Global Aggregometer Market Share, by Application, 2019 & 2026 (USD Million)
    3. 3.3. Global Aggregometer Market share, by Application, 2019 & 2026 (Units)
    4. 3.4. Clinical Applications
      1. 3.4.1. Global Clinical Applications Aggregometer Market, 2016 – 2026 (USD Million)
      2. 3.4.2. Global Clinical Applications Aggregometer Market, 2016 – 2026 (Units)
    5. 3.5. Research Applications
      1. 3.5.1. Global Research Applications Aggregometer Market, 2016 – 2026 (USD Million)
      2. 3.5.2. Global Research Applications Aggregometer Market, 2016 – 2026 (Units)
  4. Chapter 4 Aggregometer Market – End-Use Analysis
    1. 4.1. Global Aggregometer Market – End-Use Overview
    2. 4.2. Global Aggregometer Market Share, by End-Use, 2019 & 2026 (USD Million)
    3. 4.3. Global Aggregometer Market share, by End-Use, 2019 & 2026 (Units)
    4. 4.4. Standalone Hospitals
      1. 4.4.1. Global Standalone Hospitals Aggregometer Market, 2016 – 2026 (USD Million)
      2. 4.4.2. Global Standalone Hospitals Aggregometer Market, 2016 – 2026 (Units)
    5. 4.5. Diagnostic Laboratories
      1. 4.5.1. Global Diagnostic Laboratories Aggregometer Market, 2016 – 2026 (USD Million)
      2. 4.5.2. Global Diagnostic Laboratories Aggregometer Market, 2016 – 2026 (Units)
    6. 4.6. Research and Academic Institutes
      1. 4.6.1. Global Research and Academic Institutes Aggregometer Market, 2016 – 2026 (USD Million)
      2. 4.6.2. Global Research and Academic Institutes Aggregometer Market, 2016 – 2026 (Units)
    7. 4.7. Blood Banks
      1. 4.7.1. Global Blood Banks Aggregometer Market, 2016 – 2026 (USD Million)
      2. 4.7.2. Global Blood Banks Aggregometer Market, 2016 – 2026 (Units)
    8. 4.8. Others
      1. 4.8.1. Global Others Aggregometer Market, 2016 – 2026 (USD Million)
      2. 4.8.2. Global Others Aggregometer Market, 2016 – 2026 (Units)
  5. Chapter 5 Aggregometer Market – Regional Analysis
    1. 5.1. Global Aggregometer Market Regional Overview
    2. 5.2. Global Aggregometer Market Share, by Region, 2019 & 2026 (USD Million)
    3. 5.3. Global Aggregometer Market Share, by Region, 2019 & 2026 (Units)
    4. 5.4. North America
      1. 5.4.1. North America Aggregometer Market, 2016 – 2026 (USD Million)
        1. 5.4.1.1. North America Aggregometer Market, by Country, 2016 – 2026 (USD Million)
      2. 5.4.2. North America Market, 2016 – 2026 (Units)
        1. 5.4.2.1. North America Aggregometer Market, by Country, 2016 – 2026 (Units)
      3. 5.4.3. North America Aggregometer Market, by Type, 2016 – 2026
        1. 5.4.3.1. North America Aggregometer Market, by Type, 2016 – 2026 (USD Million)
        2. 5.4.3.2. North America Aggregometer Market, by Type, 2016 – 2026 (Units)
      4. 5.4.4. North America Aggregometer Market, by Application, 2016 – 2026
        1. 5.4.4.1. North America Aggregometer Market, by Application, 2016 – 2026 (USD Million)
        2. 5.4.4.2. North America Aggregometer Market, by Application, 2016 – 2026 (Units)
      5. 5.4.5. North America Aggregometer Market, by End-Use, 2016 – 2026
        1. 5.4.5.1. North America Aggregometer Market, by End-Use, 2016 – 2026 (USD Million)
        2. 5.4.5.2. North America Aggregometer Market, by End-Use, 2016 – 2026 (Units)
      6. 5.4.6. U.S.
        1. 5.4.6.1. U.S. Aggregometer Market, 2016 – 2026 (USD Million)
        2. 5.4.6.2. U.S. Aggregometer Market, 2016 – 2026 (Units)
      7. 5.4.7. Canada
        1. 5.4.7.1. Canada Aggregometer Market, 2016 – 2026 (USD Million)
        2. 5.4.7.2. Canada Aggregometer Market, 2016 – 2026 (Units)
    5. 5.5. Europe
      1. 5.5.1. Europe Aggregometer Market, 2016 – 2026 (USD Million)
        1. 5.5.1.1. Europe Aggregometer Market, by Country, 2016 – 2026 (USD Million)
      2. 5.5.2. Europe Market, 2016 – 2026 (Units)
        1. 5.5.2.1. Europe Aggregometer Market, by Country, 2016 – 2026 (Units)
      3. 5.5.3. Europe Aggregometer Market, by Type, 2016 – 2026
        1. 5.5.3.1. Europe Aggregometer Market, by Type, 2016 – 2026 (USD Million)
        2. 5.5.3.2. Europe Aggregometer Market, by Type, 2016 – 2026 (Units)
      4. 5.5.4. Europe Aggregometer Market, by Application, 2016 – 2026
        1. 5.5.4.1. Europe Aggregometer Market, by Application, 2016 – 2026 (USD Million)
        2. 5.5.4.2. Europe Aggregometer Market, by Application, 2016 – 2026 (Units)
      5. 5.5.5. Europe Aggregometer Market, by End-Use, 2016 – 2026
        1. 5.5.5.1. Europe Aggregometer Market, by End-Use, 2016 – 2026 (USD Million)
        2. 5.5.5.2. Europe Aggregometer Market, by End-Use, 2016 – 2026 (Units)
      6. 5.5.6. Germany
        1. 5.5.6.1. Germany Aggregometer Market, 2016 – 2026 (USD Million)
        2. 5.5.6.2. Germany Aggregometer Market, 2016 – 2026 (Units)
      7. 5.5.7. France
        1. 5.5.7.1. France Aggregometer Market, 2016 – 2026 (USD Million)
        2. 5.5.7.2. France Aggregometer Market, 2016 – 2026 (Units)
      8. 5.5.8. U.K.
        1. 5.5.8.1. U.K. Aggregometer Market, 2016 – 2026 (USD Million)
        2. 5.5.8.2. U.K. Aggregometer Market, 2016 – 2026 (Units)
      9. 5.5.9. Italy
        1. 5.5.9.1. Italy Aggregometer Market, 2016 – 2026 (USD Million)
        2. 5.5.9.2. Italy Aggregometer Market, 2016 – 2026 (Units)
      10. 5.5.10. Spain
        1. 5.5.10.1. Spain Aggregometer Market, 2016 – 2026 (USD Million)
        2. 5.5.10.2. Spain Aggregometer Market, 2016 – 2026 (Units)
      11. 5.5.11. Rest of Europe
        1. 5.5.11.1. Rest of Europe Aggregometer Market, 2016 – 2026 (USD Million)
        2. 5.5.11.2. Rest of Europe Aggregometer Market, 2016 – 2026 (Units)
    6. 5.6. Asia Pacific
      1. 5.6.1. Asia Pacific Aggregometer Market, 2016 – 2026 (USD Million)
        1. 5.6.1.1. Asia Pacific Aggregometer Market, by Country, 2016 – 2026 (USD Million)
      2. 5.6.2. Asia Pacific Market, 2016 – 2026 (Units)
        1. 5.6.2.1. Asia Pacific Aggregometer Market, by Country, 2016 – 2026 (Units)
      3. 5.6.3. Asia Pacific Aggregometer Market, by Type, 2016 – 2026
        1. 5.6.3.1. Asia Pacific Aggregometer Market, by Type, 2016 – 2026 (USD Million)
        2. 5.6.3.2. Asia Pacific Aggregometer Market, by Type, 2016 – 2026 (Units)
      4. 5.6.4. Asia Pacific Aggregometer Market, by Application, 2016 – 2026
        1. 5.6.4.1. Asia Pacific Aggregometer Market, by Application, 2016 – 2026 (USD Million)
        2. 5.6.4.2. Asia Pacific Aggregometer Market, by Application, 2016 – 2026 (Units)
      5. 5.6.5. Asia Pacific Aggregometer Market, by End-Use, 2016 – 2026
        1. 5.6.5.1. Asia Pacific Aggregometer Market, by End-Use, 2016 – 2026 (USD Million)
        2. 5.6.5.2. Asia Pacific Aggregometer Market, by End-Use, 2016 – 2026 (Units)
      6. 5.6.6. China
        1. 5.6.6.1. China Aggregometer Market, 2016 – 2026 (USD Million)
        2. 5.6.6.2. China Aggregometer Market, 2016 – 2026 (Units)
      7. 5.6.7. Japan
        1. 5.6.7.1. Japan Aggregometer Market, 2016 – 2026 (USD Million)
        2. 5.6.7.2. Japan Aggregometer Market, 2016 – 2026 (Units)
      8. 5.6.8. India
        1. 5.6.8.1. India Aggregometer Market, 2016 – 2026 (USD Million)
        2. 5.6.8.2. India Aggregometer Market, 2016 – 2026 (Units)
      9. 5.6.9. South Korea
        1. 5.6.9.1. South Korea Aggregometer Market, 2016 – 2026 (USD Million)
        2. 5.6.9.2. South Korea Aggregometer Market, 2016 – 2026 (Units)
      10. 5.6.10. South-East Asia
        1. 5.6.10.1. South-East Asia Aggregometer Market, 2016 – 2026 (USD Million)
        2. 5.6.10.2. South-East Asia Aggregometer Market, 2016 – 2026 (Units)
      11. 5.6.11. Rest of Asia Pacific
        1. 5.6.11.1. Rest of Asia Pacific Aggregometer Market, 2016 – 2026 (USD Million)
        2. 5.6.11.2. Rest of Asia Pacific Aggregometer Market, 2016 – 2026 (Units)
    7. 5.7. Latin America
      1. 5.7.1. Latin America Aggregometer Market, 2016 – 2026 (USD Million)
        1. 5.7.1.1. Latin America Aggregometer Market, by Country, 2016 – 2026 (USD Million)
      2. 5.7.2. Latin America Market, 2016 – 2026 (Units)
        1. 5.7.2.1. Latin America Aggregometer Market, by Country, 2016 – 2026 (Units)
      3. 5.7.3. Latin America Aggregometer Market, by Type, 2016 – 2026
        1. 5.7.3.1. Latin America Aggregometer Market, by Type, 2016 – 2026 (USD Million)
        2. 5.7.3.2. Latin America Aggregometer Market, by Type, 2016 – 2026 (Units)
      4. 5.7.4. Latin America Aggregometer Market, by Application, 2016 – 2026
        1. 5.7.4.1. Latin America Aggregometer Market, by Application, 2016 – 2026 (USD Million)
        2. 5.7.4.2. Latin America Aggregometer Market, by Application, 2016 – 2026 (Units)
      5. 5.7.5. Latin America Aggregometer Market, by End-Use, 2016 – 2026
        1. 5.7.5.1. Latin America Aggregometer Market, by End-Use, 2016 – 2026 (USD Million)
        2. 5.7.5.2. Latin America Aggregometer Market, by End-Use, 2016 – 2026 (Units)
      6. 5.7.6. Brazil
        1. 5.7.6.1. Brazil Aggregometer Market, 2016 – 2026 (USD Million)
        2. 5.7.6.2. Brazil Aggregometer Market, 2016 – 2026 (Units)
      7. 5.7.7. Mexico
        1. 5.7.7.1. Mexico Aggregometer Market, 2016 – 2026 (USD Million)
        2. 5.7.7.2. Mexico Aggregometer Market, 2016 – 2026 (Units)
      8. 5.7.8. Rest of Latin America
        1. 5.7.8.1. Rest of Latin America Aggregometer Market, 2016 – 2026 (USD Million)
        2. 5.7.8.2. Rest of Latin America Aggregometer Market, 2016 – 2026 (Units)
    8. 5.8. The Middle-East and Africa
      1. 5.8.1. The Middle-East and Africa Aggregometer Market, 2016 – 2026 (USD Million)
        1. 5.8.1.1. The Middle-East and Africa Aggregometer Market, by Country, 2016 – 2026 (USD Million)
      2. 5.8.2. The Middle-East and Africa Market, 2016 – 2026 (Units)
        1. 5.8.2.1. The Middle-East and Africa Aggregometer Market, by Country, 2016 – 2026 (Units)
      3. 5.8.3. The Middle-East and Africa Aggregometer Market, by Type, 2016 – 2026
        1. 5.8.3.1. The Middle-East and Africa Aggregometer Market, by Type, 2016 – 2026 (USD Million)
        2. 5.8.3.2. The Middle-East and Africa Aggregometer Market, by Type, 2016 – 2026 (Units)
      4. 5.8.4. The Middle-East and Africa Aggregometer Market, by Application, 2016 – 2026
        1. 5.8.4.1. The Middle-East and Africa Aggregometer Market, by Application, 2016 – 2026 (USD Million)
        2. 5.8.4.2. The Middle-East and Africa Aggregometer Market, by Application, 2016 – 2026 (Units)
      5. 5.8.5. The Middle-East and Africa Aggregometer Market, by End-Use, 2016 – 2026
        1. 5.8.5.1. The Middle-East and Africa Aggregometer Market, by End-Use, 2016 – 2026 (USD Million)
        2. 5.8.5.2. The Middle-East and Africa Aggregometer Market, by End-Use, 2016 – 2026 (Units)
      6. 5.8.6. GCC Countries
        1. 5.8.6.1. GCC Countries Aggregometer Market, 2016 – 2026 (USD Million)
        2. 5.8.6.2. GCC Countries Aggregometer Market, 2016 – 2026 (Units)
      7. 5.8.7. South Africa
        1. 5.8.7.1. South Africa Aggregometer Market, 2016 – 2026 (USD Million)
        2. 5.8.7.2. South Africa Aggregometer Market, 2016 – 2026 (Units)
      8. 5.8.8. Rest of Middle-East Africa
        1. 5.8.8.1. Rest of Middle-East Africa Aggregometer Market, 2016 – 2026 (USD Million)
        2. 5.8.8.2. Rest of Middle-East Africa Aggregometer Market, 2016 – 2026 (Units)
  6. Chapter 6 Aggregometer Production, Consumption, Export, Import by Regions
    1. 6.1. Global Aggregometer Production and Consumption, 2016 – 2026 (Units)
    2. 6.2. Global Import and Export Analysis, by Region
  7. Chapter 7 Aggregometer Market – Competitive Landscape
    1. 7.1. Competitor Market Share – Revenue
    2. 7.2. Market Concentration Rate Analysis, Top 3 and Top 5 Players
    3. 7.3. Competitor Market Share – Volume
    4. 7.4. Strategic Developments
      1. 7.4.1. Acquisitions and Mergers
      2. 7.4.2. New Products
      3. 7.4.3. Research & Development Activities
  8. Chapter 8 Company Profiles
    1. 8.1. Bio/Data Corporation
      1. 8.1.1. Company Overview
      2. 8.1.2. Product/Service Portfolio
      3. 8.1.3. Bio/Data Corporation Sales, Revenue, Price, and Gross Margin
      4. 8.1.4. Bio/Data Corporation Revenue and Growth Rate
      5. 8.1.5. Bio/Data Corporation Market Share
      6. 8.1.6. Recent Initiatives, Funding/VC Activities, and Technological Innovations
    2. 8.2. Chronolog Corporation
      1. 8.2.1. Company Overview
      2. 8.2.2. Product/Service Portfolio
      3. 8.2.3. Chronolog Corporation Sales, Revenue, Price, and Gross Margin
      4. 8.2.4. Chronolog Corporation Revenue and Growth Rate
      5. 8.2.5. Chronolog Corporation Market Share
      6. 8.2.6. Recent Initiatives, Funding/VC Activities, and Technological Innovations
    3. 8.3. Helena Laboratories
      1. 8.3.1. Company Overview
      2. 8.3.2. Product/Service Portfolio
      3. 8.3.3. Helena Laboratories Sales, Revenue, Price, and Gross Margin
      4. 8.3.4. Helena Laboratories Revenue and Growth Rate
      5. 8.3.5. Helena Laboratories Market Share
      6. 8.3.6. Recent Initiatives, Funding/VC Activities, and Technological Innovations
    4. 8.4. Perfusion
      1. 8.4.1. Company Overview
      2. 8.4.2. Product/Service Portfolio
      3. 8.4.3. Perfusion Sales, Revenue, Price, and Gross Margin
      4. 8.4.4. Perfusion Revenue and Growth Rate
      5. 8.4.5. Perfusion Market Share
      6. 8.4.6. Recent Initiatives, Funding/VC Activities, and Technological Innovations
    5. 8.5. Hart Biologicals
      1. 8.5.1. Company Overview
      2. 8.5.2. Product/Service Portfolio
      3. 8.5.3. Hart Biologicals Sales, Revenue, Price, and Gross Margin
      4. 8.5.4. Hart Biologicals Revenue and Growth Rate
      5. 8.5.5. Hart Biologicals Market Share
      6. 8.5.6. Recent Initiatives, Funding/VC Activities, and Technological Innovations
    6. 8.6. Alpha Laboratories
      1. 8.6.1. Company Overview
      2. 8.6.2. Product/Service Portfolio
      3. 8.6.3. Alpha Laboratories Sales, Revenue, Price, and Gross Margin
      4. 8.6.4. Alpha Laboratories Revenue and Growth Rate
      5. 8.6.5. Alpha Laboratories Market Share
      6. 8.6.6. Recent Initiatives, Funding/VC Activities, and Technological Innovations
    7. 8.7. Instrumentation Laboratory
      1. 8.7.1. Company Overview
      2. 8.7.2. Product/Service Portfolio
      3. 8.7.3. Instrumentation Laboratory Sales, Revenue, Price, and Gross Margin
      4. 8.7.4. Instrumentation Laboratory Revenue and Growth Rate
      5. 8.7.5. Instrumentation Laboratory Market Share
      6. 8.7.6. Recent Initiatives, Funding/VC Activities, and Technological Innovations
    8. 8.8. Biola
      1. 8.8.1. Company Overview
      2. 8.8.2. Product/Service Portfolio
      3. 8.8.3. Biola Sales, Revenue, Price, and Gross Margin
      4. 8.8.4. Biola Revenue and Growth Rate
      5. 8.8.5. Biola Market Share
      6. 8.8.6. Recent Initiatives, Funding/VC Activities, and Technological Innovations
    9. 8.9. WerfenLife, S.A.
      1. 8.9.1. Company Overview
      2. 8.9.2. Product/Service Portfolio
      3. 8.9.3. WerfenLife, S.A. Sales, Revenue, Price, and Gross Margin
      4. 8.9.4. WerfenLife, S.A. Revenue and Growth Rate
      5. 8.9.5. WerfenLife, S.A. Market Share
      6. 8.9.6. Recent Initiatives, Funding/VC Activities, and Technological Innovations
      7. 8.10. F. Hoffmann-La Roche Ltd
      8. 8.10.1. Company Overview
      9. 8.10.2. Product/Service Portfolio
        1. 8.10.3. F. Hoffmann-La Roche Ltd Sales, Revenue, Price, and Gross Margin
        2. 8.10.4. F. Hoffmann-La Roche Ltd Revenue and Growth Rate
        3. 8.10.5. F. Hoffmann-La Roche Ltd Market Share
      10. 8.10.6. Recent Initiatives, Funding/VC Activities, and Technological Innovations
    10. 8.11. Siemens Healthineers AG
      1. 8.11.1. Company Overview
      2. 8.11.2. Product/Service Portfolio
      3. 8.11.3. Siemens Healthineers AG Sales, Revenue, Price, and Gross Margin
      4. 8.11.4. Siemens Healthineers AG Revenue and Growth Rate
      5. 8.11.5. Siemens Healthineers AG Market Share
      6. 8.11.6. Recent Initiatives, Funding/VC Activities, and Technological Innovations
    11. 8.12. Tem Group
      1. 8.12.1. Company Overview
      2. 8.12.2. Product/Service Portfolio
      3. 8.12.3. Tem Group Sales, Revenue, Price, and Gross Margin
      4. 8.12.4. Tem Group Revenue and Growth Rate
      5. 8.12.5. Tem Group Market Share
      6. 8.12.6. Recent Initiatives, Funding/VC Activities, and Technological Innovations
    12. 8.13. Sysmex Corporation
      1. 8.13.1. Company Overview
      2. 8.13.2. Product/Service Portfolio
      3. 8.13.3. Sysmex Corporation Sales, Revenue, Price, and Gross Margin
      4. 8.13.4. Sysmex Corporation Revenue and Growth Rate
      5. 8.13.5. Sysmex Corporation Market Share
      6. 8.13.6. Recent Initiatives, Funding/VC Activities, and Technological Innovations
    13. 8.14. Haemonetics Corporation
      1. 8.14.1. Company Overview
      2. 8.14.2. Product/Service Portfolio
      3. 8.14.3. Haemonetics Corporation Sales, Revenue, Price, and Gross Margin
      4. 8.14.4. Haemonetics Corporation Revenue and Growth Rate
      5. 8.14.5. Haemonetics Corporation Market Share
      6. 8.14.6. Recent Initiatives, Funding/VC Activities, and Technological Innovations
    14. 8.15. Drucker Diagnostics
      1. 8.15.1. Company Overview
      2. 8.15.2. Product/Service Portfolio
      3. 8.15.3. Drucker Diagnostics Sales, Revenue, Price, and Gross Margin
      4. 8.15.4. Drucker Diagnostics Revenue and Growth Rate
      5. 8.15.5. Drucker Diagnostics Market Share
      6. 8.15.6. Recent Initiatives, Funding/VC Activities, and Technological Innovations
    15. 8.16. Others
      1. 8.16.1. Company Overview
      2. 8.16.2. Product/Service Portfolio
      3. 8.16.3. Others Sales, Revenue, Price, and Gross Margin
      4. 8.16.4. Others Revenue and Growth Rate
      5. 8.16.5. Others Market Share
      6. 8.16.6. Recent Initiatives, Funding/VC Activities, and Technological Innovations
  9. Chapter 9 Aggregometer — Industry Analysis
    1. 9.1. Introduction and Taxonomy
    2. 9.2. Aggregometer Market – Key Trends
      1. 9.2.1. Market Drivers
      2. 9.2.2. Market Restraints
      3. 9.2.3. Market Opportunities
    3. 9.3. Value Chain Analysis
    4. 9.4. Key Mandates and Regulations
    5. 9.5. Technology Roadmap and Timeline
    6. 9.6. Aggregometer Market – Attractiveness Analysis
      1. 9.6.1. By Type
      2. 9.6.2. By Application
      3. 9.6.3. By End-Use
      4. 9.6.4. By Region
  10. Chapter 10 Raw Material Analysis
    1. 10.1. Aggregometer Key Raw Material Analysis
      1. 10.1.1. Key Raw Materials
      2. 10.1.2. Price Trend of Key Raw Materials
    2. 10.2. Key Suppliers of Raw Materials
    3. 10.3. Proportion of Manufacturing Cost Structure
      1. 10.3.1. Raw Materials Cost
      2. 10.3.2. Labor Cost
      3. 10.3.3. Manufacturing Expenses
      4. 10.3.4. Miscellaneous Expenses
    4. 10.4. Manufacturing Cost Analysis of Aggregometer
  11. Chapter 11 Industrial Chain, Sourcing Strategy, and Downstream Buyers
    1. 11.1. Aggregometer Industrial Chain Analysis
    2. 11.2. Upstream Raw Materials Sourcing
      1. 11.2.1. Risk Mitigation:
      2. 11.2.2. Supplier Relationships:
      3. 11.2.3. Business Processes:
      4. 11.2.4. Securing the Product:
    3. 11.3. Raw Materials Sources of Aggregometer Major Manufacturers
    4. 11.4. Downstream Buyers
    5. 11.5. Distributors/Traders List
  12. Chapter 12 Marketing Strategy Analysis, Distributors
    1. 12.1. Marketing Channel
    2. 12.2. Direct Marketing
    3. 12.3. Indirect Marketing
    4. 12.4. Marketing Channel Development Trends
    5. 12.5. Economic/Political Environmental Change
  13. Chapter 13 Report Conclusion & Key Insights
    1. 13.1. Key Insights from Primary Interviews & Surveys Respondents
    2. 13.2. Key Takeaways from Analysts, Consultants, and Industry Leaders
  14. Chapter 14 Research Approach & Methodology
    1. 14.1. Report Description
    2. 14.2. Research Scope
    3. 14.3. Research Methodology
      1. 14.3.1. Secondary Research
      2. 14.3.2. Primary Research
      3. 14.3.3. Statistical Models
        1. 14.3.3.1. Company Share Analysis Model
        2. 14.3.3.2. Revenue Based Modeling
      4. 14.3.4. Research Limitations

      List of Figures

      Fig.1	Product Picture of Aggregometer
      Fig.2	Global Aggregometer Market, 2016 – 2026 (USD Million)
      Fig.3	Global Aggregometer Market, 2016 – 2026 (Units)
      Fig.4	Global Aggregometer Market Absolute Revenue Opportunity, 2016 – 2026 (USD Million)
      Fig.5	Global Aggregometer Market Incremental Revenue Opportunity, 2020 – 2026 (USD Million)
      Fig.6	Global Aggregometer Market Share, by Type, 2019 & 2026 (USD Million)
      Fig.7	Global Aggregometer Market Share, by Type, 2019 & 2026 (Units)
      Fig.8	Global Iimpedance Whole Blood Aggregometry Aggregometer Market, 2016 – 2026 (USD Million)
      Fig.9	Global Iimpedance Whole Blood Aggregometry Aggregometer Market, 2016 – 2026 (Units)
      Fig.10	Global Light Transmission Aggregometry (LTA) Aggregometer Market, 2016 – 2026 (USD Million)
      Fig.11	Global Light Transmission Aggregometry (LTA) Aggregometer Market, 2016 – 2026 (Units)
      Fig.12	Global Lumi-Aggregometry Aggregometer Market, 2016 – 2026 (USD Million)
      Fig.13	Global Lumi-Aggregometry Aggregometer Market, 2016 – 2026 (Units)
      Fig.14	Global Flow-Cytometry Aggregometer Market, 2016 – 2026 (USD Million)
      Fig.15	Global Flow-Cytometry Aggregometer Market, 2016 – 2026 (Units)
      Fig.16	Global Others Aggregometer Market, 2016 – 2026 (USD Million)
      Fig.17	Global Others Aggregometer Market, 2016 – 2026 (Units)
      Fig.18	Global Aggregometer Market Share, by Application, 2019 & 2026 (USD Million)
      Fig.19	Global Aggregometer Market Share, by Application, 2019 & 2026 (Units)
      Fig.20	Global Clinical Applications Aggregometer Market, 2016 – 2026 (USD Million)
      Fig.21	Global Clinical Applications Aggregometer Market, 2016 – 2026 (Units)
      Fig.22	Global Research Applications Aggregometer Market, 2016 – 2026 (USD Million)
      Fig.23	Global Research Applications Aggregometer Market, 2016 – 2026 (Units)
      Fig.24	Global Aggregometer Market Share, by End-Use, 2019 & 2026 (USD Million)
      Fig.25	Global Aggregometer Market Share, by End-Use, 2019 & 2026 (Units)
      Fig.26	Global  Standalone Hospitals Aggregometer Market, 2016 – 2026 (USD Million)
      Fig.27	Global  Standalone Hospitals Aggregometer Market, 2016 – 2026 (Units)
      Fig.28	Global Diagnostic Laboratories Aggregometer Market, 2016 – 2026 (USD Million)
      Fig.29	Global Diagnostic Laboratories Aggregometer Market, 2016 – 2026 (Units)
      Fig.30	Global Research and Academic Institutes Aggregometer Market, 2016 – 2026 (USD Million)
      Fig.31	Global Research and Academic Institutes Aggregometer Market, 2016 – 2026 (Units)
      Fig.32	Global Blood Banks Aggregometer Market, 2016 – 2026 (USD Million)
      Fig.33	Global Blood Banks Aggregometer Market, 2016 – 2026 (Units)
      Fig.34	Global Others Aggregometer Market, 2016 – 2026 (USD Million)
      Fig.35	Global Others Aggregometer Market, 2016 – 2026 (Units)
      Fig.36	Global Aggregometer Market Share, by Region, 2019 & 2026 (USD Million)
      Fig.37	Global Aggregometer Market Share, by Region, 2019 & 2026 (Units)
      Fig.38	North America Aggregometer Market, 2016 – 2026 (USD Million)
      Fig.39	North America Aggregometer Market, 2016 – 2026 (Units)
      Fig.40	U.S. Aggregometer Market, 2016 – 2026 (USD Million)
      Fig.41	U.S. Aggregometer  Market, 2016 – 2026 (Units)
      Fig.42	Canada Aggregometer Market, 2016 – 2026 (USD Million)
      Fig.43	Canada Aggregometer  Market, 2016 – 2026 (Units)
      Fig.44	Europe Aggregometer Market, 2016 – 2026 (USD Million)
      Fig.45	Europe Aggregometer Market, 2016 – 2026 (Units)
      Fig.46	Germany Aggregometer Market, 2016 – 2026 (USD Million)
      Fig.47	Germany Aggregometer  Market, 2016 – 2026 (Units)
      Fig.48	France Aggregometer Market, 2016 – 2026 (USD Million)
      Fig.49	France Aggregometer  Market, 2016 – 2026 (Units)
      Fig.50	U.K. Aggregometer Market, 2016 – 2026 (USD Million)
      Fig.51	U.K. Aggregometer  Market, 2016 – 2026 (Units)
      Fig.52	Italy Aggregometer Market, 2016 – 2026 (USD Million)
      Fig.53	Italy Aggregometer  Market, 2016 – 2026 (Units)
      Fig.54	Spain Aggregometer Market, 2016 – 2026 (USD Million)
      Fig.55	Spain Aggregometer  Market, 2016 – 2026 (Units)
      Fig.56	Rest of Europe Aggregometer Market, 2016 – 2026 (USD Million)
      Fig.57	Rest of Europe Aggregometer  Market, 2016 – 2026 (Units)
      Fig.58	Asia Pacific Aggregometer Market, 2016 – 2026 (USD Million)
      Fig.59	Asia Pacific Aggregometer Market, 2016 – 2026 (Units)
      Fig.60	China Aggregometer Market, 2016 – 2026 (USD Million)
      Fig.61	China Aggregometer  Market, 2016 – 2026 (Units)
      Fig.62	Japan Aggregometer Market, 2016 – 2026 (USD Million)
      Fig.63	Japan Aggregometer  Market, 2016 – 2026 (Units)
      Fig.64	India Aggregometer Market, 2016 – 2026 (USD Million)
      Fig.65	India Aggregometer  Market, 2016 – 2026 (Units)
      Fig.66	South  Korea Aggregometer Market, 2016 – 2026 (USD Million)
      Fig.67	South  Korea Aggregometer  Market, 2016 – 2026 (Units)
      Fig.68	South-East Asia Aggregometer Market, 2016 – 2026 (USD Million)
      Fig.69	South-East Asia Aggregometer  Market, 2016 – 2026 (Units)
      Fig.70	Rest of Asia Pacific Aggregometer Market, 2016 – 2026 (USD Million)
      Fig.71	Rest of Asia Pacific Aggregometer  Market, 2016 – 2026 (Units)
      Fig.72	Latin America Aggregometer Market, 2016 – 2026 (USD Million)
      Fig.73	Latin America Aggregometer Market, 2016 – 2026 (Units)
      Fig.74	Brazil Aggregometer Market, 2016 – 2026 (USD Million)
      Fig.75	Brazil Aggregometer  Market, 2016 – 2026 (Units)
      Fig.76	Mexico Aggregometer Market, 2016 – 2026 (USD Million)
      Fig.77	Mexico Aggregometer  Market, 2016 – 2026 (Units)
      Fig.78	Rest of Latin America Aggregometer Market, 2016 – 2026 (USD Million)
      Fig.79	Rest of Latin America Aggregometer  Market, 2016 – 2026 (Units)
      Fig.80	The Middle-East and Africa Aggregometer Market, 2016 – 2026 (USD Million)
      Fig.81	The Middle-East and Africa Aggregometer Market, 2016 – 2026 (Units)
      Fig.82	GCC Countries Aggregometer Market, 2016 – 2026 (USD Million)
      Fig.83	GCC Countries Aggregometer  Market, 2016 – 2026 (Units)
      Fig.84	South Africa Aggregometer Market, 2016 – 2026 (USD Million)
      Fig.85	South Africa Aggregometer  Market, 2016 – 2026 (Units)
      Fig.86	Rest of Middle-East Africa Aggregometer Market, 2016 – 2026 (USD Million)
      Fig.87	Rest of Middle-East Africa Aggregometer  Market, 2016 – 2026 (Units)
      Fig.88	Global Aggregometer Production and Consumption, 2016 – 2026 (Units)
      Fig.89	North America Aggregometer Production and Consumption, 2016 – 2026 (USD Million) (Units)
      Fig.90	Europe Aggregometer Production and Consumption, 2016 – 2026 (USD Million) (Units)
      Fig.91	Asia Pacific Aggregometer Production and Consumption, 2016 – 2026 (USD Million) (Units)
      Fig.92	Latin America Aggregometer Production and Consumption, 2016 – 2026 (USD Million) (Units)
      Fig.93	The Middle-East and Africa Aggregometer Production and Consumption, 2016 – 2026 (USD Million) (Units)
      Fig.94	Competitor Market Share – Revenue
      Fig.95	Competitor Market Share – Volume
      Fig.96	Bio/Data Corporation Revenue and Growth Rate
      Fig.97	Bio/Data Corporation Market Share
      Fig.98	Chronolog Corporation Revenue and Growth Rate
      Fig.99	Chronolog Corporation Market Share
      Fig.100	Helena Laboratories Revenue and Growth Rate
      Fig.101	Helena Laboratories Market Share
      Fig.102	Perfusion Revenue and Growth Rate
      Fig.103	Perfusion Market Share
      Fig.104	Hart Biologicals Revenue and Growth Rate
      Fig.105	Hart Biologicals Market Share
      Fig.106	Alpha Laboratories Revenue and Growth Rate
      Fig.107	Alpha Laboratories Market Share
      Fig.108	Instrumentation Laboratory Revenue and Growth Rate
      Fig.109	Instrumentation Laboratory Market Share
      Fig.110	Biola Revenue and Growth Rate
      Fig.111	Biola Market Share
      Fig.112	WerfenLife, S.A. Revenue and Growth Rate
      Fig.113	WerfenLife, S.A. Market Share
      Fig.114	F. Hoffmann-La Roche Ltd Revenue and Growth Rate
      Fig.115	F. Hoffmann-La Roche Ltd Market Share
      Fig.116	Siemens Healthineers AG Revenue and Growth Rate
      Fig.117	Siemens Healthineers AG Market Share
      Fig.118	Tem Group Revenue and Growth Rate
      Fig.119	Tem Group Market Share
      Fig.120	Sysmex Corporation Revenue and Growth Rate
      Fig.121	Sysmex Corporation Market Share
      Fig.122	Haemonetics Corporation Revenue and Growth Rate
      Fig.123	Haemonetics Corporation Market Share
      Fig.124	Drucker Diagnostics Revenue and Growth Rate
      Fig.125	Drucker Diagnostics Market Share
      Fig.126	Others Revenue and Growth Rate
      Fig.127	Others Market Share
      Fig.128	Market Dynamics
      Fig.129	Global Aggregometer – Value Chain Analysis
      Fig.130	Key Mandates and Regulations
      Fig.131	Technology Roadmap and Timeline
      Fig.132	Market Attractiveness Analysis – By Type
      Fig.133	Market Attractiveness Analysis – By Application
      Fig.134	Market Attractiveness Analysis – By End-Use
      Fig.135	Market Attractiveness Analysis – By Region
      Fig.136	Manufacturing Cost Structure of Aggregometer
      Fig.137	Aggregometer Industrial Chain Analysis
      Fig.138	Market Channels
      Fig.139	Marketing Channel Development Trend
      Fig.140	Growth in World Gross Product, 2008-2018
      

      List of Tables

      Table 1	Global Aggregometer Market, 2019 & 2026 (USD Million)
      Table 2	Global Aggregometer Market, by Type, 2016 – 2026 (USD Million)
      Table 3	Global Aggregometer Market, by Type, 2016 – 2026 (Units)
      Table 4	Global Aggregometer Market, by Application, 2016 – 2026 (USD Million)
      Table 5	Global Aggregometer Market, by Application, 2016 – 2026 (Units)
      Table 6	Global Aggregometer Market, by End-Use, 2016 – 2026 (USD Million)
      Table 7	Global Aggregometer Market, by End-Use, 2016 – 2026 (Units)
      Table 8	Global Aggregometer Market, by Region, 2016 – 2026 (USD Million)
      Table 9 Global Aggregometer Market, by Region, 2016 – 2026 (Units)
      Table 10 North America Aggregometer Market, by Country, 2016 – 2026 (USD Million)
      Table 11 North America Aggregometer Market, by Country, 2016 – 2026 (Units)
      Table 12 North America Aggregometer Market, by Type, 2016 – 2026 (USD Million)
      Table 13 North America Aggregometer Market, by Type, 2016 – 2026 (Units)
      Table 14 North America Aggregometer Market, by Application, 2016 – 2026 (USD Million)
      Table 15 North America Aggregometer Market, by Application, 2016 – 2026 (Units)
      Table 16 North America Aggregometer Market, by End-Use, 2016 – 2026 (USD Million)
      Table 17 North America Aggregometer Market, by End-Use, 2016 – 2026 (Units)
      Table 18 Europe Aggregometer Market, by Country, 2016 – 2026 (USD Million)
      Table 19 Europe Aggregometer Market, by Country, 2016 – 2026 (Units)
      Table 20 Europe Aggregometer Market, by Type, 2016 – 2026 (USD Million)
      Table 21 Europe Aggregometer Market, by Type, 2016 – 2026 (Units)
      Table 22 Europe Aggregometer Market, by Application, 2016 – 2026 (USD Million)
      Table 23 Europe Aggregometer Market, by Application, 2016 – 2026 (Units)
      Table 24 Europe Aggregometer Market, by End-Use, 2016 – 2026 (USD Million)
      Table 25 Europe Aggregometer Market, by End-Use, 2016 – 2026 (Units)
      Table 26 Asia Pacific Aggregometer Market, by Country, 2016 – 2026 (USD Million)
      Table 27 Asia Pacific Aggregometer Market, by Country, 2016 – 2026 (Units)
      Table 28 Asia Pacific Aggregometer Market, by Type, 2016 – 2026 (USD Million)
      Table 29 Asia Pacific Aggregometer Market, by Type, 2016 – 2026 (Units)
      Table 30 Asia Pacific Aggregometer Market, by Application, 2016 – 2026 (USD Million)
      Table 31 Asia Pacific Aggregometer Market, by Application, 2016 – 2026 (Units)
      Table 32 Asia Pacific Aggregometer Market, by End-Use, 2016 – 2026 (USD Million)
      Table 33 Asia Pacific Aggregometer Market, by End-Use, 2016 – 2026 (Units)
      Table 34 Latin America Aggregometer Market, by Country, 2016 – 2026 (USD Million)
      Table 35 Latin America Aggregometer Market, by Country, 2016 – 2026 (Units)
      Table 36 Latin America Aggregometer Market, by Type, 2016 – 2026 (USD Million)
      Table 37 Latin America Aggregometer Market, by Type, 2016 – 2026 (Units)
      Table 38 Latin America Aggregometer Market, by Application, 2016 – 2026 (USD Million)
      Table 39 Latin America Aggregometer Market, by Application, 2016 – 2026 (Units)
      Table 40 Latin America Aggregometer Market, by End-Use, 2016 – 2026 (USD Million)
      Table 41 Latin America Aggregometer Market, by End-Use, 2016 – 2026 (Units)
      Table 42 The Middle-East and Africa Aggregometer Market, by Country, 2016 – 2026 (USD Million)
      Table 43 The Middle-East and Africa Aggregometer Market, by Country, 2016 – 2026 (Units)
      Table 44 The Middle-East and Africa Aggregometer Market, by Type, 2016 – 2026 (USD Million)
      Table 45 The Middle-East and Africa Aggregometer Market, by Type, 2016 – 2026 (Units)
      Table 46 The Middle-East and Africa Aggregometer Market, by Application, 2016 – 2026 (USD Million)
      Table 47 The Middle-East and Africa Aggregometer Market, by Application, 2016 – 2026 (Units)
      Table 48 The Middle-East and Africa Aggregometer Market, by End-Use, 2016 – 2026 (USD Million)
      Table 49 The Middle-East and Africa Aggregometer Market, by End-Use, 2016 – 2026 (Units)
      Table 50 North America Aggregometer Production, Consumption, Export, Import, 2016 – 2019
      Table 51 Europe Aggregometer Production, Consumption, Export, Import, 2016 – 2019
      Table 52 Asia Pacific Aggregometer Production, Consumption, Export, Import, 2016 – 2019
      Table 53 Latin America Aggregometer Production, Consumption, Export, Import, 2016 – 2019
      Table 54 The Middle-East and Africa Aggregometer Production, Consumption, Export, Import, 2016 – 2019
      Table 55 Global Aggregometer Market - Company Revenue Analysis, 2016 – 2019 (USD Million)
      Table 56 Global Aggregometer Market - Company Revenue Share Analysis, 2016 – 2019 (%)
      Table 57 Global Aggregometer Market - Company Volume Analysis, 2016 – 2019 (Units)
      Table 58 Global Aggregometer Market - Company Volume Share Analysis, 2016 – 2019 (%)
      Table 59 Acquisitions and Mergers
      Table 60 Market Drivers – Impact Analysis
      Table 61 Market Restraints
      Table 62 Market Opportunities
      Table 63 Production Base and Market Concentration Rate of Raw Material
      Table 64 Key Suppliers of Raw Materials
      Table 65 Raw Materials Sources of Aggregometer Major Manufacturers
      Table 66 Major Buyers of Aggregometer
      Table 67 Distributors/Traders of Aggregometer by Region
      

Industry Major Market Players

  • Bio/Data Corporation
  • Chronolog Corporation
  • Helena Laboratories
  • Perfusion
  • Hart Biologicals
  • Alpha Laboratories
  • Instrumentation Laboratory
  • Biola
  • WerfenLife
  • S.A.F. Hoffmann-La Roche Ltd
  • Siemens Healthineers AG
  • Tem Group
  • Sysmex Corporation
  • Haemonetics Corporation
  • Drucker Diagnostics