![]()
Search Market Research Report
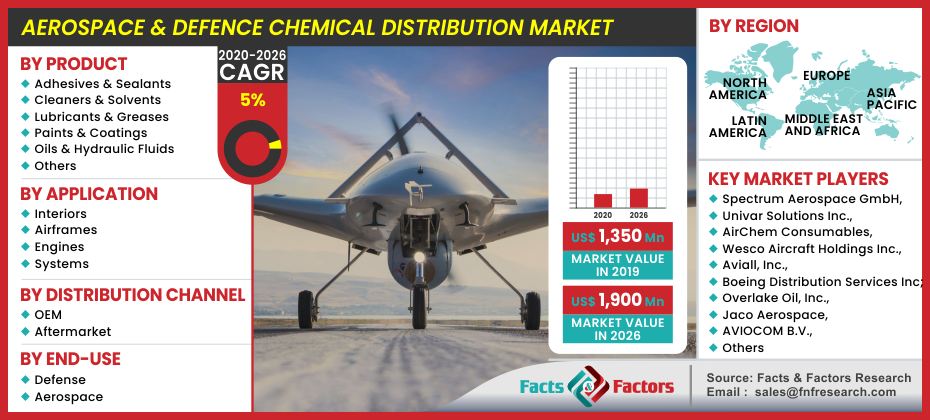
Aerospace & Defense Chemical Distribution Market Size, Share Global Analysis Report, & Defense Chemical Distribution Market By Product (Adhesives & Sealants, Cleaners & Solvents, Lubricants & Greases, Paints & Coatings, Oils & Hydraulic Fluids, and Others), By Application (Interiors, Airframes, Engines, and Systems), By Distribution Channel (Aftermarket, and OEM), By End Use (Defense, and Aerospace): Global Industry Perspective, Comprehensive Analysis, and Forecast, 2020 – 2026

Aerospace & Defense Chemical Distribution Market By Product (Adhesives & Sealants, Cleaners & Solvents, Lubricants & Greases, Paints & Coatings, Oils & Hydraulic Fluids, and Others), By Application (Interiors, Airframes, Engines, and Systems), By Distribution Channel (Aftermarket, and OEM), By End Use (Defense, and Aerospace): Global Industry Perspective, Comprehensive Analysis, and Forecast, 2020 – 2026
Industry Insights
[195+ Pages Report] According to the report published by Facts and Factors, the global aerospace & defense chemical distribution market was estimated at approximately USD 1,350 Million in 2019 and is anticipated to generate revenue of around USD 1,900 Million by end of 2026, growing at a CAGR of around 5% between 2020 and 2026.
 Global Aerospace & Defense Chemical Distribution Market: Overview
The demand for specialty chemicals in the aerospace and defense chemical distribution industry is increasing as aircraft and military vehicles are subjected to harsh climatic conditions. One of the major factors driving the growth of the aerospace and defense chemical distribution market is the increased emphasis on aircraft maintenance, repair, and overhaul (MRO) activities. Aerospace and defense equipment, such as airframes and other materials, are highly susceptible to wear, metal corrosion, and tear, resulting in system failure. As a result, businesses have begun to distribute aerospace and defense chemicals effectively in order to help the leading producers of aerospace and defense equipment in the end-to-end supply chain.
Global Aerospace & Defense Chemical Distribution Market: Growth Factors
Increased military spending is another business growth factor that will boost product demand. Global military spending exceeded USD 1.7 trillion in 2017 and is expected to rise steadily in the coming years. Due to the increased demand for aircraft, the Aerospace and Defense Chemical Distribution industry has grown significantly. Furthermore, the simple availability of products combined with the ability to customize services creates a tremendous business opportunity for key players in the aerospace and defense chemical distribution market. Affordable airfares, growing middle-class wages, and major countries' economic growth are the main drivers of rising air travel demand in developing countries. The existence of economical airlines such as Cebu Pacific, and AirAsia has made air travel more available to Asian people. In the aerospace and defense chemical distribution industry, the rising demand for air travel in the Asia Pacific region will be a significant growth enabler. The number of people who traveled by air in China increased from 290 million in 2006 to about 1 billion in 2016.
Global Aerospace & Defense Chemical Distribution Market: Segmentation
The worldwide aerospace and defense chemical distribution market is divided based on categories such as product, application, end-use, and distribution channel. Based on product market can be split into categories such as adhesives & sealants, oils & hydraulic fluids cleaners & solvents, lubricants & greases, paints & coatings, and others. The cleaners & solvents segment is anticipated to become the leading category of the aerospace and defense chemical distribution market. To protect aircraft parts from corrosion, contaminants, and extreme weather, cleaners, and solvents are used. Owing to the wide usage of cleaners and solvents, the segment is expected to grow at a significant rate. Moreover, based on the application segment, the market can be segmented into categories such as interiors, airframes, engines, and systems. Interiors are a highly dominated segment of the global aerospace & defense chemical distribution industry in terms of application. This pattern is expected to continue for the duration of the predicted period. The significant use of aerospace and defense chemicals in the interior segment for cleaning, painting, and finishing is expected to drive the market during the estimated period. Furthermore, based on the end-use market is decided into categories such as defense, and aerospace. Aerospace is a prominently lucrative segment of the global market. In addition to this, on the basis of distribution channel market is split into categories such as aftermarket, and OEM. OEM category is estimated to dominate the growth of the worldwide market in the forthcoming years. In the aerospace and defense chemical distribution industry, strategic partnerships are playing an important role in serving a wide pool of customers and expanding supply chains with the world's leading aerospace and defense OEMs.
Global Aerospace & Defense Chemical Distribution Market: Regional Analysis
North America has a strong demand for aerospace and defense chemicals. Due to the growing demand for aerospace and defense chemicals in aircraft and helicopters, the region is expected to continue to dominate the global market in the coming years. In the near future, an increase in aircraft production in North America is likely to boost demand for adhesives & sealants, cleaners & solvents, lubricants & greases, paints & coatings, and oils & hydraulic fluids. As a result, the aerospace and defense chemical distribution market in the region is expected to grow in the coming years. One of the major factors driving the growth of the aerospace and defense chemical distribution market is the increased emphasis on aircraft maintenance, repair, and overhaul (MRO) activities. Aerospace and defense equipment, such as airframes and other materials, are highly susceptible to metal corrosion, wear, and tear, resulting in system failure. As a result, businesses have begun to distribute aerospace and defense chemicals effectively in order to help the leading producers of aerospace and defense equipment in the end-to-end supply chain.
Report Scope
Report Attribute |
Details |
Market Size in 2019 |
USD 1,350 Million |
Projected Market Size in 2026 |
USD 1,900 Million |
CAGR Growth Rate |
5.0% CAGR |
Base Year |
2020 |
Forecast Years |
2021-2026 |
Key Market Players |
Spectrum Aerospace GmbH, Univar Solutions Inc., AirChem Consumables, Wesco Aircraft Holdings Inc., Aviall, Inc., Boeing Distribution Services Inc., Overlake Oil, Inc., Jaco Aerospace, Aerospace Chemical Supplies Ltd, AVIOCOM B.V., Ellsworth Adhesives, GracoRoberts, Sky Mart Sales Corp, Aviation Chemical Solutions, Inc., and Others. |
Key Segment |
By Product, By Application,By Distribution Channe, By End-Use, By Region |
Major Regions Covered |
North America, Europe, Asia Pacific, Latin America, and the Middle East & Africa |
Purchase Options |
Request customized purchase options to meet your research needs. Explore purchase options |
Global Aerospace & Defense Chemical Distribution Market: Competitive Players
Key market players operating in worldwide aerospace & defense chemical distribution are :
- Spectrum Aerospace GmbH
- Univar Solutions Inc.
- AirChem Consumables
- Wesco Aircraft Holdings Inc.
- Aviall Inc.
- Boeing Distribution Services Inc.
- Overlake Oil Inc.
- Jaco Aerospace
- Aerospace Chemical Supplies Ltd
- AVIOCOM B.V.
- Ellsworth Adhesives
- GracoRoberts
- Sky Mart Sales Corp
- Aviation Chemical Solutions Inc.
- and Others.
Univar Inc. is a significant industry player with a global presence. The business has a strong market position and offers a wide range of value-added services. To retain its leadership role, the organization has made strategic moves such as mergers and acquisitions, opening sales centers, and so on.
The demand for specialty chemicals in the aerospace and defense chemical distribution industry is increasing as aircraft and military vehicles are subjected to harsh climatic conditions. For example, to support the North American aerospace industry, Graco, a leading supplier of fluid control equipment, has announced the acquisition of E.V. Roberts, a producer, and distributor of materials for aerospace and electronics. Metal corrosion and component failure are common problems with defense equipment airframes. As a result, companies in the aerospace and defense chemical distribution industry are stepping up their efforts to become market leaders in end-to-end customizable supply chain solutions. Pattonair, for example, a leading supply chain service provider for aerospace and defense, recently announced the acquisition of Wesco Aircraft Holdings Inc., an aerospace industry specialist in operational efficiency, in order to become a highly diversified provider of scalable supply chain solutions with a broad product range.
This report segments the aerospace & defense chemical distribution market as follows:
Global Aerospace & Defense Chemical Distribution Market: By Product Segmentation Analysis:
- Adhesives & Sealants
- Cleaners & Solvents
- Lubricants & Greases
- Paints & Coatings
- Oils & Hydraulic Fluids
- Others
Global Aerospace & Defense Chemical Distribution Market: By Application Segmentation Analysis
- Interiors
- Airframes
- Engines
- Systems
Global Aerospace & Defense Chemical Distribution Market: By Distribution Channel Segmentation Analysis
- Aftermarket
- OEM
Global Aerospace & Defense Chemical Distribution Market: By End-Use Segmentation Analysis
- Defense
- Aerospace
Aerospace & Defense Chemical Distribution Market: Regional Segment Analysis
- North America
- U.S.
- Canada
- Europe
- U.K.
- France
- Germany
- Rest of Europe
- Asia Pacific
- China
- Japan
- India
- South Korea
- Rest of Asia Pacific
- Latin America
- Brazil
- Rest of Latin America
- The Middle East and Africa
- GCC Countries
- South Africa
- Rest of MEA
Table of Content
Industry Major Market Players
- Spectrum Aerospace GmbH
- Univar Solutions Inc.
- AirChem Consumables
- Wesco Aircraft Holdings Inc.
- Aviall Inc.
- Boeing Distribution Services Inc.
- Overlake Oil Inc.
- Jaco Aerospace
- Aerospace Chemical Supplies Ltd
- AVIOCOM B.V.
- Ellsworth Adhesives
- GracoRoberts
- Sky Mart Sales Corp
- Aviation Chemical Solutions Inc.


Copyright © 2025 - 2026, All Rights Reserved, Facts and Factors