Search Market Research Report

Discover Our Latest Reports
Discover Our Featured Reports
Discover Top Selling Reports

Acetyl Market Size, Share Global Analysis Report, 2020–2026

report img

Acetyl Market By Product Type (Acetic Anhydride, Ethylene Acetate, Acetic Acid, Vinyl Acetate, and Others), By Industry Vertical (Food & Beverages, Paints & Coatings, Pharmaceutical, Oil & Gas, Furniture, and Others): Global Industry Outlook, Market Size, Business Intelligence, Consumer Preferences, Statistical Surveys, Comprehensive Analysis, Historical Developments, Current Trends, and Forecast 2020–2026

Industry Insights

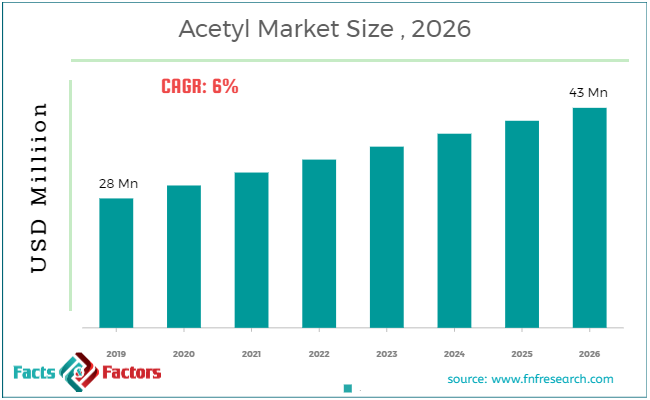
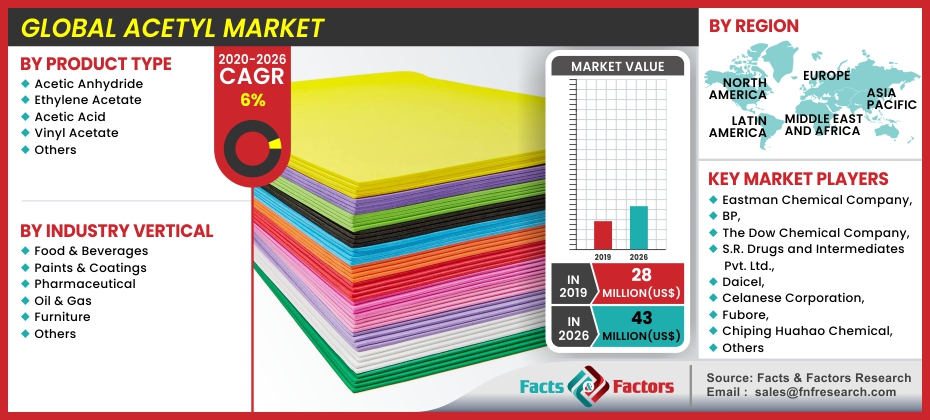
[175+ Pages Report] According to the report published by Facts Factors, the global acetyl market size was worth around USD  28 million in 2019 and is predicted to grow to around USD 43 million by 2026 with a compound annual growth rate (CAGR) of roughly 6% between 2020 and 2026. The report analyzes the global acetyl market drivers, restraints/challenges, and the effect they have on the demands during the projection period. In addition, the report explores emerging opportunities in the acetyl market.

acetyl-market-size

To know more about this report | Request Free Sample Copy

This specialized and expertise-oriented industry research report scrutinizes the technical and commercial business outlook of the acetyl market. The report analyzes and declares the historical and current trends analysis of the acetyl industry and subsequently recommends the projected trends anticipated to be observed in the acetyl market during the upcoming years.

The acetyl market report analyzes and notifies the industry statistics at the global as well as regional and country levels in order to acquire a thorough perspective of the entire acetyl market. The historical and past insights are provided for FY 2016 to FY 2019 whereas projected trends are delivered for FY 2020 to FY 2026. The quantitative and numerical data is represented in terms of value (USD Million) and volume (Kilo Ton) from FY 2016 – 2026.

Acetyl Market

To know more about this report | Request Free Sample Copy

The quantitative data is further underlined and reinforced by comprehensive qualitative data which comprises various across-the-board market dynamics. The rationales which directly or indirectly impact the acetyl industry are exemplified through parameters such as growth drivers, restraints, challenges, and opportunities among other impacting factors.

Throughout our research report, we have encompassed all the proven models and tools of industry analysis and extensively illustrated all the key business strategies and business models adopted in the acetyl industry. The report provides an all-inclusive and detailed competitive landscape prevalent in the acetyl market.

The report utilizes established industry analysis tools and models such as Porter’s Five Forces framework to analyze and recognize critical business strategies adopted by various stakeholders involved in the entire value chain of the acetyl industry. The acetyl market report additionally employs SWOT analysis and PESTLE analysis models for further in-depth analysis.


logoKey Insights from Primary Research

  • The pharmaceutical industry has seen robust growth in recent years owing to the increase in healthcare spending by consumers has driven the consumption of paracetamol and aspirin. This has been a key growth driving factor for the global acetyl market.
  • Research and development in exploring the applicability of acetyl in different applications are likely to create new avenues for the global acetyl market in the future.
  • Based on product type, the acetic acid segment is expected to record the highest growth rate over the forecasted period 2020-2026 in the global acetyl market.
  • Our primary respondents estimate that the global acetyl market was worth approximately USD 28 billion in 2019.

logoKey Recommendations from Analysts

  • Acetyl is used in different types of medicines and pharmaceutical products and growth in the consumption of medicines have been one of the key growth driving the global acetyl market.
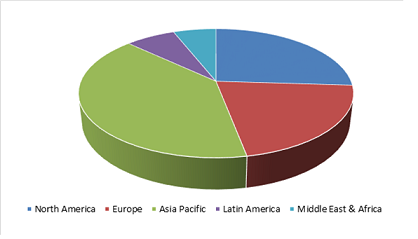
  • The Asia Pacific accounted for the majority of the market share in the global acetyl market, accounting for a market share of 40% in 2019.
  • In the Asia Pacific, China and India are expected to record the fastest growth in the future owing to rapid growth in the healthcare industry in the region.
  • Our analysts estimate that the global acetyl market is expected to be valued at nearly USD 43 billion by the end of 2026 and is anticipated to record a CAGR of around 6%

logoGlobal Acetyl Market Revenue Share – By Region

Acetyl Market

To know more about this report | Request Free Sample Copy


The report study further includes an in-depth analysis of industry players' market shares and provides an overview of leading players' market position in the acetyl sector. Key strategic developments in the acetyl market competitive landscape such as acquisitions & mergers, inaugurations of different products and services, partnerships & joint ventures, MoU agreements, VC & funding activities, R&D activities, and geographic expansion among other noteworthy activities by key players of the acetyl market are appropriately highlighted in the report.

The acetyl group comprises various organic compounds such as acetic acid, acetaminophen, acetylcysteine, acetyl-CoA, etc. These compounds are mainly used in pharmaceutical products and medicines such as paracetamol, aspirin, etc. The global acetyl market has been driven by the growing consumption of medicines.

logoReport Scope

Report Attribute

Details

Market Size in 2019

USD 28 Million

Projected Market Size in 2026

USD 43 Million

CAGR Growth Rate

6% CAGR

Base Year

2019

Forecast Years

2020-2026

Key Market Players

Eastman Chemical Company, BP, The Dow Chemical Company, S.R. Drugs and Intermediates Pvt. Ltd., Daicel, Celanese Corporation, Quzhou Weirong Pharmaceutical & Chemical Co. Ltd., Fubore, Chiping Huahao Chemical, LyondellBasell Industries Holdings B.V., Wacker Chemie AG, and others.

Key Segment

By Product Type, Industry Vertical, and Region

Major Regions Covered

North America, Europe, Asia Pacific, Latin America, and the Middle East &, Africa

Purchase Options

Request customized purchase options to meet your research needs. Explore purchase options

logoRegional Analysis:

The acetyl market research report delivers an acute valuation and taxonomy of the acetyl industry by practically splitting the market on the basis of different product types, industry verticals, and regions. Through the analysis of the historical and projected trends, all the segments and sub-segments were evaluated through the bottom-up approach, and different market sizes have been projected for FY 2020 to FY 2026.

The regional segmentation of the acetyl industry includes the complete classification of all the major continents including North America, Latin America, Europe, Asia Pacific, and the Middle East & Africa. Further, country-wise data for the acetyl industry is provided for the leading economies of the world.

The acetyl market is segmented based on product type, industry vertical, and region. On the basis of product type, the market is classified into acetic anhydride, ethylene acetate, acetic acid, vinyl acetate, and others. In terms of industry verticals, the market is bifurcated into food & beverages, paints & coatings, pharmaceutical, oil & gas, furniture, and others.

logoSome of the essential players operating in the acetyl market, but not restricted include:

  • Eastman Chemical Company
  • BP
  • The Dow Chemical Company
  • S.R. Drugs and Intermediates Pvt. Ltd.
  • Daicel
  • Celanese Corporation
  • Quzhou Weirong Pharmaceutical & Chemical Co. Ltd.
  • Fubore
  • Chiping Huahao Chemical
  • LyondellBasell Industries Holdings B.V.
  • Wacker Chemie AG

The taxonomy of the acetyl Market by its scope and segmentation is as follows:

logo By Product Type Segmentation Analysis

  • Acetic Anhydride
  • Ethylene Acetate
  • Acetic Acid
  • Vinyl Acetate
  • Others

logo By Industry Vertical Segmentation Analysis

  • Food & Beverages
  • Paints & Coatings
  • Pharmaceutical
  • Oil & Gas
  • Furniture
  • Others

logo By Regional Segmentation Analysis

  • North America
    • The U.S.
    • Canada
  • Europe
    • Germany
    • The UK
    • France
    • Spain
    • Italy
    • Rest of Europe
  • Asia Pacific
    • China
    • Japan
    • India
    • South Korea
    • Southeast Asia
    • Rest of Asia Pacific
  • Latin America
    • Brazil
    • Mexico
    • Rest of Latin America
  • Middle East & Africa
    • GCC
    • South Africa
    • Rest of the Middle East & Africa

Table of Content

  1. Chapter 1 Executive Summary
    1. 1.1. Introduction of Acetyl
    2. 1.2. Global Acetyl Market, 2019 & 2026 (USD Million)
    3. 1.3. Global Acetyl Market, 2016 – 2026 (USD Million) (Kilo Tons)
    4. 1.4. Global Acetyl Market Absolute Revenue Opportunity, 2016 – 2026 (USD Million)
    5. 1.5. Global Acetyl Market Incremental Revenue Opportunity, 2020 – 2026 (USD Million)
  2. Chapter 2 Acetyl Market – Product Type Analysis
    1. 2.1. Global Acetyl Market – Product Type Overview
    2. 2.2. Global Acetyl Market Share, by Product Type, 2019 & 2026 (USD Million)
    3. 2.3. Global Acetyl Market share, by Product Type, 2019 & 2026 (Kilo Tons)
    4. 2.4. Acetic Anhydride
      1. 2.4.1. Global Acetic Anhydride Acetyl Market, 2016 – 2026 (USD Million)
      2. 2.4.2. Global Acetic Anhydride Acetyl Market, 2016 – 2026 (Kilo Tons)
    5. 2.5. Ethylene Acetate
      1. 2.5.1. Global Ethylene Acetate Acetyl Market, 2016 – 2026 (USD Million)
      2. 2.5.2. Global Ethylene Acetate Acetyl Market, 2016 – 2026 (Kilo Tons)
    6. 2.6. Acetic Acid
      1. 2.6.1. Global Acetic Acid Acetyl Market, 2016 – 2026 (USD Million)
      2. 2.6.2. Global Acetic Acid Acetyl Market, 2016 – 2026 (Kilo Tons)
    7. 2.7. Vinyl Acetate
      1. 2.7.1. Global Vinyl Acetate Acetyl Market, 2016 – 2026 (USD Million)
      2. 2.7.2. Global Vinyl Acetate Acetyl Market, 2016 – 2026 (Kilo Tons)
    8. 2.8. Others
      1. 2.8.1. Global Others Acetyl Market, 2016 – 2026 (USD Million)
      2. 2.8.2. Global Others Acetyl Market, 2016 – 2026 (Kilo Tons)
  3. Chapter 3 Acetyl Market – Industry Vertical Analysis
    1. 3.1. Global Acetyl Market – Industry Vertical Overview
    2. 3.2. Global Acetyl Market Share, by Industry Vertical, 2019 & 2026 (USD Million)
    3. 3.3. Global Acetyl Market share, by Industry Vertical, 2019 & 2026 (Kilo Tons)
    4. 3.4. Food & Beverages
      1. 3.4.1. Global Food & Beverages Acetyl Market, 2016 – 2026 (USD Million)
      2. 3.4.2. Global Food & Beverages Acetyl Market, 2016 – 2026 (Kilo Tons)
    5. 3.5. Paints & Coatings
      1. 3.5.1. Global Paints & Coatings Acetyl Market, 2016 – 2026 (USD Million)
      2. 3.5.2. Global Paints & Coatings Acetyl Market, 2016 – 2026 (Kilo Tons)
    6. 3.6. Pharmaceuticals
      1. 3.6.1. Global Pharmaceuticals Acetyl Market, 2016 – 2026 (USD Million)
      2. 3.6.2. Global Pharmaceuticals Acetyl Market, 2016 – 2026 (Kilo Tons)
    7. 3.7. Oil & Gas
      1. 3.7.1. Global Oil & Gas Acetyl Market, 2016 – 2026 (USD Million)
      2. 3.7.2. Global Oil & Gas Acetyl Market, 2016 – 2026 (Kilo Tons)
    8. 3.8. Furniture
      1. 3.8.1. Global Furniture Acetyl Market, 2016 – 2026 (USD Million)
      2. 3.8.2. Global Furniture Acetyl Market, 2016 – 2026 (Kilo Tons)
    9. 3.9. Others
      1. 3.9.1. Global Others Acetyl Market, 2016 – 2026 (USD Million)
      2. 3.9.2. Global Others Acetyl Market, 2016 – 2026 (Kilo Tons)
  4. Chapter 4 Acetyl Market – Regional Analysis
    1. 4.1. Global Acetyl Market Regional Overview
    2. 4.2. Global Acetyl Market Share, by Region, 2019 & 2026 (USD Million)
    3. 4.3. Global Acetyl Market Share, by Region, 2019 & 2026 (Kilo Tons)
    4. 4.4. North America
      1. 4.4.1. North America Acetyl Market, 2016 – 2026 (USD Million)
        1. 4.4.1.1. North America Acetyl Market, by Country, 2016 – 2026 (USD Million)
      2. 4.4.2. North America Market, 2016 – 2026 (Kilo Tons)
        1. 4.4.2.1. North America Acetyl Market, by Country, 2016 – 2026 (Kilo Tons)
      3. 4.4.3. North America Acetyl Market, by Product Type, 2016 – 2026
        1. 4.4.3.1. North America Acetyl Market, by Product Type, 2016 – 2026 (USD Million)
        2. 4.4.3.2. North America Acetyl Market, by Product Type, 2016 – 2026 (Kilo Tons)
      4. 4.4.4. North America Acetyl Market, by Industry Vertical, 2016 – 2026
        1. 4.4.4.1. North America Acetyl Market, by Industry Vertical, 2016 – 2026 (USD Million)
        2. 4.4.4.2. North America Acetyl Market, by Industry Vertical, 2016 – 2026 (Kilo Tons)
      5. 4.4.5. U.S.
        1. 4.4.5.1. U.S. Acetyl Market, 2016 – 2026 (USD Million)
        2. 4.4.5.2. U.S. Acetyl Market, 2016 – 2026 (Kilo Tons)
      6. 4.4.6. Canada
        1. 4.4.6.1. Canada Acetyl Market, 2016 – 2026 (USD Million)
        2. 4.4.6.2. Canada Acetyl Market, 2016 – 2026 (Kilo Tons)
    5. 4.5. Europe
      1. 4.5.1. Europe Acetyl Market, 2016 – 2026 (USD Million)
        1. 4.5.1.1. Europe Acetyl Market, by Country, 2016 – 2026 (USD Million)
      2. 4.5.2. Europe Market, 2016 – 2026 (Kilo Tons)
        1. 4.5.2.1. Europe Acetyl Market, by Country, 2016 – 2026 (Kilo Tons)
      3. 4.5.3. Europe Acetyl Market, by Product Type, 2016 – 2026
        1. 4.5.3.1. Europe Acetyl Market, by Product Type, 2016 – 2026 (USD Million)
        2. 4.5.3.2. Europe Acetyl Market, by Product Type, 2016 – 2026 (Kilo Tons)
      4. 4.5.4. Europe Acetyl Market, by Industry Vertical, 2016 – 2026
        1. 4.5.4.1. Europe Acetyl Market, by Industry Vertical, 2016 – 2026 (USD Million)
        2. 4.5.4.2. Europe Acetyl Market, by Industry Vertical, 2016 – 2026 (Kilo Tons)
      5. 4.5.5. Germany
        1. 4.5.5.1. Germany Acetyl Market, 2016 – 2026 (USD Million)
        2. 4.5.5.2. Germany Acetyl Market, 2016 – 2026 (Kilo Tons)
      6. 4.5.6. France
        1. 4.5.6.1. France Acetyl Market, 2016 – 2026 (USD Million)
        2. 4.5.6.2. France Acetyl Market, 2016 – 2026 (Kilo Tons)
      7. 4.5.7. U.K.
        1. 4.5.7.1. U.K. Acetyl Market, 2016 – 2026 (USD Million)
        2. 4.5.7.2. U.K. Acetyl Market, 2016 – 2026 (Kilo Tons)
      8. 4.5.8. Italy
        1. 4.5.8.1. Italy Acetyl Market, 2016 – 2026 (USD Million)
        2. 4.5.8.2. Italy Acetyl Market, 2016 – 2026 (Kilo Tons)
      9. 4.5.9. Spain
        1. 4.5.9.1. Spain Acetyl Market, 2016 – 2026 (USD Million)
        2. 4.5.9.2. Spain Acetyl Market, 2016 – 2026 (Kilo Tons)
      10. 4.5.10. Rest of Europe
        1. 4.5.10.1. Rest of Europe Acetyl Market, 2016 – 2026 (USD Million)
        2. 4.5.10.2. Rest of Europe Acetyl Market, 2016 – 2026 (Kilo Tons)
    6. 4.6. Asia Pacific
      1. 4.6.1. Asia Pacific Acetyl Market, 2016 – 2026 (USD Million)
        1. 4.6.1.1. Asia Pacific Acetyl Market, by Country, 2016 – 2026 (USD Million)
      2. 4.6.2. Asia Pacific Market, 2016 – 2026 (Kilo Tons)
        1. 4.6.2.1. Asia Pacific Acetyl Market, by Country, 2016 – 2026 (Kilo Tons)
      3. 4.6.3. Asia Pacific Acetyl Market, by Product Type, 2016 – 2026
        1. 4.6.3.1. Asia Pacific Acetyl Market, by Product Type, 2016 – 2026 (USD Million)
        2. 4.6.3.2. Asia Pacific Acetyl Market, by Product Type, 2016 – 2026 (Kilo Tons)
      4. 4.6.4. Asia Pacific Acetyl Market, by Industry Vertical, 2016 – 2026
        1. 4.6.4.1. Asia Pacific Acetyl Market, by Industry Vertical, 2016 – 2026 (USD Million)
        2. 4.6.4.2. Asia Pacific Acetyl Market, by Industry Vertical, 2016 – 2026 (Kilo Tons)
      5. 4.6.5. China
        1. 4.6.5.1. China Acetyl Market, 2016 – 2026 (USD Million)
        2. 4.6.5.2. China Acetyl Market, 2016 – 2026 (Kilo Tons)
      6. 4.6.6. Japan
        1. 4.6.6.1. Japan Acetyl Market, 2016 – 2026 (USD Million)
        2. 4.6.6.2. Japan Acetyl Market, 2016 – 2026 (Kilo Tons)
      7. 4.6.7. India
        1. 4.6.7.1. India Acetyl Market, 2016 – 2026 (USD Million)
        2. 4.6.7.2. India Acetyl Market, 2016 – 2026 (Kilo Tons)
      8. 4.6.8. South Korea
        1. 4.6.8.1. South Korea Acetyl Market, 2016 – 2026 (USD Million)
        2. 4.6.8.2. South Korea Acetyl Market, 2016 – 2026 (Kilo Tons)
      9. 4.6.9. South-East Asia
        1. 4.6.9.1. South-East Asia Acetyl Market, 2016 – 2026 (USD Million)
        2. 4.6.9.2. South-East Asia Acetyl Market, 2016 – 2026 (Kilo Tons)
      10. 4.6.10. Rest of Asia Pacific
        1. 4.6.10.1. Rest of Asia Pacific Acetyl Market, 2016 – 2026 (USD Million)
        2. 4.6.10.2. Rest of Asia Pacific Acetyl Market, 2016 – 2026 (Kilo Tons)
    7. 4.7. Latin America
      1. 4.7.1. Latin America Acetyl Market, 2016 – 2026 (USD Million)
        1. 4.7.1.1. Latin America Acetyl Market, by Country, 2016 – 2026 (USD Million)
      2. 4.7.2. Latin America Market, 2016 – 2026 (Kilo Tons)
        1. 4.7.2.1. Latin America Acetyl Market, by Country, 2016 – 2026 (Kilo Tons)
      3. 4.7.3. Latin America Acetyl Market, by Product Type, 2016 – 2026
        1. 4.7.3.1. Latin America Acetyl Market, by Product Type, 2016 – 2026 (USD Million)
        2. 4.7.3.2. Latin America Acetyl Market, by Product Type, 2016 – 2026 (Kilo Tons)
      4. 4.7.4. Latin America Acetyl Market, by Industry Vertical, 2016 – 2026
        1. 4.7.4.1. Latin America Acetyl Market, by Industry Vertical, 2016 – 2026 (USD Million)
        2. 4.7.4.2. Latin America Acetyl Market, by Industry Vertical, 2016 – 2026 (Kilo Tons)
      5. 4.7.5. Brazil
        1. 4.7.5.1. Brazil Acetyl Market, 2016 – 2026 (USD Million)
        2. 4.7.5.2. Brazil Acetyl Market, 2016 – 2026 (Kilo Tons)
      6. 4.7.6. Mexico
        1. 4.7.6.1. Mexico Acetyl Market, 2016 – 2026 (USD Million)
        2. 4.7.6.2. Mexico Acetyl Market, 2016 – 2026 (Kilo Tons)
      7. 4.7.7. Rest of Latin America
        1. 4.7.7.1. Rest of Latin America Acetyl Market, 2016 – 2026 (USD Million)
        2. 4.7.7.2. Rest of Latin America Acetyl Market, 2016 – 2026 (Kilo Tons)
    8. 4.8. The Middle-East and Africa
      1. 4.8.1. The Middle-East and Africa Acetyl Market, 2016 – 2026 (USD Million)
        1. 4.8.1.1. The Middle-East and Africa Acetyl Market, by Country, 2016 – 2026 (USD Million)
      2. 4.8.2. The Middle-East and Africa Market, 2016 – 2026 (Kilo Tons)
        1. 4.8.2.1. The Middle-East and Africa Acetyl Market, by Country, 2016 – 2026 (Kilo Tons)
      3. 4.8.3. The Middle-East and Africa Acetyl Market, by Product Type, 2016 – 2026
        1. 4.8.3.1. The Middle-East and Africa Acetyl Market, by Product Type, 2016 – 2026 (USD Million)
        2. 4.8.3.2. The Middle-East and Africa Acetyl Market, by Product Type, 2016 – 2026 (Kilo Tons)
      4. 4.8.4. The Middle-East and Africa Acetyl Market, by Industry Vertical, 2016 – 2026
        1. 4.8.4.1. The Middle-East and Africa Acetyl Market, by Industry Vertical, 2016 – 2026 (USD Million)
        2. 4.8.4.2. The Middle-East and Africa Acetyl Market, by Industry Vertical, 2016 – 2026 (Kilo Tons)
      5. 4.8.5. GCC Countries
        1. 4.8.5.1. GCC Countries Acetyl Market, 2016 – 2026 (USD Million)
        2. 4.8.5.2. GCC Countries Acetyl Market, 2016 – 2026 (Kilo Tons)
      6. 4.8.6. South Africa
        1. 4.8.6.1. South Africa Acetyl Market, 2016 – 2026 (USD Million)
        2. 4.8.6.2. South Africa Acetyl Market, 2016 – 2026 (Kilo Tons)
      7. 4.8.7. Rest of Middle-East Africa
        1. 4.8.7.1. Rest of Middle-East Africa Acetyl Market, 2016 – 2026 (USD Million)
        2. 4.8.7.2. Rest of Middle-East Africa Acetyl Market, 2016 – 2026 (Kilo Tons)
  5. Chapter 5 Acetyl Production, Consumption, Export, Import by Regions
    1. 5.1. Global Acetyl Production and Consumption, 2016 – 2026 (Kilo Tons)
    2. 5.2. Global Import and Export Analysis, by Region
  6. Chapter 6 Acetyl Market – Competitive Landscape
    1. 6.1. Competitor Market Share – Revenue
    2. 6.2. Market Concentration Rate Analysis, Top 3 and Top 5 Players
    3. 6.3. Competitor Market Share – Volume
    4. 6.4. Strategic Developments
      1. 6.4.1. Acquisitions and Mergers
      2. 6.4.2. New Products
      3. 6.4.3. Research & Development Activities
  7. Chapter 7 Company Profiles
    1. 7.1. Eastman Chemical Company
      1. 7.1.1. Company Overview
      2. 7.1.2. Product/Service Portfolio
      3. 7.1.3. Eastman Chemical Company Sales, Revenue, Price, and Gross Margin
      4. 7.1.4. Eastman Chemical Company Revenue and Growth Rate
      5. 7.1.5. Eastman Chemical Company Market Share
      6. 7.1.6. Recent Initiatives, Funding/VC Activities, and Technological Innovations
    2. 7.2. BP p.l.c.
      1. 7.2.1. Company Overview
      2. 7.2.2. Product/Service Portfolio
      3. 7.2.3. BP p.l.c. Sales, Revenue, Price, and Gross Margin
      4. 7.2.4. BP p.l.c. Revenue and Growth Rate
      5. 7.2.5. BP p.l.c. Market Share
      6. 7.2.6. Recent Initiatives, Funding/VC Activities, and Technological Innovations
    3. 7.3. The Dow Chemical Company
      1. 7.3.1. Company Overview
      2. 7.3.2. Product/Service Portfolio
      3. 7.3.3. The Dow Chemical Company Sales, Revenue, Price, and Gross Margin
      4. 7.3.4. The Dow Chemical Company Revenue and Growth Rate
      5. 7.3.5. The Dow Chemical Company Market Share
      6. 7.3.6. Recent Initiatives, Funding/VC Activities, and Technological Innovations
        1. 7.4. S.R.Drugs and Intermediates Pvt. Ltd.
      7. 7.4.1. Company Overview
      8. 7.4.2. Product/Service Portfolio
        1. 7.4.3. S.R.Drugs and Intermediates Pvt. Ltd. Sales, Revenue, Price, and Gross Margin
        2. 7.4.4. S.R.Drugs and Intermediates Pvt. Ltd. Revenue and Growth Rate
        3. 7.4.5. S.R.Drugs and Intermediates Pvt. Ltd. Market Share
    4. 7.4.6. Recent Initiatives, Funding/VC Activities, and Technological Innovations
  8. 7.5. Daicel
    1. 7.5.1. Company Overview
    2. 7.5.2. Product/Service Portfolio
    3. 7.5.3. Daicel Sales, Revenue, Price, and Gross Margin
    4. 7.5.4. Daicel Revenue and Growth Rate
    5. 7.5.5. Daicel Market Share
    6. 7.5.6. Recent Initiatives, Funding/VC Activities, and Technological Innovations
  9. 7.6. Celanese Corporation
    1. 7.6.1. Company Overview
    2. 7.6.2. Product/Service Portfolio
    3. 7.6.3. Celanese Corporation Sales, Revenue, Price, and Gross Margin
    4. 7.6.4. Celanese Corporation Revenue and Growth Rate
    5. 7.6.5. Celanese Corporation Market Share
    6. 7.6.6. Recent Initiatives, Funding/VC Activities, and Technological Innovations
  10. 7.7. Quzhou Weirong Pharmaceutical & Chemical Co., Ltd
    1. 7.7.1. Company Overview
    2. 7.7.2. Product/Service Portfolio
    3. 7.7.3. Quzhou Weirong Pharmaceutical & Chemical Co., Ltd Sales, Revenue, Price, and Gross Margin
    4. 7.7.4. Quzhou Weirong Pharmaceutical & Chemical Co., Ltd Revenue and Growth Rate
    5. 7.7.5. Quzhou Weirong Pharmaceutical & Chemical Co., Ltd Market Share
    6. 7.7.6. Recent Initiatives, Funding/VC Activities, and Technological Innovations
  11. 7.8. Fubore
    1. 7.8.1. Company Overview
    2. 7.8.2. Product/Service Portfolio
    3. 7.8.3. Fubore Sales, Revenue, Price, and Gross Margin
    4. 7.8.4. Fubore Revenue and Growth Rate
    5. 7.8.5. Fubore Market Share
    6. 7.8.6. Recent Initiatives, Funding/VC Activities, and Technological Innovations
  12. 7.9. Chiping Huahao Chemical
    1. 7.9.1. Company Overview
    2. 7.9.2. Product/Service Portfolio
    3. 7.9.3. Chiping Huahao Chemical Sales, Revenue, Price, and Gross Margin
    4. 7.9.4. Chiping Huahao Chemical Revenue and Growth Rate
    5. 7.9.5. Chiping Huahao Chemical Market Share
    6. 7.9.6. Recent Initiatives, Funding/VC Activities, and Technological Innovations
  13. 7.10. LyondellBasell Industries Holdings B.V.
    1. 7.10.1. Company Overview
    2. 7.10.2. Product/Service Portfolio
    3. 7.10.3. LyondellBasell Industries Holdings B.V. Sales, Revenue, Price, and Gross Margin
    4. 7.10.4. LyondellBasell Industries Holdings B.V. Revenue and Growth Rate
    5. 7.10.5. LyondellBasell Industries Holdings B.V. Market Share
    6. 7.10.6. Recent Initiatives, Funding/VC Activities, and Technological Innovations
  14. 7.11. Wacker Chemie AG
    1. 7.11.1. Company Overview
    2. 7.11.2. Product/Service Portfolio
    3. 7.11.3. Wacker Chemie AG Sales, Revenue, Price, and Gross Margin
    4. 7.11.4. Wacker Chemie AG Revenue and Growth Rate
    5. 7.11.5. Wacker Chemie AG Market Share
    6. 7.11.6. Recent Initiatives, Funding/VC Activities, and Technological Innovations
  • Chapter 8 Acetyl — Industry Analysis
    1. 8.1. Introduction and Taxonomy
    2. 8.2. Acetyl Market – Key Trends
      1. 8.2.1. Market Drivers
      2. 8.2.2. Market Restraints
      3. 8.2.3. Market Opportunities
    3. 8.3. Value Chain Analysis
    4. 8.4. Key Mandates and Regulations
    5. 8.5. Technology Roadmap and Timeline
    6. 8.6. Acetyl Market – Attractiveness Analysis
      1. 8.6.1. By Product Type
      2. 8.6.2. By Industry Vertical
      3. 8.6.3. By Region
  • Chapter 9 Raw Material Analysis
    1. 9.1. Acetyl Key Raw Material Analysis
      1. 9.1.1. Key Raw Materials
      2. 9.1.2. Price Trend of Key Raw Materials
    2. 9.2. Key Suppliers of Raw Materials
    3. 9.3. Proportion of Manufacturing Cost Structure
      1. 9.3.1. Raw Materials Cost
      2. 9.3.2. Labor Cost
      3. 9.3.3. Manufacturing Expenses
      4. 9.3.4. Miscellaneous Expenses
    4. 9.4. Manufacturing Cost Analysis of Acetyl
  • Chapter 10 Industrial Chain, Sourcing Strategy, and Downstream Buyers
    1. 10.1. Acetyl Industrial Chain Analysis
    2. 10.2. Upstream Raw Materials Sourcing
      1. 10.2.1. Risk Mitigation:
      2. 10.2.2. Supplier Relationships:
      3. 10.2.3. Business Processes:
      4. 10.2.4. Securing the Product:
    3. 10.3. Raw Materials Sources of Acetyl Major Manufacturers
    4. 10.4. Downstream Buyers
    5. 10.5. Distributors/Traders List
  • Chapter 11 Marketing Strategy Analysis, Distributors
    1. 11.1. Marketing Channel
    2. 11.2. Direct Marketing
    3. 11.3. Indirect Marketing
    4. 11.4. Marketing Channel Development Trends
    5. 11.5. Economic/Political Environmental Change
  • Chapter 12 Report Conclusion & Key Insights
    1. 12.1. Key Insights from Primary Interviews & Surveys Respondents
    2. 12.2. Key Takeaways from Analysts, Consultants, and Industry Leaders
  • Chapter 13 Research Approach & Methodology
    1. 13.1. Report Description
    2. 13.2. Research Scope
    3. 13.3. Research Methodology
      1. 13.3.1. Secondary Research
      2. 13.3.2. Primary Research
      3. 13.3.3. Statistical Models
        1. 13.3.3.1. Company Share Analysis Model
        2. 13.3.3.2. Revenue Based Modeling
      4. 13.3.4. Research Limitations

      List of Figures

      Fig.1 Product Picture of Acetyl
      Fig.2 Global Acetyl Market, 2016 – 2026 (USD Million)
      Fig.3 Global Acetyl Market, 2016 – 2026 (Kilo Tons)
      Fig.4 Global Acetyl Market Absolute Revenue Opportunity, 2016 – 2026 (USD Million)
      Fig.5 Global Acetyl Market Incremental Revenue Opportunity, 2020 – 2026 (USD Million)
      Fig.6 Global Acetyl Market Share, by Product Type, 2019 & 2026 (USD Million)
      Fig.7 Global Acetyl Market Share, by Product Type, 2019 & 2026 (Kilo Tons)
      Fig.8 Global Acetic Anhydride Acetyl Market, 2016 – 2026 (USD Million)
      Fig.9 Global Acetic Anhydride Acetyl Market, 2016 – 2026 (Kilo Tons)
      Fig.10 Global Ethylene Acetate Acetyl Market, 2016 – 2026 (USD Million)
      Fig.11 Global Ethylene Acetate Acetyl Market, 2016 – 2026 (Kilo Tons)
      Fig.12 Global Acetic Acid Acetyl Market, 2016 – 2026 (USD Million)
      Fig.13 Global Acetic Acid Acetyl Market, 2016 – 2026 (Kilo Tons)
      Fig.14 Global Vinyl Acetate Acetyl Market, 2016 – 2026 (USD Million)
      Fig.15 Global Vinyl Acetate Acetyl Market, 2016 – 2026 (Kilo Tons)
      Fig.16 Global Others Acetyl Market, 2016 – 2026 (USD Million)
      Fig.17 Global Others Acetyl Market, 2016 – 2026 (Kilo Tons)
      Fig.18 Global Acetyl Market Share, by Industry Vertical, 2019 & 2026 (USD Million)
      Fig.19 Global Acetyl Market Share, by Industry Vertical, 2019 & 2026 (Kilo Tons)
      Fig.20 Global Food & Beverages Acetyl Market, 2016 – 2026 (USD Million)
      Fig.21 Global Food & Beverages Acetyl Market, 2016 – 2026 (Kilo Tons)
      Fig.22 Global Paints & Coatings Acetyl Market, 2016 – 2026 (USD Million)
      Fig.23 Global Paints & Coatings Acetyl Market, 2016 – 2026 (Kilo Tons)
      Fig.24 Global Pharmaceuticals Acetyl Market, 2016 – 2026 (USD Million)
      Fig.25 Global Pharmaceuticals Acetyl Market, 2016 – 2026 (Kilo Tons)
      Fig.26 Global Oil & Gas Acetyl Market, 2016 – 2026 (USD Million)
      Fig.27 Global Oil & Gas Acetyl Market, 2016 – 2026 (Kilo Tons)
      Fig.28 Global Furniture Acetyl Market, 2016 – 2026 (USD Million)
      Fig.29 Global Furniture Acetyl Market, 2016 – 2026 (Kilo Tons)
      Fig.30 Global Others Acetyl Market, 2016 – 2026 (USD Million)
      Fig.31 Global Others Acetyl Market, 2016 – 2026 (Kilo Tons)
      Fig.32 Global Acetyl Market Share, by Region, 2019 & 2026 (USD Million)
      Fig.33 Global Acetyl Market Share, by Region, 2019 & 2026 (Kilo Tons)
      Fig.34 North America Acetyl Market, 2016 – 2026 (USD Million)
      Fig.35 North America Acetyl Market, 2016 – 2026 (Kilo Tons)
      Fig.36 U.S. Acetyl Market, 2016 – 2026 (USD Million)
      Fig.37 U.S. Acetyl  Market, 2016 – 2026 (Kilo Tons)
      Fig.38 Canada Acetyl Market, 2016 – 2026 (USD Million)
      Fig.39 Canada Acetyl  Market, 2016 – 2026 (Kilo Tons)
      Fig.40 Europe Acetyl Market, 2016 – 2026 (USD Million)
      Fig.41 Europe Acetyl Market, 2016 – 2026 (Kilo Tons)
      Fig.42 Germany Acetyl Market, 2016 – 2026 (USD Million)
      Fig.43 Germany Acetyl  Market, 2016 – 2026 (Kilo Tons)
      Fig.44 France Acetyl Market, 2016 – 2026 (USD Million)
      Fig.45 France Acetyl  Market, 2016 – 2026 (Kilo Tons)
      Fig.46 U.K. Acetyl Market, 2016 – 2026 (USD Million)
      Fig.47 U.K. Acetyl  Market, 2016 – 2026 (Kilo Tons)
      Fig.48 Italy Acetyl Market, 2016 – 2026 (USD Million)
      Fig.49 Italy Acetyl  Market, 2016 – 2026 (Kilo Tons)
      Fig.50 Spain Acetyl Market, 2016 – 2026 (USD Million)
      Fig.51 Spain Acetyl  Market, 2016 – 2026 (Kilo Tons)
      Fig.52 Rest of Europe Acetyl Market, 2016 – 2026 (USD Million)
      Fig.53 Rest of Europe Acetyl  Market, 2016 – 2026 (Kilo Tons)
      Fig.54 Asia Pacific Acetyl Market, 2016 – 2026 (USD Million)
      Fig.55 Asia Pacific Acetyl Market, 2016 – 2026 (Kilo Tons)
      Fig.56 China Acetyl Market, 2016 – 2026 (USD Million)
      Fig.57 China Acetyl  Market, 2016 – 2026 (Kilo Tons)
      Fig.58 Japan Acetyl Market, 2016 – 2026 (USD Million)
      Fig.59 Japan Acetyl  Market, 2016 – 2026 (Kilo Tons)
      Fig.60 India Acetyl Market, 2016 – 2026 (USD Million)
      Fig.61 India Acetyl  Market, 2016 – 2026 (Kilo Tons)
      Fig.62 South  Korea Acetyl Market, 2016 – 2026 (USD Million)
      Fig.63 South  Korea Acetyl  Market, 2016 – 2026 (Kilo Tons)
      Fig.64 South-East Asia Acetyl Market, 2016 – 2026 (USD Million)
      Fig.65 South-East Asia Acetyl  Market, 2016 – 2026 (Kilo Tons)
      Fig.66 Rest of Asia Pacific Acetyl Market, 2016 – 2026 (USD Million)
      Fig.67 Rest of Asia Pacific Acetyl  Market, 2016 – 2026 (Kilo Tons)
      Fig.68 Latin America Acetyl Market, 2016 – 2026 (USD Million)
      Fig.69 Latin America Acetyl Market, 2016 – 2026 (Kilo Tons)
      Fig.70 Brazil Acetyl Market, 2016 – 2026 (USD Million)
      Fig.71 Brazil Acetyl  Market, 2016 – 2026 (Kilo Tons)
      Fig.72 Mexico Acetyl Market, 2016 – 2026 (USD Million)
      Fig.73 Mexico Acetyl  Market, 2016 – 2026 (Kilo Tons)
      Fig.74 Rest of Latin America Acetyl Market, 2016 – 2026 (USD Million)
      Fig.75 Rest of Latin America Acetyl  Market, 2016 – 2026 (Kilo Tons)
      Fig.76 The Middle-East and Africa Acetyl Market, 2016 – 2026 (USD Million)
      Fig.77 The Middle-East and Africa Acetyl Market, 2016 – 2026 (Kilo Tons)
      Fig.78 GCC Countries Acetyl Market, 2016 – 2026 (USD Million)
      Fig.79 GCC Countries Acetyl  Market, 2016 – 2026 (Kilo Tons)
      Fig.80 South Africa Acetyl Market, 2016 – 2026 (USD Million)
      Fig.81 South Africa Acetyl  Market, 2016 – 2026 (Kilo Tons)
      Fig.82 Rest of Middle-East Africa Acetyl Market, 2016 – 2026 (USD Million)
      Fig.83 Rest of Middle-East Africa Acetyl  Market, 2016 – 2026 (Kilo Tons)
      Fig.84 Global Acetyl Production and Consumption, 2016 – 2026 (Kilo Tons)
      Fig.85 North America Acetyl Production and Consumption, 2016 – 2026 (USD Million) (Kilo Tons)
      Fig.86 Europe Acetyl Production and Consumption, 2016 – 2026 (USD Million) (Kilo Tons)
      Fig.87 Asia Pacific Acetyl Production and Consumption, 2016 – 2026 (USD Million) (Kilo Tons)
      Fig.88 Latin America Acetyl Production and Consumption, 2016 – 2026 (USD Million) (Kilo Tons)
      Fig.89 The Middle-East and Africa Acetyl Production and Consumption, 2016 – 2026 (USD Million) (Kilo Tons)
      Fig.90 Competitor Market Share – Revenue
      Fig.91 Competitor Market Share – Volume
      Fig.92 Eastman Chemical Company Revenue and Growth Rate
      Fig.93 Eastman Chemical Company Market Share
      Fig.94 BP p.l.c. Revenue and Growth Rate
      Fig.95 BP p.l.c. Market Share
      Fig.96 The Dow Chemical Company Revenue and Growth Rate
      Fig.97 The Dow Chemical Company Market Share
      Fig.98 S.R.Drugs and Intermediates Pvt. Ltd. Revenue and Growth Rate
      Fig.99 S.R.Drugs and Intermediates Pvt. Ltd. Market Share
      Fig.100 Daicel Revenue and Growth Rate
      Fig.101 Daicel Market Share
      Fig.102 Celanese Corporation Revenue and Growth Rate
      Fig.103 Celanese Corporation Market Share
      Fig.104 Quzhou Weirong Pharmaceutical & Chemical Co., Ltd Revenue and Growth Rate
      Fig.105 Quzhou Weirong Pharmaceutical & Chemical Co., Ltd Market Share
      Fig.106 Fubore Revenue and Growth Rate
      Fig.107 Fubore Market Share
      Fig.108 Chiping Huahao Chemical Revenue and Growth Rate
      Fig.109 Chiping Huahao Chemical Market Share
      Fig.110 LyondellBasell Industries Holdings B.V. Revenue and Growth Rate
      Fig.111 LyondellBasell Industries Holdings B.V. Market Share
      Fig.112 Wacker Chemie AG Revenue and Growth Rate
      Fig.113 Wacker Chemie AG Market Share
      Fig.114 Market Dynamics
      Fig.115 Global Acetyl – Value Chain Analysis
      Fig.116 Key Mandates and Regulations
      Fig.117 Technology Roadmap and Timeline
      Fig.118 Market Attractiveness Analysis – By Product Type
      Fig.119 Market Attractiveness Analysis – By Industry Vertical
      Fig.120 Market Attractiveness Analysis – By Region
      Fig.121 Manufacturing Cost Structure of Acetyl
      Fig.122 Acetyl Industrial Chain Analysis
      Fig.123 Market Channels
      Fig.124 Marketing Channel Development Trend
      Fig.125 Growth in World Gross Product, 2008-2018
      

      List of Tables

      Table 1 Global Acetyl Market, 2019 & 2026 (USD Million)
      Table 2 Global Acetyl Market, by Product Type, 2016 – 2026 (USD Million)
      Table 3 Global Acetyl Market, by Product Type, 2016 – 2026 (Kilo Tons)
      Table 4 Global Acetyl Market, by Industry Vertical, 2016 – 2026 (USD Million)
      Table 5 Global Acetyl Market, by Industry Vertical, 2016 – 2026 (Kilo Tons)
      Table 6 Global Acetyl Market, by Region, 2016 – 2026 (USD Million)
      Table 7 Global Acetyl Market, by Region, 2016 – 2026 (Kilo Tons)
      Table 8 North America Acetyl Market, by Country, 2016 – 2026 (USD Million)
      Table 9 North America Acetyl Market, by Country, 2016 – 2026 (Kilo Tons)
      Table 10 North America Acetyl Market, by Product Type, 2016 – 2026 (USD Million)
      Table 11 North America Acetyl Market, by Product Type, 2016 – 2026 (Kilo Tons)
      Table 12 North America Acetyl Market, by Industry Vertical, 2016 – 2026 (USD Million)
      Table 13 North America Acetyl Market, by Industry Vertical, 2016 – 2026 (Kilo Tons)
      Table 14 Europe Acetyl Market, by Country, 2016 – 2026 (USD Million)
      Table 15 Europe Acetyl Market, by Country, 2016 – 2026 (Kilo Tons)
      Table 16 Europe Acetyl Market, by Product Type, 2016 – 2026 (USD Million)
      Table 17 Europe Acetyl Market, by Product Type, 2016 – 2026 (Kilo Tons)
      Table 18 Europe Acetyl Market, by Industry Vertical, 2016 – 2026 (USD Million)
      Table 19 Europe Acetyl Market, by Industry Vertical, 2016 – 2026 (Kilo Tons)
      Table 20 Asia Pacific Acetyl Market, by Country, 2016 – 2026 (USD Million)
      Table 21 Asia Pacific Acetyl Market, by Country, 2016 – 2026 (Kilo Tons)
      Table 22 Asia Pacific Acetyl Market, by Product Type, 2016 – 2026 (USD Million)
      Table 23 Asia Pacific Acetyl Market, by Product Type, 2016 – 2026 (Kilo Tons)
      Table 24 Asia Pacific Acetyl Market, by Industry Vertical, 2016 – 2026 (USD Million)
      Table 25 Asia Pacific Acetyl Market, by Industry Vertical, 2016 – 2026 (Kilo Tons)
      Table 26 Latin America Acetyl Market, by Country, 2016 – 2026 (USD Million)
      Table 27 Latin America Acetyl Market, by Country, 2016 – 2026 (Kilo Tons)
      Table 28 Latin America Acetyl Market, by Product Type, 2016 – 2026 (USD Million)
      Table 29 Latin America Acetyl Market, by Product Type, 2016 – 2026 (Kilo Tons)
      Table 30 Latin America Acetyl Market, by Industry Vertical, 2016 – 2026 (USD Million)
      Table 31 Latin America Acetyl Market, by Industry Vertical, 2016 – 2026 (Kilo Tons)
      Table 32 The Middle-East and Africa Acetyl Market, by Country, 2016 – 2026 (USD Million)
      Table 33 The Middle-East and Africa Acetyl Market, by Country, 2016 – 2026 (Kilo Tons)
      Table 34 The Middle-East and Africa Acetyl Market, by Product Type, 2016 – 2026 (USD Million)
      Table 35 The Middle-East and Africa Acetyl Market, by Product Type, 2016 – 2026 (Kilo Tons)
      Table 36 The Middle-East and Africa Acetyl Market, by Industry Vertical, 2016 – 2026 (USD Million)
      Table 37 The Middle-East and Africa Acetyl Market, by Industry Vertical, 2016 – 2026 (Kilo Tons)
      Table 38 North America Acetyl Production, Consumption, Export, Import, 2016 – 2019
      Table 39 Europe Acetyl Production, Consumption, Export, Import, 2016 – 2019
      Table 40 Asia Pacific Acetyl Production, Consumption, Export, Import, 2016 – 2019
      Table 41 Latin America Acetyl Production, Consumption, Export, Import, 2016 – 2019
      Table 42 The Middle-East and Africa Acetyl Production, Consumption, Export, Import, 2016 – 2019
      Table 43 Global Acetyl Market - Company Revenue Analysis, 2016 – 2019 (USD Million)
      Table 44 Global Acetyl Market - Company Revenue Share Analysis, 2016 – 2019 (%)
      Table 45 Global Acetyl Market - Company Volume Analysis, 2016 – 2019 (Kilo Tons)
      Table 46 Global Acetyl Market - Company Volume Share Analysis, 2016 – 2019 (%)
      Table 47 Acquisitions and Mergers
      Table 48 Market Drivers – Impact Analysis
      Table 49 Market Restraints
      Table 50 Market Opportunities
      Table 51 Production Base and Market Concentration Rate of Raw Material
      Table 52 Key Suppliers of Raw Materials
      Table 53 Raw Materials Sources of Acetyl Major Manufacturers
      Table 54 Major Buyers of Acetyl
      Table 55 Distributors/Traders of Acetyl by Region
      
  • Industry Major Market Players

    • Eastman Chemical Company
    • BP
    • The Dow Chemical Company
    • S.R. Drugs and Intermediates Pvt. Ltd.
    • Daicel
    • Celanese Corporation
    • Quzhou Weirong Pharmaceutical & Chemical Co. Ltd.
    • Fubore
    • Chiping Huahao Chemical
    • LyondellBasell Industries Holdings B.V.
    • Wacker Chemie AG