![]()
Search Market Research Report
Absorbable and Non-Absorbable Sutures Market Size, Share Global Analysis Report, 2020–2026

Absorbable and Non-Absorbable Sutures Market By Product Type (Automated Suturing Devices, and Sutures), By Surgery Type (Cardiovascular, Orthopedic, Gynecology, Opthalmology, General Surgery, and Others), By End Users (Hospitals, Ambulatory Centers, Clinics, and Others): Global Industry Outlook, Market Size, Business Intelligence, Consumer Preferences, Statistical Surveys, Comprehensive Analysis, Historical Developments, Current Trends, and Forecast 2020–2026
Industry Insights
[175 Pages Report] According to the report published by Facts Factors, the global absorbable and non-absorbable sutures market size was worth around USD 3.7 billion in 2019 and is predicted to grow to around USD 5 billion by 2026 with a compound annual growth rate (CAGR) of roughly 4.2% between 2020 and 2026. The report analyzes the global absorbable and non-absorbable sutures market drivers, restraints/challenges, and the effect they have on the demands during the projection period. In addition, the report explores emerging opportunities in the absorbable and non-absorbable sutures market. 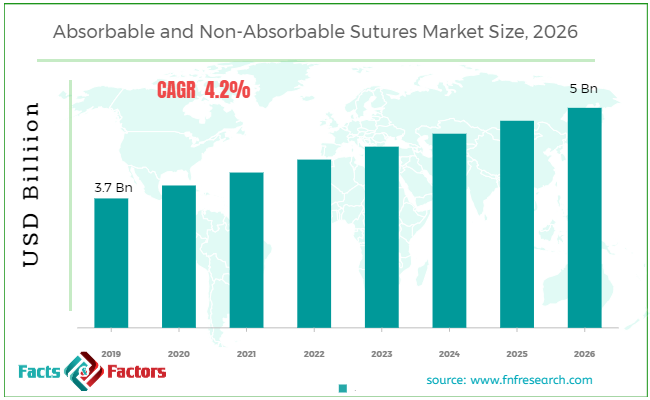
This specialized and expertise oriented industry research report scrutinizes the technical and commercial business outlook of the absorbable and non-absorbable sutures industry. The report analyzes and declares the historical and current trends analysis of the absorbable and non-absorbable sutures industry and subsequently recommends the projected trends anticipated to be observed in the absorbable and non-absorbable sutures market during the upcoming years.
The absorbable and non-absorbable sutures market report analyzes and notifies the industry statistics at the global as well as regional and country levels in order to acquire a thorough perspective of the entire absorbable and non-absorbable sutures market. The historical and past insights are provided for FY 2016 to FY 2019 whereas projected trends are delivered for FY 2020 to FY 2026. The quantitative and numerical data is represented in terms of value (USD Million) from FY 2016 – 2026.
The quantitative data is further underlined and reinforced by comprehensive qualitative data which comprises various across-the-board market dynamics. The rationales which directly or indirectly impact the absorbable and non-absorbable sutures market are exemplified through parameters such as growth drivers, restraints, challenges, and opportunities among other impacting factors.
Throughout our research report, we have encompassed all the proven models and tools of industry analysis and extensively illustrated all the key business strategies and business models adopted in the absorbable and non-absorbable sutures market. The report provides an all-inclusive and detailed competitive landscape prevalent in the absorbable and non-absorbable sutures market.
The report utilizes established industry analysis tools and models such as Porter’s Five Forces framework to analyze and recognize critical business strategies adopted by various stakeholders involved in the entire value chain of the absorbable and non-absorbable sutures market. The absorbable and non-absorbable sutures market report additionally employs SWOT analysis and PESTLE analysis models for further in-depth analysis.
The report study further includes an in-depth analysis of industry players' market shares and provides an overview of leading players' market position in the absorbable and non-absorbable sutures sector. Key strategic developments in the absorbable and non-absorbable Suturesmarketcompetitive landscape such as acquisitions & mergers, inaugurations of different products and services, partnerships & joint ventures, MoU agreements, VC & funding activities, R&D activities, and geographic expansion among other noteworthy activities by key players of the absorbable and non-absorbable sutures market are appropriately highlighted in the report.
 Key Insights from Primary Research
- The demand is expected to drive a surge in the prevalence of surgeries due to unhealthy lifestyles and an aging population.
- The companies are supposed to invest in R&D to innovate the better product. Innovation will open new opportunities for the absorbable and non-absorbable sutures thus are expected to propel the industry demand in the upcoming years.
- The automated suturing devices category of the product type holds the highest global market share for the absorbable and non-absorbable sutures market in 2019
- The hospitals have accounted for the highest market share in 2019 and expected to grow at a fast pace owing to higher R&D investments by healthcare providers.
Key Recommendations from Analysts
- In the coming years, flexible government restrictions on surgical procedures, aging baby boomers, and the launch of innovative products are likely to increase the number of surgical procedures which in turn increases the market demand.
- Asia Pacific region is anticipated to a larger share of the absorbable and non-absorbable sutures market in the upcoming years.
- Our analysts have identified the “automated suturing devices”, category as the leading investment pockets for the Asia Pacific absorbable and non-absorbable sutures market in terms of the product type respectively.
Due to factors such as a growing number of surgical procedures, technical advances in suture design as well as a favorable reimbursement scenario, the demand for absorbable and non-absorbable sutures is expected to rise exponentially in the forecast era. In addition, during the forecast period, developing economies and the rising geriatric population is projected to deliver substantial market growth opportunities.
The absorbable and non-absorbable sutures market research report delivers an acutevaluationand taxonomy of the absorbable and non-absorbable sutures industry by practically splitting the market on the basis of different product types, applications, and regions. Through the analysis of the historical and projected trends, all the segments and sub-segments were evaluated through the bottom-up approach, and different market sizes have been projected for FY 2020 to FY 2026.
Report Scope
Report Attribute |
Details |
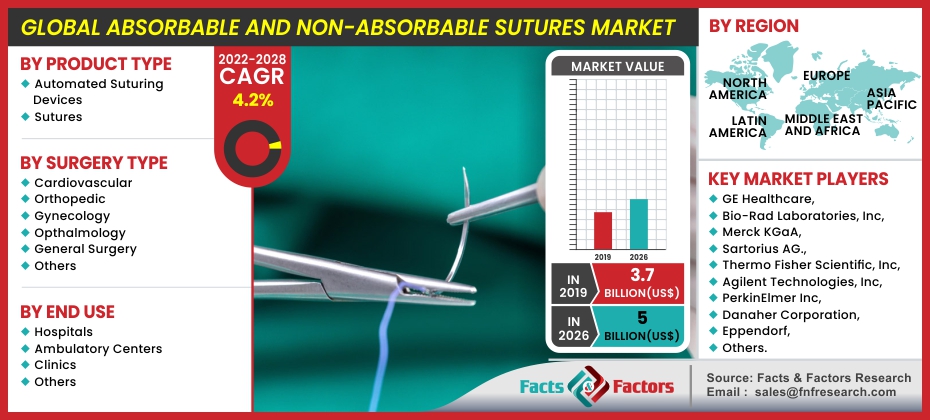
Market Size in 2019 |
USD 3.7 Billion |
Projected Market Size in 2026 |
USD 5 Billion |
CAGR Growth Rate |
4.2% CAGR |
Base Year |
2019 |
Forecast Years |
2020-2026 |
Key Market Players |
GE Healthcare, Bio-Rad Laboratories Inc, Merck KGaA, Sartorius AG., Thermo Fisher Scientific Inc, Agilent Technologies Inc, PerkinElmer Inc, Danaher Corporation, Eppendorf, Tecan Trading Ag |
Key Segment |
By Product, Surgery, End User, and Region |
Major Regions Covered |
North America, Europe, Asia Pacific, Latin America, and the Middle East & Africa |
Purchase Options |
Request customized purchase options to meet your research needs. Explore purchase options |
The regional segmentation of the absorbable and non-absorbable sutures industry includes the complete classification of all the major continents including North America, Latin America, Europe, Asia Pacific, and the Middle East & Africa. Further, country-wise data for the absorbable and non-absorbable sutures industry is provided for the leading economies of the world.
The worldwide market for absorbable and non-absorbable sutures is categorized into product type, surgery type, and end-users. Based on product type, the market has been classified into sutures and automated suturing devices. On the basis of surgery type, the market is divided into orthopedic, cardiovascular, Opthalmology, general surgery, gynecology, and others. In terms of end-user, the absorbable and non-absorbable sutures market is segmented into ambulatory centers, hospitals, and clinics, among others.
Some of the essential players operating in the absorbable and non-absorbable sutures market, but not restricted to include
- GE Healthcare
- Bio-Rad Laboratories Inc
- Merck KGaA
- Sartorius AG.
- Thermo Fisher Scientific Inc
- Agilent Technologies Inc
- PerkinElmer Inc
- Danaher Corporation
- Eppendorf
- Tecan Trading Ag
The taxonomy of the Absorbable and Non-Absorbable Sutures market by its scope and segmentation is as follows:
Product TypeAnalysis
- Automated Suturing Devices
- Sutures
Surgery TypeAnalysis
- Cardiovascular
- Orthopedic
- Gynecology
- Opthalmology
- General Surgery
- Others
End User Analysis
- Hospitals
- Ambulatory Centers
- Clinics
- Others
Regional Segmentation Analysis
- North America
- The U.S.
- Canada
- Europe
- Germany
- The UK
- France
- Spain
- Italy
- Rest of Europe
- Asia Pacific
- China
- Japan
- India
- South Korea
- Southeast Asia
- Rest of Asia Pacific
- Latin America
- Brazil
- Mexico
- Rest of Latin America
- Middle East & Africa
- GCC
- South Africa
- Rest of Middle East & Africa
Table of Content
Industry Major Market Players
- GE Healthcare
- Bio-Rad Laboratories Inc
- Merck KGaA
- Sartorius AG.
- Thermo Fisher Scientific Inc
- Agilent Technologies Inc
- PerkinElmer Inc
- Danaher Corporation
- Eppendorf
- Tecan Trading Ag


Copyright © 2025 - 2026, All Rights Reserved, Facts and Factors