Search Market Research Report

Discover Our Latest Reports
Discover Our Featured Reports
Discover Top Selling Reports

Abrasives Market Size, Share Global Analysis Report, 2020–2026

report img

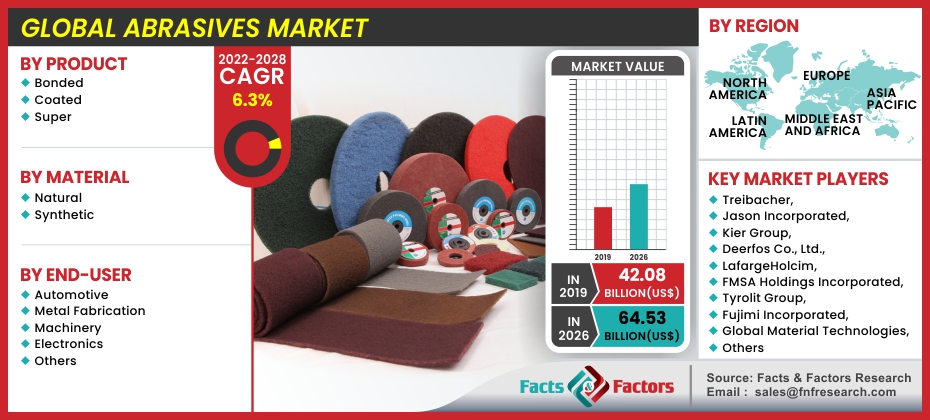
Abrasives Market By Product (Bonded, Coated, and Super), By Material (Natural, and Synthetic), By End-User (Automotive, Metal Fabrication, Machinery, Electronics, and Others): Global Industry Outlook, Market Size, Business Intelligence, Consumer Preferences, Statistical Surveys, Comprehensive Analysis, Historical Developments, Current Trends, and Forecast 2020–2026

Industry Insights

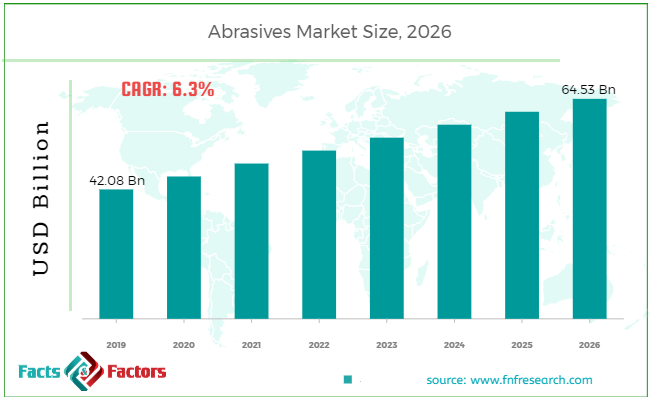
[175+ Pages Report] According to the report published by Facts Factors, the global abrasives market size was worth around USD 42.08 billion in 2019 and is predicted to grow to around USD 64.53 billion by 2026 with a compound annual growth rate (CAGR) of roughly 6.3% between 2020 and 2026. The report analyzes the global abrasives market drivers, restraints/challenges, and the effect they have on the demands during the projection period. In addition, the report explores emerging opportunities in the abrasives market.

Abrasives Market

To know more about this report | Request Free Sample Copy

This specialized and expertise oriented industry research report scrutinizes the technical and commercial business outlook of the abrasives market. The report analyzes and declares the historical and current trends analysis of the abrasives industry and subsequently recommends the projected trends anticipated to be observed in the abrasives market during the upcoming years.

The abrasives market report analyzes and notifies the industry statistics at the global as well as regional and country levels in order to acquire a thorough perspective of the entire abrasive market. The historical and past insights are provided for FY 2016 to FY 2019 whereas projected trends are delivered for FY 2020 to FY 2026. The quantitative and numerical data is represented in terms of value (USD Million) from FY 2016 – 2026.


logoKey Insights from Primary Research

  • The global abrasives market has accounted for USD 42.08 Billion in 2019, and it has been anticipated to reach USD 64.53 Billion by end of 2026. In terms of CAGR, the market is expected to expand at a CAGR rate of around 6.3% between 2020 and 2026.
  • Increasing demand from emerging economies is supposed to fuel market growth.
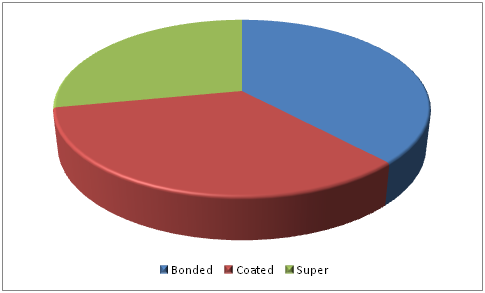
  • Based on product segmentation, the 'bonded' category was the leading category in 2019, accounting for the highest market share in the global market.
  • The “automotive” category, on the basis of the end-user industry, was the leading category accounting for the largest market share of over 35% in 2019.
  • Due to the Covid-19 pandemic, sluggish growth across the end-use domains is expected to hamper product demand to some extent.

logoKey Recommendations from Analysts

  • Increasing demand for the production of auto components in India, China, and Southeast Asian countries is expected to provide suppliers with growth opportunities for the end-user industries.
  • It is projected that large-scale automotive production and demand from various component manufacturing industries in China would drive the Asia Pacific market.
  • China'sAbrasion market is anticipated to rise at the highest rate between 2020 and 2026.
  • Our analysts have identified “bonded” and “automotive” categories as the leading investment pockets for the global abrasion market in terms of the type, and end-user segmentation respectively.

logoGlobal Abrasion Market Revenue Share – By Product

Abrasives Market

To know more about this report | Request Free Sample Copy


The quantitative data is further underlined and reinforced by comprehensive qualitative data which comprises various across-the-board market dynamics. The rationales which directly or indirectly impact the abrasives market are exemplified through parameters such as growth drivers, restraints, challenges, and opportunities among other impacting factors.

Global Abrasives Market

To know more about this report | Request Free Sample Copy

Throughout our research report, we have encompassed all the proven models and tools of industry analysis and extensively illustrated all the key business strategies and business models adopted in the Abrasives industry. The report provides an all-inclusive and detailed competitive landscape prevalent in the abrasives market.

The report utilizes established industry analysis tools and models such as Porter’s Five Forces framework to analyze and recognize critical business strategies adopted by various stakeholders involved in the entire value chain of the abrasives market. The Abrasivesmarket report additionally employs SWOT analysis and PESTLE analysis models for further in-depth analysis.

The report study further includes an in-depth analysis of industry players' market shares and provides an overview of leading players' market position in the abrasives sector. Key strategic developments in the abrasives market competitive landscape such as acquisitions & mergers, inaugurations of different products and services, partnerships & joint ventures, MoU agreements, VC & funding activities, R&D activities, and geographic expansion among other noteworthy activities by key players of the abrasives market are appropriately highlighted in the report.

It is projected that the rising demand for abrasive products in metallurgy applications will drive demand. Coated abrasives such as stones and sandpaper are used in metalworking for deburring, where grinding of metal items is performed. For the polishing of various finished goods in industries including manufacturing, automobile, and electronics, and hard minerals. On account of the growth of the end-use sectors, such as aerospace, automotive, housing, and steel production, abrasive demand in the U.S. is expected to increase. Due to rising raw material prices and rising taxes and fees on scrap, the use of recycled abrasives is expected to increase in the coming years.

The abrasives market research report delivers an acutevaluationand taxonomy of the Abrasivesindustry by practically splitting the market on the basis of different types, applications, industry verticals, and regions. Through the analysis of the historical and projected trends, all the segments and sub-segments were evaluated through the bottom-up approach, and different market sizes have been projected for FY 2020 to FY 2026.

logoReport Scope

Report Attribute

Details

Market Size in 2019

USD 42.08 Billion

Projected Market Size in 2026

USD 64.53 Billion

CAGR Growth Rate

6.3% CAGR

Base Year

2019

Forecast Years

2020-2026

Key Market Players

Treibacher, Jason Incorporated, Kier Group, Deerfos Co., Ltd., LafargeHolcim, FMSA Holdings Incorporated, Tyrolit Group, Fujimi Incorporated, Global Material Technologies, Cabot Microelectronics Corporation, Sia Abrasives, Winterthur, The Dow Chemical Company, Stanley Black & Decker Incorporated, and Almatis GmbH, and Others

Key Segment

By Product, Material, End-Use, and Region

Major Regions Covered

North America, Europe, Asia Pacific, Latin America, and the Middle East & Africa

Purchase Options

Request customized purchase options to meet your research needs.Explore purchase options

The regional segmentation of the Abrasivesindustry includes the complete classification of all the major continents including North America, Latin America, Europe, Asia Pacific, and Middle East & Africa. Further, country-wise data for the Abrasivesindustry are provided for the leading economies of the world.

The abrasives market is segmented based on product, material, end-user, and region. On the basis of product segmentation, the market is classified into bonded, coated, and super. In terms of material segmentation, the market is bifurcated into natural, and synthetic. Based on the end-user, the market has been categorized into automotive, metal fabrication, machinery, electronics, and others.

logoSome of the essential players operating in the abrasives market, but not restricted to include

  • Treibacher
  • Jason Incorporated
  • Kier Group
  • Deerfos Co. Ltd.
  • LafargeHolcim
  • FMSA Holdings Incorporated
  • Tyrolit Group
  • Fujimi Incorporated
  • Global Material Technologies
  • Cabot Microelectronics Corporation
  • Sia Abrasives
  • Winterthur
  • The Dow Chemical Company
  • Stanley Black & Decker Incorporated
  • Almatis GmbH 

The taxonomy of the abrasives market by its scope and segmentation is as follows:

logoBy Product Segmentation Analysis

  • Bonded
  • Coated
  • Super

logoBy Material Segmentation Analysis

  • Natural
  • Synthetic

logoBy End-User Segmentation Analysis

  • Automotive
  • Metal Fabrication
  • Machinery
  • Electronics
  • Others

logoBy Regional Segmentation Analysis

  • North America
    • The U.S.
    • Canada
  • Europe
    • Germany
    • The UK
    • France
    • Spain
    • Italy
    • Rest of Europe
  • Asia Pacific
    • China
    • Japan
    • India
    • South Korea
    • Southeast Asia
    • Rest of Asia Pacific
  • Latin America
    • Brazil
    • Mexico
    • Rest of Latin America
  • Middle East & Africa
    • GCC
    • South Africa
    • Rest of Middle East & Africa

Table of Content

  1. Chapter 1 Executive Summary
    1. 1.1. Introduction of Abrasives
    2. 1.2. Global Abrasives Market, 2019 & 2026 (USD Million)
    3. 1.3. Global Abrasives Market, 2016 – 2026 (USD Million) (Tons)
    4. 1.4. Global Abrasives Market Absolute Revenue Opportunity, 2016 – 2026 (USD Million)
    5. 1.5. Global Abrasives Market Incremental Revenue Opportunity, 2020 – 2026 (USD Million)
  2. Chapter 2 Abrasives Market – Product Analysis
    1. 2.1. Global Abrasives Market – Product Overview
    2. 2.2. Global Abrasives Market Share, by Product, 2019 & 2026 (USD Million)
    3. 2.3. Global Abrasives Market share, by Product, 2019 & 2026 (Tons)
    4. 2.4. Bonded
      1. 2.4.1. Global Bonded Abrasives Market, 2016 – 2026 (USD Million)
      2. 2.4.2. Global Bonded Abrasives Market, 2016 – 2026 (Tons)
    5. 2.5. Coated
      1. 2.5.1. Global Coated Abrasives Market, 2016 – 2026 (USD Million)
      2. 2.5.2. Global Coated Abrasives Market, 2016 – 2026 (Tons)
    6. 2.6. Super
      1. 2.6.1. Global Super Abrasives Market, 2016 – 2026 (USD Million)
      2. 2.6.2. Global Super Abrasives Market, 2016 – 2026 (Tons)
  3. Chapter 3 Abrasives Market – Material Analysis
    1. 3.1. Global Abrasives Market – Material Overview
    2. 3.2. Global Abrasives Market Share, by Material, 2019 & 2026 (USD Million)
    3. 3.3. Global Abrasives Market share, by Material, 2019 & 2026 (Tons)
    4. 3.4. Natural
      1. 3.4.1. Global Natural Abrasives Market, 2016 – 2026 (USD Million)
      2. 3.4.2. Global Natural Abrasives Market, 2016 – 2026 (Tons)
    5. 3.5. Synthetic
      1. 3.5.1. Global Synthetic Abrasives Market, 2016 – 2026 (USD Million)
      2. 3.5.2. Global Synthetic Abrasives Market, 2016 – 2026 (Tons)
  4. Chapter 4 Abrasives Market – End-User Analysis
    1. 4.1. Global Abrasives Market – End-User Overview
    2. 4.2. Global Abrasives Market Share, by End-User, 2019 & 2026 (USD Million)
    3. 4.3. Global Abrasives Market share, by End-User, 2019 & 2026 (Tons)
    4. 4.4. Automotive
      1. 4.4.1. Global Automotive Abrasives Market, 2016 – 2026 (USD Million)
      2. 4.4.2. Global Automotive Abrasives Market, 2016 – 2026 (Tons)
    5. 4.5. Metal Fabrication
      1. 4.5.1. Global Metal Fabrication Abrasives Market, 2016 – 2026 (USD Million)
      2. 4.5.2. Global Metal Fabrication Abrasives Market, 2016 – 2026 (Tons)
    6. 4.6. Machinery
      1. 4.6.1. Global Machinery Abrasives Market, 2016 – 2026 (USD Million)
      2. 4.6.2. Global Machinery Abrasives Market, 2016 – 2026 (Tons)
    7. 4.7. Others
      1. 4.7.1. Global Others Abrasives Market, 2016 – 2026 (USD Million)
      2. 4.7.2. Global Others Abrasives Market, 2016 – 2026 (Tons)
  5. Chapter 5 Abrasives Market – Regional Analysis
    1. 5.1. Global Abrasives Market Regional Overview
    2. 5.2. Global Abrasives Market Share, by Region, 2019 & 2026 (USD Million)
    3. 5.3. Global Abrasives Market Share, by Region, 2019 & 2026 (Tons)
    4. 5.4. North America
      1. 5.4.1. North America Abrasives Market, 2016 – 2026 (USD Million)
        1. 5.4.1.1. North America Abrasives Market, by Country, 2016 – 2026 (USD Million)
      2. 5.4.2. North America Market, 2016 – 2026 (Tons)
        1. 5.4.2.1. North America Abrasives Market, by Country, 2016 – 2026 (Tons)
      3. 5.4.3. North America Abrasives Market, by Product, 2016 – 2026
        1. 5.4.3.1. North America Abrasives Market, by Product, 2016 – 2026 (USD Million)
        2. 5.4.3.2. North America Abrasives Market, by Product, 2016 – 2026 (Tons)
      4. 5.4.4. North America Abrasives Market, by Material, 2016 – 2026
        1. 5.4.4.1. North America Abrasives Market, by Material, 2016 – 2026 (USD Million)
        2. 5.4.4.2. North America Abrasives Market, by Material, 2016 – 2026 (Tons)
      5. 5.4.5. North America Abrasives Market, by End-User, 2016 – 2026
        1. 5.4.5.1. North America Abrasives Market, by End-User, 2016 – 2026 (USD Million)
        2. 5.4.5.2. North America Abrasives Market, by End-User, 2016 – 2026 (Tons)
      6. 5.4.6. U.S.
        1. 5.4.6.1. U.S. Abrasives Market, 2016 – 2026 (USD Million)
        2. 5.4.6.2. U.S. Abrasives Market, 2016 – 2026 (Tons)
      7. 5.4.7. Canada
        1. 5.4.7.1. Canada Abrasives Market, 2016 – 2026 (USD Million)
        2. 5.4.7.2. Canada Abrasives Market, 2016 – 2026 (Tons)
    5. 5.5. Europe
      1. 5.5.1. Europe Abrasives Market, 2016 – 2026 (USD Million)
        1. 5.5.1.1. Europe Abrasives Market, by Country, 2016 – 2026 (USD Million)
      2. 5.5.2. Europe Market, 2016 – 2026 (Tons)
        1. 5.5.2.1. Europe Abrasives Market, by Country, 2016 – 2026 (Tons)
      3. 5.5.3. Europe Abrasives Market, by Product, 2016 – 2026
        1. 5.5.3.1. Europe Abrasives Market, by Product, 2016 – 2026 (USD Million)
        2. 5.5.3.2. Europe Abrasives Market, by Product, 2016 – 2026 (Tons)
      4. 5.5.4. Europe Abrasives Market, by Material, 2016 – 2026
        1. 5.5.4.1. Europe Abrasives Market, by Material, 2016 – 2026 (USD Million)
        2. 5.5.4.2. Europe Abrasives Market, by Material, 2016 – 2026 (Tons)
      5. 5.5.5. Europe Abrasives Market, by End-User, 2016 – 2026
        1. 5.5.5.1. Europe Abrasives Market, by End-User, 2016 – 2026 (USD Million)
        2. 5.5.5.2. Europe Abrasives Market, by End-User, 2016 – 2026 (Tons)
      6. 5.5.6. Germany
        1. 5.5.6.1. Germany Abrasives Market, 2016 – 2026 (USD Million)
        2. 5.5.6.2. Germany Abrasives Market, 2016 – 2026 (Tons)
      7. 5.5.7. France
        1. 5.5.7.1. France Abrasives Market, 2016 – 2026 (USD Million)
        2. 5.5.7.2. France Abrasives Market, 2016 – 2026 (Tons)
      8. 5.5.8. U.K.
        1. 5.5.8.1. U.K. Abrasives Market, 2016 – 2026 (USD Million)
        2. 5.5.8.2. U.K. Abrasives Market, 2016 – 2026 (Tons)
      9. 5.5.9. Italy
        1. 5.5.9.1. Italy Abrasives Market, 2016 – 2026 (USD Million)
        2. 5.5.9.2. Italy Abrasives Market, 2016 – 2026 (Tons)
      10. 5.5.10. Spain
        1. 5.5.10.1. Spain Abrasives Market, 2016 – 2026 (USD Million)
        2. 5.5.10.2. Spain Abrasives Market, 2016 – 2026 (Tons)
      11. 5.5.11. Rest of Europe
        1. 5.5.11.1. Rest of Europe Abrasives Market, 2016 – 2026 (USD Million)
        2. 5.5.11.2. Rest of Europe Abrasives Market, 2016 – 2026 (Tons)
    6. 5.6. Asia Pacific
      1. 5.6.1. Asia Pacific Abrasives Market, 2016 – 2026 (USD Million)
        1. 5.6.1.1. Asia Pacific Abrasives Market, by Country, 2016 – 2026 (USD Million)
      2. 5.6.2. Asia Pacific Market, 2016 – 2026 (Tons)
        1. 5.6.2.1. Asia Pacific Abrasives Market, by Country, 2016 – 2026 (Tons)
      3. 5.6.3. Asia Pacific Abrasives Market, by Product, 2016 – 2026
        1. 5.6.3.1. Asia Pacific Abrasives Market, by Product, 2016 – 2026 (USD Million)
        2. 5.6.3.2. Asia Pacific Abrasives Market, by Product, 2016 – 2026 (Tons)
      4. 5.6.4. Asia Pacific Abrasives Market, by Material, 2016 – 2026
        1. 5.6.4.1. Asia Pacific Abrasives Market, by Material, 2016 – 2026 (USD Million)
        2. 5.6.4.2. Asia Pacific Abrasives Market, by Material, 2016 – 2026 (Tons)
      5. 5.6.5. Asia Pacific Abrasives Market, by End-User, 2016 – 2026
        1. 5.6.5.1. Asia Pacific Abrasives Market, by End-User, 2016 – 2026 (USD Million)
        2. 5.6.5.2. Asia Pacific Abrasives Market, by End-User, 2016 – 2026 (Tons)
      6. 5.6.6. China
        1. 5.6.6.1. China Abrasives Market, 2016 – 2026 (USD Million)
        2. 5.6.6.2. China Abrasives Market, 2016 – 2026 (Tons)
      7. 5.6.7. Japan
        1. 5.6.7.1. Japan Abrasives Market, 2016 – 2026 (USD Million)
        2. 5.6.7.2. Japan Abrasives Market, 2016 – 2026 (Tons)
      8. 5.6.8. India
        1. 5.6.8.1. India Abrasives Market, 2016 – 2026 (USD Million)
        2. 5.6.8.2. India Abrasives Market, 2016 – 2026 (Tons)
      9. 5.6.9. South Korea
        1. 5.6.9.1. South Korea Abrasives Market, 2016 – 2026 (USD Million)
        2. 5.6.9.2. South Korea Abrasives Market, 2016 – 2026 (Tons)
      10. 5.6.10. South-East Asia
        1. 5.6.10.1. South-East Asia Abrasives Market, 2016 – 2026 (USD Million)
        2. 5.6.10.2. South-East Asia Abrasives Market, 2016 – 2026 (Tons)
      11. 5.6.11. Rest of Asia Pacific
        1. 5.6.11.1. Rest of Asia Pacific Abrasives Market, 2016 – 2026 (USD Million)
        2. 5.6.11.2. Rest of Asia Pacific Abrasives Market, 2016 – 2026 (Tons)
    7. 5.7. Latin America
      1. 5.7.1. Latin America Abrasives Market, 2016 – 2026 (USD Million)
        1. 5.7.1.1. Latin America Abrasives Market, by Country, 2016 – 2026 (USD Million)
      2. 5.7.2. Latin America Market, 2016 – 2026 (Tons)
        1. 5.7.2.1. Latin America Abrasives Market, by Country, 2016 – 2026 (Tons)
      3. 5.7.3. Latin America Abrasives Market, by Product, 2016 – 2026
        1. 5.7.3.1. Latin America Abrasives Market, by Product, 2016 – 2026 (USD Million)
        2. 5.7.3.2. Latin America Abrasives Market, by Product, 2016 – 2026 (Tons)
      4. 5.7.4. Latin America Abrasives Market, by Material, 2016 – 2026
        1. 5.7.4.1. Latin America Abrasives Market, by Material, 2016 – 2026 (USD Million)
        2. 5.7.4.2. Latin America Abrasives Market, by Material, 2016 – 2026 (Tons)
      5. 5.7.5. Latin America Abrasives Market, by End-User, 2016 – 2026
        1. 5.7.5.1. Latin America Abrasives Market, by End-User, 2016 – 2026 (USD Million)
        2. 5.7.5.2. Latin America Abrasives Market, by End-User, 2016 – 2026 (Tons)
      6. 5.7.6. Brazil
        1. 5.7.6.1. Brazil Abrasives Market, 2016 – 2026 (USD Million)
        2. 5.7.6.2. Brazil Abrasives Market, 2016 – 2026 (Tons)
      7. 5.7.7. Mexico
        1. 5.7.7.1. Mexico Abrasives Market, 2016 – 2026 (USD Million)
        2. 5.7.7.2. Mexico Abrasives Market, 2016 – 2026 (Tons)
      8. 5.7.8. Rest of Latin America
        1. 5.7.8.1. Rest of Latin America Abrasives Market, 2016 – 2026 (USD Million)
        2. 5.7.8.2. Rest of Latin America Abrasives Market, 2016 – 2026 (Tons)
    8. 5.8. The Middle-East and Africa
      1. 5.8.1. The Middle-East and Africa Abrasives Market, 2016 – 2026 (USD Million)
        1. 5.8.1.1. The Middle-East and Africa Abrasives Market, by Country, 2016 – 2026 (USD Million)
      2. 5.8.2. The Middle-East and Africa Market, 2016 – 2026 (Tons)
        1. 5.8.2.1. The Middle-East and Africa Abrasives Market, by Country, 2016 – 2026 (Tons)
      3. 5.8.3. The Middle-East and Africa Abrasives Market, by Product, 2016 – 2026
        1. 5.8.3.1. The Middle-East and Africa Abrasives Market, by Product, 2016 – 2026 (USD Million)
        2. 5.8.3.2. The Middle-East and Africa Abrasives Market, by Product, 2016 – 2026 (Tons)
      4. 5.8.4. The Middle-East and Africa Abrasives Market, by Material, 2016 – 2026
        1. 5.8.4.1. The Middle-East and Africa Abrasives Market, by Material, 2016 – 2026 (USD Million)
        2. 5.8.4.2. The Middle-East and Africa Abrasives Market, by Material, 2016 – 2026 (Tons)
      5. 5.8.5. The Middle-East and Africa Abrasives Market, by End-User, 2016 – 2026
        1. 5.8.5.1. The Middle-East and Africa Abrasives Market, by End-User, 2016 – 2026 (USD Million)
        2. 5.8.5.2. The Middle-East and Africa Abrasives Market, by End-User, 2016 – 2026 (Tons)
      6. 5.8.6. GCC Countries
        1. 5.8.6.1. GCC Countries Abrasives Market, 2016 – 2026 (USD Million)
        2. 5.8.6.2. GCC Countries Abrasives Market, 2016 – 2026 (Tons)
      7. 5.8.7. South Africa
        1. 5.8.7.1. South Africa Abrasives Market, 2016 – 2026 (USD Million)
        2. 5.8.7.2. South Africa Abrasives Market, 2016 – 2026 (Tons)
      8. 5.8.8. Rest of Middle-East Africa
        1. 5.8.8.1. Rest of Middle-East Africa Abrasives Market, 2016 – 2026 (USD Million)
        2. 5.8.8.2. Rest of Middle-East Africa Abrasives Market, 2016 – 2026 (Tons)
  6. Chapter 6 Abrasives Production, Consumption, Export, Import by Regions
    1. 6.1. Global Abrasives Production and Consumption, 2016 – 2026 (Tons)
    2. 6.2. Global Import and Export Analysis, by Region
  7. Chapter 7 Abrasives Market – Competitive Landscape
    1. 7.1. Competitor Market Share – Revenue
    2. 7.2. Market Concentration Rate Analysis, Top 3 and Top 5 Players
    3. 7.3. Competitor Market Share – Volume
    4. 7.4. Strategic Developments
      1. 7.4.1. Acquisitions and Mergers
      2. 7.4.2. New Products
      3. 7.4.3. Research & Development Activities
  8. Chapter 8 Company Profiles
    1. 8.1. Treibacher
      1. 8.1.1. Company Overview
      2. 8.1.2. Product/Service Portfolio
      3. 8.1.3. Treibacher Sales, Revenue, Price, and Gross Margin
      4. 8.1.4. Treibacher Revenue and Growth Rate
      5. 8.1.5. Treibacher Market Share
      6. 8.1.6. Recent Initiatives, Funding/VC Activities, and Technological Innovations
    2. 8.2. Jason Incorporated
      1. 8.2.1. Company Overview
      2. 8.2.2. Product/Service Portfolio
      3. 8.2.3. Jason Incorporated Sales, Revenue, Price, and Gross Margin
      4. 8.2.4. Jason Incorporated Revenue and Growth Rate
      5. 8.2.5. Jason Incorporated Market Share
      6. 8.2.6. Recent Initiatives, Funding/VC Activities, and Technological Innovations
    3. 8.3. Kier Group, Deerfos Co., Ltd.
      1. 8.3.1. Company Overview
      2. 8.3.2. Product/Service Portfolio
      3. 8.3.3. Kier Group, Deerfos Co., Ltd. Sales, Revenue, Price, and Gross Margin
      4. 8.3.4. Kier Group, Deerfos Co., Ltd. Revenue and Growth Rate
      5. 8.3.5. Kier Group, Deerfos Co., Ltd. Market Share
      6. 8.3.6. Recent Initiatives, Funding/VC Activities, and Technological Innovations
    4. 8.4. LafargeHolcim
      1. 8.4.1. Company Overview
      2. 8.4.2. Product/Service Portfolio
      3. 8.4.3. LafargeHolcim Sales, Revenue, Price, and Gross Margin
      4. 8.4.4. LafargeHolcim Revenue and Growth Rate
      5. 8.4.5. LafargeHolcim Market Share
      6. 8.4.6. Recent Initiatives, Funding/VC Activities, and Technological Innovations
    5. 8.5. FMSA Holdings Incorporated
      1. 8.5.1. Company Overview
      2. 8.5.2. Product/Service Portfolio
      3. 8.5.3. FMSA Holdings Incorporated Sales, Revenue, Price, and Gross Margin
      4. 8.5.4. FMSA Holdings Incorporated Revenue and Growth Rate
      5. 8.5.5. FMSA Holdings Incorporated Market Share
      6. 8.5.6. Recent Initiatives, Funding/VC Activities, and Technological Innovations
    6. 8.6. Tyrolit Group
      1. 8.6.1. Company Overview
      2. 8.6.2. Product/Service Portfolio
      3. 8.6.3. Tyrolit Group Sales, Revenue, Price, and Gross Margin
      4. 8.6.4. Tyrolit Group Revenue and Growth Rate
      5. 8.6.5. Tyrolit Group Market Share
      6. 8.6.6. Recent Initiatives, Funding/VC Activities, and Technological Innovations
    7. 8.7. Fujimi Incorporated
      1. 8.7.1. Company Overview
      2. 8.7.2. Product/Service Portfolio
      3. 8.7.3. Fujimi Incorporated Sales, Revenue, Price, and Gross Margin
      4. 8.7.4. Fujimi Incorporated Revenue and Growth Rate
      5. 8.7.5. Fujimi Incorporated Market Share
      6. 8.7.6. Recent Initiatives, Funding/VC Activities, and Technological Innovations
    8. 8.8. Global Material Technologies
      1. 8.8.1. Company Overview
      2. 8.8.2. Product/Service Portfolio
      3. 8.8.3. Global Material Technologies Sales, Revenue, Price, and Gross Margin
      4. 8.8.4. Global Material Technologies Revenue and Growth Rate
      5. 8.8.5. Global Material Technologies Market Share
      6. 8.8.6. Recent Initiatives, Funding/VC Activities, and Technological Innovations
    9. 8.9. Cabot Microelectronics Corporation
      1. 8.9.1. Company Overview
      2. 8.9.2. Product/Service Portfolio
      3. 8.9.3. Cabot Microelectronics Corporation Sales, Revenue, Price, and Gross Margin
      4. 8.9.4. Cabot Microelectronics Corporation Revenue and Growth Rate
      5. 8.9.5. Cabot Microelectronics Corporation Market Share
      6. 8.9.6. Recent Initiatives, Funding/VC Activities, and Technological Innovations
    10. 8.10. Sia Abrasives
      1. 8.10.1. Company Overview
      2. 8.10.2. Product/Service Portfolio
      3. 8.10.3. Sia Abrasives Sales, Revenue, Price, and Gross Margin
      4. 8.10.4. Sia Abrasives Revenue and Growth Rate
      5. 8.10.5. Sia Abrasives Market Share
      6. 8.10.6. Recent Initiatives, Funding/VC Activities, and Technological Innovations
    11. 8.11. Winterthur
      1. 8.11.1. Company Overview
      2. 8.11.2. Product/Service Portfolio
      3. 8.11.3. Winterthur Sales, Revenue, Price, and Gross Margin
      4. 8.11.4. Winterthur Revenue and Growth Rate
      5. 8.11.5. Winterthur Market Share
      6. 8.11.6. Recent Initiatives, Funding/VC Activities, and Technological Innovations
    12. 8.12. The Dow Chemical Company
      1. 8.12.1. Company Overview
      2. 8.12.2. Product/Service Portfolio
      3. 8.12.3. The Dow Chemical Company Sales, Revenue, Price, and Gross Margin
      4. 8.12.4. The Dow Chemical Company Revenue and Growth Rate
      5. 8.12.5. The Dow Chemical Company Market Share
      6. 8.12.6. Recent Initiatives, Funding/VC Activities, and Technological Innovations
    13. 8.13. Stanley Black & Decker Incorporated
      1. 8.13.1. Company Overview
      2. 8.13.2. Product/Service Portfolio
      3. 8.13.3. Stanley Black & Decker Incorporated Sales, Revenue, Price, and Gross Margin
      4. 8.13.4. Stanley Black & Decker Incorporated Revenue and Growth Rate
      5. 8.13.5. Stanley Black & Decker Incorporated Market Share
      6. 8.13.6. Recent Initiatives, Funding/VC Activities, and Technological Innovations
    14. 8.14. Almatis GmbH
      1. 8.14.1. Company Overview
      2. 8.14.2. Product/Service Portfolio
      3. 8.14.3. Almatis GmbH Sales, Revenue, Price, and Gross Margin
      4. 8.14.4. Almatis GmbH Revenue and Growth Rate
      5. 8.14.5. Almatis GmbH Market Share
      6. 8.14.6. Recent Initiatives, Funding/VC Activities, and Technological Innovations
  9. Chapter 9 Abrasives — Industry Analysis
    1. 9.1. Introduction and Taxonomy
    2. 9.2. Abrasives Market – Key Trends
      1. 9.2.1. Market Drivers
      2. 9.2.2. Market Restraints
      3. 9.2.3. Market Opportunities
    3. 9.3. Value Chain Analysis
    4. 9.4. Key Mandates and Regulations
    5. 9.5. Technology Roadmap and Timeline
    6. 9.6. Abrasives Market – Attractiveness Analysis
      1. 9.6.1. By Product
      2. 9.6.2. By Material
      3. 9.6.3. By End-User
      4. 9.6.4. By Region
  10. Chapter 10 Raw Material Analysis
    1. 10.1. Abrasives Key Raw Material Analysis
      1. 10.1.1. Key Raw Materials
      2. 10.1.2. Price Trend of Key Raw Materials
    2. 10.2. Key Suppliers of Raw Materials
    3. 10.3. Proportion of Manufacturing Cost Structure
      1. 10.3.1. Raw Materials Cost
      2. 10.3.2. Labor Cost
      3. 10.3.3. Manufacturing Expenses
      4. 10.3.4. Miscellaneous Expenses
    4. 10.4. Manufacturing Cost Analysis of Abrasives
  11. Chapter 11 Industrial Chain, Sourcing Strategy, and Downstream Buyers
    1. 11.1. Abrasives Industrial Chain Analysis
    2. 11.2. Upstream Raw Materials Sourcing
      1. 11.2.1. Risk Mitigation:
      2. 11.2.2. Supplier Relationships:
      3. 11.2.3. Business Processes:
      4. 11.2.4. Securing the Product:
    3. 11.3. Raw Materials Sources of Abrasives Major Manufacturers
    4. 11.4. Downstream Buyers
    5. 11.5. Distributors/Traders List
  12. Chapter 12 Marketing Strategy Analysis, Distributors
    1. 12.1. Marketing Channel
    2. 12.2. Direct Marketing
    3. 12.3. Indirect Marketing
    4. 12.4. Marketing Channel Development Trends
    5. 12.5. Economic/Political Environmental Change
  13. Chapter 13 Report Conclusion & Key Insights
    1. 13.1. Key Insights from Primary Interviews & Surveys Respondents
    2. 13.2. Key Takeaways from Analysts, Consultants, and Industry Leaders
  14. Chapter 14 Research Approach & Methodology
    1. 14.1. Report Description
    2. 14.2. Research Scope
    3. 14.3. Research Methodology
      1. 14.3.1. Secondary Research
      2. 14.3.2. Primary Research
      3. 14.3.3. Statistical Models
        1. 14.3.3.1. Company Share Analysis Model
        2. 14.3.3.2. Revenue Based Modeling
      4. 14.3.4. Research Limitations

  • List of Figures

    Fig.1 Product Picture of Abrasives
    Fig.2 Global Abrasives Market, 2016 – 2026 (USD Million)
    Fig.3 Global Abrasives Market, 2016 – 2026 (Tons)
    Fig.4 Global Abrasives Market Absolute Revenue Opportunity, 2016 – 2026 (USD Million)
    Fig.5 Global Abrasives Market Incremental Revenue Opportunity, 2020 – 2026 (USD Million)
    Fig.6 Global Abrasives Market Share, by Product, 2019 & 2026 (USD Million)
    Fig.7 Global Abrasives Market Share, by Product, 2019 & 2026 (Tons)
    Fig.8 Global Bonded Abrasives Market, 2016 – 2026 (USD Million)
    Fig.9 Global Bonded Abrasives Market, 2016 – 2026 (Tons)
    Fig.10 Global Coated Abrasives Market, 2016 – 2026 (USD Million)
    Fig.11 Global Coated Abrasives Market, 2016 – 2026 (Tons)
    Fig.12 Global Super Abrasives Market, 2016 – 2026 (USD Million)
    Fig.13 Global Super Abrasives Market, 2016 – 2026 (Tons)
    Fig.14 Global Abrasives Market Share, by Material, 2019 & 2026 (USD Million)
    Fig.15 Global Abrasives Market Share, by Material, 2019 & 2026 (Tons)
    Fig.16 Global Natural Abrasives Market, 2016 – 2026 (USD Million)
    Fig.17 Global Natural Abrasives Market, 2016 – 2026 (Tons)
    Fig.18 Global Synthetic Abrasives Market, 2016 – 2026 (USD Million)
    Fig.19 Global Synthetic Abrasives Market, 2016 – 2026 (Tons)
    Fig.20 Global Abrasives Market Share, by End-User, 2019 & 2026 (USD Million)
    Fig.21 Global Abrasives Market Share, by End-User, 2019 & 2026 (Tons)
    Fig.22 Global Automotive Abrasives Market, 2016 – 2026 (USD Million)
    Fig.23 Global Automotive Abrasives Market, 2016 – 2026 (Tons)
    Fig.24 Global Metal Fabrication Abrasives Market, 2016 – 2026 (USD Million)
    Fig.25 Global Metal Fabrication Abrasives Market, 2016 – 2026 (Tons)
    Fig.26 Global Machinery Abrasives Market, 2016 – 2026 (USD Million)
    Fig.27 Global Machinery Abrasives Market, 2016 – 2026 (Tons)
    Fig.28 Global Others Abrasives Market, 2016 – 2026 (USD Million)
    Fig.29 Global Others Abrasives Market, 2016 – 2026 (Tons)
    Fig.30 Global Abrasives Market Share, by Region, 2019 & 2026 (USD Million)
    Fig.31 Global Abrasives Market Share, by Region, 2019 & 2026 (Tons)
    Fig.32 North America Abrasives Market, 2016 – 2026 (USD Million)
    Fig.33 North America Abrasives Market, 2016 – 2026 (Tons)
    Fig.34 U.S. Abrasives Market, 2016 – 2026 (USD Million)
    Fig.35 U.S. Abrasives  Market, 2016 – 2026 (Tons)
    Fig.36 Canada Abrasives Market, 2016 – 2026 (USD Million)
    Fig.37 Canada Abrasives  Market, 2016 – 2026 (Tons)
    Fig.38 Europe Abrasives Market, 2016 – 2026 (USD Million)
    Fig.39 Europe Abrasives Market, 2016 – 2026 (Tons)
    Fig.40 Germany Abrasives Market, 2016 – 2026 (USD Million)
    Fig.41 Germany Abrasives  Market, 2016 – 2026 (Tons)
    Fig.42 France Abrasives Market, 2016 – 2026 (USD Million)
    Fig.43 France Abrasives  Market, 2016 – 2026 (Tons)
    Fig.44 U.K. Abrasives Market, 2016 – 2026 (USD Million)
    Fig.45 U.K. Abrasives  Market, 2016 – 2026 (Tons)
    Fig.46 Italy Abrasives Market, 2016 – 2026 (USD Million)
    Fig.47 Italy Abrasives  Market, 2016 – 2026 (Tons)
    Fig.48 Spain Abrasives Market, 2016 – 2026 (USD Million)
    Fig.49 Spain Abrasives  Market, 2016 – 2026 (Tons)
    Fig.50 Rest of Europe Abrasives Market, 2016 – 2026 (USD Million)
    Fig.51 Rest of Europe Abrasives  Market, 2016 – 2026 (Tons)
    Fig.52 Asia Pacific Abrasives Market, 2016 – 2026 (USD Million)
    Fig.53 Asia Pacific Abrasives Market, 2016 – 2026 (Tons)
    Fig.54 China Abrasives Market, 2016 – 2026 (USD Million)
    Fig.55 China Abrasives  Market, 2016 – 2026 (Tons)
    Fig.56 Japan Abrasives Market, 2016 – 2026 (USD Million)
    Fig.57 Japan Abrasives  Market, 2016 – 2026 (Tons)
    Fig.58 India Abrasives Market, 2016 – 2026 (USD Million)
    Fig.59 India Abrasives  Market, 2016 – 2026 (Tons)
    Fig.60 South  Korea Abrasives Market, 2016 – 2026 (USD Million)
    Fig.61 South  Korea Abrasives  Market, 2016 – 2026 (Tons)
    Fig.62 South-East Asia Abrasives Market, 2016 – 2026 (USD Million)
    Fig.63 South-East Asia Abrasives  Market, 2016 – 2026 (Tons)
    Fig.64 Rest of Asia Pacific Abrasives Market, 2016 – 2026 (USD Million)
    Fig.65 Rest of Asia Pacific Abrasives  Market, 2016 – 2026 (Tons)
    Fig.66 Latin America Abrasives Market, 2016 – 2026 (USD Million)
    Fig.67 Latin America Abrasives Market, 2016 – 2026 (Tons)
    Fig.68 Brazil Abrasives Market, 2016 – 2026 (USD Million)
    Fig.69 Brazil Abrasives  Market, 2016 – 2026 (Tons)
    Fig.70 Mexico Abrasives Market, 2016 – 2026 (USD Million)
    Fig.71 Mexico Abrasives  Market, 2016 – 2026 (Tons)
    Fig.72 Rest of Latin America Abrasives Market, 2016 – 2026 (USD Million)
    Fig.73 Rest of Latin America Abrasives  Market, 2016 – 2026 (Tons)
    Fig.74 The Middle-East and Africa Abrasives Market, 2016 – 2026 (USD Million)
    Fig.75 The Middle-East and Africa Abrasives Market, 2016 – 2026 (Tons)
    Fig.76 GCC Countries Abrasives Market, 2016 – 2026 (USD Million)
    Fig.77 GCC Countries Abrasives  Market, 2016 – 2026 (Tons)
    Fig.78 South Africa Abrasives Market, 2016 – 2026 (USD Million)
    Fig.79 South Africa Abrasives  Market, 2016 – 2026 (Tons)
    Fig.80 Rest of Middle-East Africa Abrasives Market, 2016 – 2026 (USD Million)
    Fig.81 Rest of Middle-East Africa Abrasives  Market, 2016 – 2026 (Tons)
    Fig.82 Global Abrasives Production and Consumption, 2016 – 2026 (Tons)
    Fig.83 North America Abrasives Production and Consumption, 2016 – 2026 (USD Million) (Tons)
    Fig.84 Europe Abrasives Production and Consumption, 2016 – 2026 (USD Million) (Tons)
    Fig.85 Asia Pacific Abrasives Production and Consumption, 2016 – 2026 (USD Million) (Tons)
    Fig.86 Latin America Abrasives Production and Consumption, 2016 – 2026 (USD Million) (Tons)
    Fig.87 The Middle-East and Africa Abrasives Production and Consumption, 2016 – 2026 (USD Million) (Tons)
    Fig.88 Competitor Market Share – Revenue
    Fig.89 Competitor Market Share – Volume
    Fig.90 Treibacher Revenue and Growth Rate
    Fig.91 Treibacher Market Share
    Fig.92 Jason Incorporated Revenue and Growth Rate
    Fig.93 Jason Incorporated Market Share
    Fig.94 Kier Group, Deerfos Co., Ltd. Revenue and Growth Rate
    Fig.95 Kier Group, Deerfos Co., Ltd. Market Share
    Fig.96 LafargeHolcim Revenue and Growth Rate
    Fig.97 LafargeHolcim Market Share
    Fig.98 FMSA Holdings Incorporated Revenue and Growth Rate
    Fig.99 FMSA Holdings Incorporated Market Share
    Fig.100 Tyrolit Group Revenue and Growth Rate
    Fig.101 Tyrolit Group Market Share
    Fig.102 Fujimi Incorporated Revenue and Growth Rate
    Fig.103 Fujimi Incorporated Market Share
    Fig.104 Global Material Technologies Revenue and Growth Rate
    Fig.105 Global Material Technologies Market Share
    Fig.106 Cabot Microelectronics Corporation Revenue and Growth Rate
    Fig.107 Cabot Microelectronics Corporation Market Share
    Fig.108 Sia Abrasives Revenue and Growth Rate
    Fig.109 Sia Abrasives Market Share
    Fig.110 Winterthur Revenue and Growth Rate
    Fig.111 Winterthur Market Share
    Fig.112 The Dow Chemical Company Revenue and Growth Rate
    Fig.113 The Dow Chemical Company Market Share
    Fig.114 Stanley Black & Decker Incorporated Revenue and Growth Rate
    Fig.115 Stanley Black & Decker Incorporated Market Share
    Fig.116 Almatis GmbH Revenue and Growth Rate
    Fig.117 Almatis GmbH Market Share
    Fig.118 Market Dynamics
    Fig.119 Global Abrasives – Value Chain Analysis
    Fig.120 Key Mandates and Regulations
    Fig.121 Technology Roadmap and Timeline
    Fig.122 Market Attractiveness Analysis – By Product
    Fig.123 Market Attractiveness Analysis – By Material
    Fig.124 Market Attractiveness Analysis – By End-User
    Fig.125 Market Attractiveness Analysis – By Region
    Fig.126 Manufacturing Cost Structure of Abrasives
    Fig.127 Abrasives Industrial Chain Analysis
    Fig.128 Market Channels
    Fig.129 Marketing Channel Development Trend
    Fig.130 Growth in World Gross Product, 2008-2018
    

    List of Tables

    Table 1 Global Abrasives Market, 2019 & 2026 (USD Million)
    Table 2 Global Abrasives Market, by Product, 2016 – 2026 (USD Million)
    Table 3 Global Abrasives Market, by Product, 2016 – 2026 (Tons)
    Table 4 Global Abrasives Market, by Material, 2016 – 2026 (USD Million)
    Table 5 Global Abrasives Market, by Material, 2016 – 2026 (Tons)
    Table 6 Global Abrasives Market, by End-User, 2016 – 2026 (USD Million)
    Table 7 Global Abrasives Market, by End-User, 2016 – 2026 (Tons)
    Table 8 Global Abrasives Market, by Region, 2016 – 2026 (USD Million)
    Table 9 Global Abrasives Market, by Region, 2016 – 2026 (Tons)
    Table 10 North America Abrasives Market, by Country, 2016 – 2026 (USD Million)
    Table 11 North America Abrasives Market, by Country, 2016 – 2026 (Tons)
    Table 12 North America Abrasives Market, by Product, 2016 – 2026 (USD Million)
    Table 13 North America Abrasives Market, by Product, 2016 – 2026 (Tons)
    Table 14 North America Abrasives Market, by Material, 2016 – 2026 (USD Million)
    Table 15 North America Abrasives Market, by Material, 2016 – 2026 (Tons)
    Table 16 North America Abrasives Market, by End-User, 2016 – 2026 (USD Million)
    Table 17 North America Abrasives Market, by End-User, 2016 – 2026 (Tons)
    Table 18 Europe Abrasives Market, by Country, 2016 – 2026 (USD Million)
    Table 19 Europe Abrasives Market, by Country, 2016 – 2026 (Tons)
    Table 20 Europe Abrasives Market, by Product, 2016 – 2026 (USD Million)
    Table 21 Europe Abrasives Market, by Product, 2016 – 2026 (Tons)
    Table 22 Europe Abrasives Market, by Material, 2016 – 2026 (USD Million)
    Table 23 Europe Abrasives Market, by Material, 2016 – 2026 (Tons)
    Table 24 Europe Abrasives Market, by End-User, 2016 – 2026 (USD Million)
    Table 25 Europe Abrasives Market, by End-User, 2016 – 2026 (Tons)
    Table 26 Asia Pacific Abrasives Market, by Country, 2016 – 2026 (USD Million)
    Table 27 Asia Pacific Abrasives Market, by Country, 2016 – 2026 (Tons)
    Table 28 Asia Pacific Abrasives Market, by Product, 2016 – 2026 (USD Million)
    Table 29 Asia Pacific Abrasives Market, by Product, 2016 – 2026 (Tons)
    Table 30 Asia Pacific Abrasives Market, by Material, 2016 – 2026 (USD Million)
    Table 31 Asia Pacific Abrasives Market, by Material, 2016 – 2026 (Tons)
    Table 32 Asia Pacific Abrasives Market, by End-User, 2016 – 2026 (USD Million)
    Table 33 Asia Pacific Abrasives Market, by End-User, 2016 – 2026 (Tons)
    Table 34 Latin America Abrasives Market, by Country, 2016 – 2026 (USD Million)
    Table 35 Latin America Abrasives Market, by Country, 2016 – 2026 (Tons)
    Table 36 Latin America Abrasives Market, by Product, 2016 – 2026 (USD Million)
    Table 37 Latin America Abrasives Market, by Product, 2016 – 2026 (Tons)
    Table 38 Latin America Abrasives Market, by Material, 2016 – 2026 (USD Million)
    Table 39 Latin America Abrasives Market, by Material, 2016 – 2026 (Tons)
    Table 40 Latin America Abrasives Market, by End-User, 2016 – 2026 (USD Million)
    Table 41 Latin America Abrasives Market, by End-User, 2016 – 2026 (Tons)
    Table 42 The Middle-East and Africa Abrasives Market, by Country, 2016 – 2026 (USD Million)
    Table 43 The Middle-East and Africa Abrasives Market, by Country, 2016 – 2026 (Tons)
    Table 44 The Middle-East and Africa Abrasives Market, by Product, 2016 – 2026 (USD Million)
    Table 45 The Middle-East and Africa Abrasives Market, by Product, 2016 – 2026 (Tons)
    Table 46 The Middle-East and Africa Abrasives Market, by Material, 2016 – 2026 (USD Million)
    Table 47 The Middle-East and Africa Abrasives Market, by Material, 2016 – 2026 (Tons)
    Table 48 The Middle-East and Africa Abrasives Market, by End-User, 2016 – 2026 (USD Million)
    Table 49 The Middle-East and Africa Abrasives Market, by End-User, 2016 – 2026 (Tons)
    Table 50 North America Abrasives Production, Consumption, Export, Import, 2016 – 2019
    Table 51 Europe Abrasives Production, Consumption, Export, Import, 2016 – 2019
    Table 52 Asia Pacific Abrasives Production, Consumption, Export, Import, 2016 – 2019
    Table 53 Latin America Abrasives Production, Consumption, Export, Import, 2016 – 2019
    Table 54 The Middle-East and Africa Abrasives Production, Consumption, Export, Import, 2016 – 2019
    Table 55 Global Abrasives Market - Company Revenue Analysis, 2016 – 2019 (USD Million)
    Table 56 Global Abrasives Market - Company Revenue Share Analysis, 2016 – 2019 (%)
    Table 57 Global Abrasives Market - Company Volume Analysis, 2016 – 2019 (Tons)
    Table 58 Global Abrasives Market - Company Volume Share Analysis, 2016 – 2019 (%)
    Table 59 Acquisitions and Mergers
    Table 60 Market Drivers – Impact Analysis
    Table 61 Market Restraints
    Table 62 Market Opportunities
    Table 63 Production Base and Market Concentration Rate of Raw Material
    Table 64 Key Suppliers of Raw Materials
    Table 65 Raw Materials Sources of Abrasives Major Manufacturers
    Table 66 Major Buyers of Abrasives
    Table 67 Distributors/Traders of Abrasives by Region
    
  •  

    Industry Major Market Players

    • Treibacher
    • Jason Incorporated
    • Kier Group
    • Deerfos Co. Ltd.
    • LafargeHolcim
    • FMSA Holdings Incorporated
    • Tyrolit Group
    • Fujimi Incorporated
    • Global Material Technologies
    • Cabot Microelectronics Corporation
    • Sia Abrasives
    • Winterthur
    • The Dow Chemical Company
    • Stanley Black & Decker Incorporated
    • Almatis GmbH