Search Market Research Report

Discover Our Latest Reports
Discover Our Featured Reports
Discover Top Selling Reports

AB Testing Market Size, Share Global Analysis Report, 2020–2026

report img

AB Testing Market By Type (Web Based and Cloud Based) and By Application (SMEs and Large Enterprises): Global Industry Outlook, Market Size, Business Intelligence, Consumer Preferences, Statistical Surveys, Comprehensive Analysis, Historical Developments, Current Trends, and Forecast 2020–2026

Industry Insights

The AB Testing market report analyzes and notifies the industry statistics at the global as well as regional and country levels in order to acquire a thorough perspective of the entire AB Testing market. The historical and past insights are provided for FY 2016 to FY 2019 whereas projected trends are delivered for FY 2020 to FY 2026. The quantitative and numerical data is represented in value (USD Million) from FY 2016 – 2026.

This specialized and expertise-oriented industry research report scrutinizes the technical and commercial business outlook of the AB Testing industry. The report analyzes and declares the historical and current trends analysis of the AB Testing industry and subsequently recommends the projected trends anticipated to be observed in the AB Testing market during the upcoming years.

AB Testing Market Size

To know more about this report | Request Free Sample Copy

logoKey Insights from Primary Research

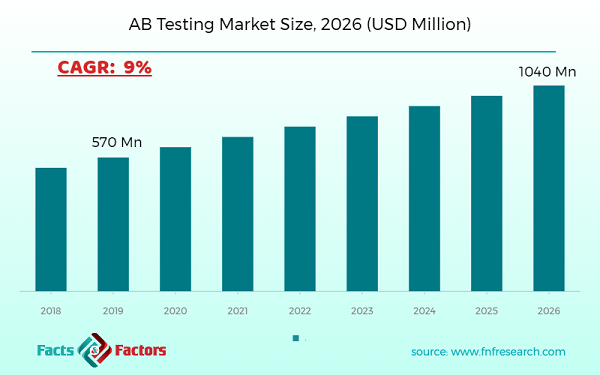
  • As per our primary respondents, the AB testing market is set to grow annually at a rate of around 9%.
  • It was established through primary research that the A B testing market was valued at around USD 570 million in 2019.
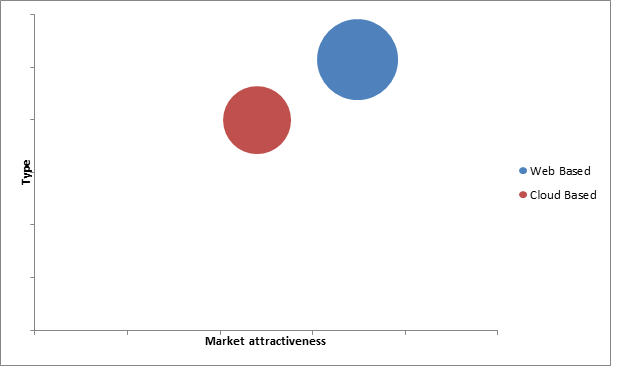
  • After secondary research, we performed face-to-face interviews to validate our data. The insights interviewees declared that Web Based is the most used type for the global A B testing market.
  • On the basis of the Application, SMEs dominated the global AB testing market in 2019. It accounted for around 62% share of the total market in 2019.
  • The web-based segment, on the basis of type segmentation, was the leading revenue-generating category accounting for around 58% share, in 2019.

logoKey Recommendations from Analysts

  • Based on the exhaustive secondary research done by our team, the SME type is anticipated to become the most demanding Application in the upcoming years, owing to the growing demand for A B testing from the IT industry for various end-use applications.
  • As per our analysts, North America recorded the highest market share of more than 39% by 2026, and the market is expected to bolster in this region, resulting in creating lucrative opportunities for new players.
  • Growing at a CAGR of around 7%, the A B testing market provides numerous opportunities for all of the involved stakeholders across the entire value chain.
  • Our analysts have identified Web Based and SME categories as the leading investment pockets for the A B testing market in terms of type and application segmentation respectively.
  • Our analysts recommend that emerging players focus on SMEs owing to the substantial growth of the IT industry, especially in APAC and Middle-eastern regions.

logoMarket Attractiveness – By Type

AB Testing Market

To know more about this report | Request Free Sample Copy

The quantitative data is further underlined and reinforced by comprehensive qualitative data which comprises various across-the-board market dynamics. The rationales which directly or indirectly impact the AB Testing industry are exemplified through parameters such as growth drivers, restraints, challenges, and opportunities among other impacting factors.

Throughout our research report, we have encompassed all the proven models and tools of industry analysis and extensively illustrated all the key business strategies and business models adopted in the AB Testing industry. The report provides an all-inclusive and detailed competitive landscape prevalent in the AB Testing market.

The report utilizes established industry analysis tools and models such as Porter’s Five Forces framework to analyze and recognize critical business strategies adopted by various stakeholders involved in the entire value chain of the AB Testing industry. The AB Testing market report additionally employs SWOT analysis and PESTLE analysis models for further in-depth analysis.

The report study further includes an in-depth analysis of industry players' market shares and provides an overview of leading players' market positions in the AB Testing sector. Key strategic developments in the AB Testing market competitive landscape such as acquisitions & mergers, inaugurations of different products and services, partnerships & joint ventures, MoU agreements, VC & funding activities, R&D activities, and geographic expansion among other noteworthy activities by key players of the AB Testing market are appropriately highlighted in the report.

The AB Testing market in 2019 was approximately valued at USD 570 million. The market is expected to grow at a CAGR of 9% and is anticipated to reach around USD 1040 million by 2026. A / B research allows users or developers to evaluate their mobile app just like a science project evaluation. This test enables the user or developer to identify two or more application pages to identify the most efficient one. This assessment also enables the customer or developer to support their predictions with complicated research details and shows immediate marketing strategy results and investment returns (ROIs). The global market for A / B testing is driven by a number of factors, including the increasing use of smart devices such as smartphones, tablets, and so on, combined with the rise of the Internet of Things (IoT). These factors require multiple applications for a variety of functions. Most of the leading market leaders are investing heavily in A / B testing to make end-users more popular. Business is being tested for robust growth because there is no clear alternative to the test today.

The AB Testing market research report delivers an acute valuation and taxonomy of the AB Testing industry by practically splitting the market on the basis of different types, applications, and regions. Through the analysis of the historical and projected trends, all the segments and sub-segments were evaluated through the bottom-up approach, and different market sizes have been projected for FY 2020 to FY 2026. The regional segmentation of the AB Testing industry includes the complete classification of all the major continents including North America, Latin America, Europe, Asia Pacific, and the Middle East & Africa. Further, country-wise data for the AB Testing industry is provided for the leading economies of the world.

The AB Testing market is segmented based on Type and Application. On the basis of type segmentation, the market is classified into Web Based and Cloud Based. In terms of Application segmentation, the market is bifurcated into SMEs and Large Enterprises.

logoReport Scope

Report Attribute

Details

Market Size in 2019

USD 570 Million

Projected Market Size in 2026

USD 1040 Million

CAGR Growth Rate

9% CAGR

Base Year

2019

Forecast Years

2020-2026

Key Market Players

Dynamic Yield, Convert Experiences, Evergage, Instapage, Google, Kameleoon, Leanplum, Leadpages, Monetate, Oracle, Optimizely, Persado, SiteSpect, Qubit, Unbounce, Webtrends Optimize, VWO, Zarget, and others.

Key Segment

By Type, By Application, By Region

Major Regions Covered

North America, Europe, Asia Pacific, Latin America, and the Middle East & Africa

Purchase Options

Request customized purchase options to meet your research needs. Explore purchase options

logoSome of the essential players operating in the AB testing market, but not restricted to include: 

  •  Dynamic Yield
  •  Convert Experiences
  •  Evergage
  •  Instapage
  •  Google
  •  Kameleoon
  •  Leanplum
  •  Leadpages
  •  Monetate
  •  Oracle
  •  Optimizely
  •  Persado
  •  SiteSpect
  •  Qubit
  •  Unbounce
  •  Webtrends Optimize
  •  VWO
  •  Zarget

The taxonomy of the AB Testing industry by its scope and segmentation is as follows:

logo By Type Segmentation Analysis (Customizable)

  • Web Based
  • Cloud-Based

logo By Application Segmentation Analysis (Customizable)

  • SMEs
  • Large Enterprises

logo Regional Segmentation Analysis (Customizable)

  • North America
    • The U.S.
    • Canada
  • Europe
    • Germany
    • The UK
    • France
    • Spain
    • Italy
    • Rest of Europe
  • Asia Pacific
    • China
    • Japan
    • India
    • South Korea
    • Southeast Asia
    • Rest of Asia Pacific
  • Latin America
    • Brazil
    • Mexico
    • Rest of Latin America
  • Middle East & Africa
    • GCC
    • South Africa
    • Rest of the Middle East & Africa

Table of Content

  1. CHAPTER 1. Executive Summary
  2. CHAPTER 2. AB Testing market – Type Analysis
    1. 2.1. Global AB Testing Market – Type Overview
    2. 2.2. Global AB Testing Market Share, by Type, 2018 & 2025 (USD Million)
    3. 2.3. Web Based
      1. 2.3.1. Global Web Based AB Testing Market, 2015-2025 (USD Million)
    4. 2.4. Cloud Based
      1. 2.4.1. Global Cloud Based AB Testing Market, 2015-2025 (USD Million)
  3. CHAPTER 3. AB Testing market – Application Analysis
    1. 3.1. Global AB Testing Market – Application Overview
    2. 3.2. Global AB Testing Market Share, by Application, 2018 & 2025 (USD Million)
    3. 3.3. SMEs
      1. 3.3.1. Global SMEs AB Testing Market, 2015-2025 (USD Million)
    4. 3.4. Large Enterprises
      1. 3.4.1. Global Large Enterprises AB Testing Market, 2015-2025 (USD Million)
  4. CHAPTER 4. AB Testing market – Regional Analysis
    1. 4.1. Global AB Testing Market Regional Overview
    2. 4.2. Global AB Testing Market Share, by Region, 2018 & 2025 (Value)
    3. 4.3. North America
      1. 4.3.1. North America AB Testing Market size and forecast, 2015-2025
      2. 4.3.2. North America AB Testing Market, by Country, 2018 & 2025 (USD Million)
      3. 4.3.3. North America AB Testing Market, by Type, 2015-2025
        1. 4.3.3.1. North America AB Testing Market, by Type, 2015-2025 (USD Million)
      4. 4.3.4. North America AB Testing Market, by Application, 2015-2025
        1. 4.3.4.1. North America AB Testing Market, by Application, 2015-2025 (USD Million)
      5. 4.3.5. U.S.
        1. 4.3.5.1. U.S. Market size and forecast, 2015-2025 (USD Million)
      6. 4.3.6. Canada
        1. 4.3.6.1. Canada Market size and forecast, 2015-2025 (USD Million)
    4. 4.4. Europe
      1. 4.4.1. Europe AB Testing Market size and forecast, 2015-2025
      2. 4.4.2. Europe AB Testing Market, by Country, 2018 & 2025 (USD Million)
      3. 4.4.3. Europe AB Testing Market, by Type, 2015-2025
        1. 4.4.3.1. Europe AB Testing Market, by Type, 2015-2025 (USD Million)
      4. 4.4.4. Europe AB Testing Market, by Application, 2015-2025
        1. 4.4.4.1. Europe AB Testing Market, by Application, 2015-2025 (USD Million)
      5. 4.4.5. Germany
        1. 4.4.5.1. Germany Market size and forecast, 2015-2025 (USD Million)
      6. 4.4.6. France
        1. 4.4.6.1. France Market size and forecast, 2015-2025 (USD Million)
      7. 4.4.7. U.K.
        1. 4.4.7.1. U.K. Market size and forecast, 2015-2025 (USD Million)
      8. 4.4.8. Italy
        1. 4.4.8.1. Italy Market size and forecast, 2015-2025 (USD Million)
      9. 4.4.9. Spain
        1. 4.4.9.1. Spain Market size and forecast, 2015-2025 (USD Million)
      10. 4.4.10. Rest of Europe
        1. 4.4.10.1. Rest of Europe Market size and forecast, 2015-2025 (USD Million)
    5. 4.5. Asia Pacific
      1. 4.5.1. Asia Pacific AB Testing Market size and forecast, 2015-2025
      2. 4.5.2. Asia Pacific AB Testing Market, by Country, 2018 & 2025 (USD Million)
      3. 4.5.3. Asia Pacific AB Testing Market, by Type, 2015-2025
        1. 4.5.3.1. Asia Pacific AB Testing Market, by Type, 2015-2025 (USD Million)
      4. 4.5.4. Asia Pacific AB Testing Market, by Application, 2015-2025
        1. 4.5.4.1. Asia Pacific AB Testing Market, by Application, 2015-2025 (USD Million)
      5. 4.5.5. China
        1. 4.5.5.1. China Market size and forecast, 2015-2025 (USD Million)
      6. 4.5.6. Japan
        1. 4.5.6.1. Japan Market size and forecast, 2015-2025 (USD Million)
      7. 4.5.7. India
        1. 4.5.7.1. India Market size and forecast, 2015-2025 (USD Million)
      8. 4.5.8. South Korea
        1. 4.5.8.1. South Korea Market size and forecast, 2015-2025 (USD Million)
      9. 4.5.9. South-East Asia
        1. 4.5.9.1. South-East Asia Market size and forecast, 2015-2025 (USD Million)
      10. 4.5.10. Rest of Asia Pacific
        1. 4.5.10.1. Rest of Asia Pacific Market size and forecast, 2015-2025 (USD Million)
    6. 4.6. Latin America
      1. 4.6.1. Latin America AB Testing Market size and forecast, 2015-2025
      2. 4.6.2. Latin America AB Testing Market, by Country, 2018 & 2025 (USD Million)
      3. 4.6.3. Latin America AB Testing Market, by Type, 2015-2025
        1. 4.6.3.1. Latin America AB Testing Market, by Type, 2015-2025 (USD Million)
      4. 4.6.4. Latin America AB Testing Market, by Application, 2015-2025
        1. 4.6.4.1. Latin America AB Testing Market, by Application, 2015-2025 (USD Million)
      5. 4.6.5. Brazil
        1. 4.6.5.1. Brazil Market size and forecast, 2015-2025 (USD Million)
      6. 4.6.6. Mexico
        1. 4.6.6.1. Mexico Market size and forecast, 2015-2025 (USD Million)
      7. 4.6.7. Rest of Latin America
        1. 4.6.7.1. Rest of Latin America Market size and forecast, 2015-2025 (USD Million)
    7. 4.7. The Middle-East and Africa
      1. 4.7.1. The Middle-East and Africa AB Testing Market size and forecast, 2015-2025
      2. 4.7.2. The Middle-East and Africa AB Testing Market, by Country, 2018 & 2025 (USD Million)
      3. 4.7.3. The Middle-East and Africa AB Testing Market, by Type, 2015-2025
        1. 4.7.3.1. The Middle-East and Africa AB Testing Market, by Type, 2015-2025 (USD Million)
      4. 4.7.4. The Middle-East and Africa AB Testing Market, by Application, 2015-2025
        1. 4.7.4.1. The Middle-East and Africa AB Testing Market, by Application, 2015-2025 (USD Million)
      5. 4.7.5. GCC Countries
        1. 4.7.5.1. GCC Countries Market size and forecast, 2015-2025 (USD Million)
      6. 4.7.6. South Africa
        1. 4.7.6.1. South Africa Market size and forecast, 2015-2025 (USD Million)
      7. 4.7.7. Rest of Middle-East Africa
        1. 4.7.7.1. Rest of Middle-East Africa Market size and forecast, 2015-2025 (USD Million)
  5. CHAPTER 5. AB Testing market – Competitive Landscape
    1. 5.1. Competitor Market Share – Revenue
    2. 5.2. Market Concentration Rate Analysis, Top 3 and Top 5 Players
    3. 5.3. Strategic Development
      1. 5.3.1. Acquisitions and Mergers
      2. 5.3.2. New Products
      3. 5.3.3. Research & Development Activities
  6. CHAPTER 6. Company Profiles
    1. 6.1. Adobe
      1. 6.1.1. Company Overview
      2. 6.1.2. Adobe Revenue and Gross Margin
      3. 6.1.3. Product portfolio
      4. 6.1.4. Recent initiatives
    2. 6.2. AB Tasty
      1. 6.2.1. Company Overview
      2. 6.2.2. AB Tasty Revenue and Gross Margin
      3. 6.2.3. Product portfolio
      4. 6.2.4. Recent initiatives
    3. 6.3. BounceX
      1. 6.3.1. Company Overview
      2. 6.3.2. BounceX Revenue and Gross Margin
      3. 6.3.3. Product portfolio
      4. 6.3.4. Recent initiatives
    4. 6.4. Campaigner
      1. 6.4.1. Company Overview
      2. 6.4.2. Campaigner Revenue and Gross Margin
      3. 6.4.3. Product portfolio
      4. 6.4.4. Recent initiatives
    5. 6.5. Bound
      1. 6.5.1. Company Overview
      2. 6.5.2. Bound Revenue and Gross Margin
      3. 6.5.3. Product portfolio
      4. 6.5.4. Recent initiatives
    6. 6.6. ClickTale
      1. 6.6.1. Company Overview
      2. 6.6.2. ClickTale Revenue and Gross Margin
      3. 6.6.3. Product portfolio
      4. 6.6.4. Recent initiatives
    7. 6.7. Dynamic Yield
      1. 6.7.1. Company Overview
      2. 6.7.2. Dynamic Yield Revenue and Gross Margin
      3. 6.7.3. Product portfolio
      4. 6.7.4. Recent initiatives
    8. 6.8. Convert Experiences
      1. 6.8.1. Company Overview
      2. 6.8.2. Convert Experiences Revenue and Gross Margin
      3. 6.8.3. Product portfolio
      4. 6.8.4. Recent initiatives
    9. 6.9. Evergage
      1. 6.9.1. Company Overview
      2. 6.9.2. Evergage Revenue and Gross Margin
      3. 6.9.3. Product portfolio
      4. 6.9.4. Recent initiatives
    10. 6.10. Instapage
      1. 6.10.1. Company Overview
      2. 6.10.2. Instapage Revenue and Gross Margin
      3. 6.10.3. Product portfolio
      4. 6.10.4. Recent initiatives
    11. 6.11. Google
      1. 6.11.1. Company Overview
      2. 6.11.2. Google Revenue and Gross Margin
      3. 6.11.3. Product portfolio
      4. 6.11.4. Recent initiatives
    12. 6.12. Kameleoon
      1. 6.12.1. Company Overview
      2. 6.12.2. Kameleoon Revenue and Gross Margin
      3. 6.12.3. Product portfolio
      4. 6.12.4. Recent initiatives
    13. 6.13. Leanplum
      1. 6.13.1. Company Overview
      2. 6.13.2. Leanplum Revenue and Gross Margin
      3. 6.13.3. Product portfolio
      4. 6.13.4. Recent initiatives
    14. 6.14. Leadpages
      1. 6.14.1. Company Overview
      2. 6.14.2. Leadpages Revenue and Gross Margin
      3. 6.14.3. Product portfolio
      4. 6.14.4. Recent initiatives
    15. 6.15. Monetate
      1. 6.15.1. Company Overview
      2. 6.15.2. Monetate Revenue and Gross Margin
      3. 6.15.3. Product portfolio
      4. 6.15.4. Recent initiatives
    16. 6.16. Oracle
      1. 6.16.1. Company Overview
      2. 6.16.2. Oracle Revenue and Gross Margin
      3. 6.16.3. Product portfolio
      4. 6.16.4. Recent initiatives
    17. 6.17. Optimizely
      1. 6.17.1. Company Overview
      2. 6.17.2. Optimizely Revenue and Gross Margin
      3. 6.17.3. Product portfolio
      4. 6.17.4. Recent initiatives
    18. 6.18. Persado
      1. 6.18.1. Company Overview
      2. 6.18.2. Persado Revenue and Gross Margin
      3. 6.18.3. Product portfolio
      4. 6.18.4. Recent initiatives
    19. 6.19. SiteSpect
      1. 6.19.1. Company Overview
      2. 6.19.2. SiteSpect Revenue and Gross Margin
      3. 6.19.3. Product portfolio
      4. 6.19.4. Recent initiatives
    20. 6.20. Qubit
      1. 6.20.1. Company Overview
      2. 6.20.2. Qubit Revenue and Gross Margin
      3. 6.20.3. Product portfolio
      4. 6.20.4. Recent initiatives
    21. 6.21. Unbounce
      1. 6.21.1. Company Overview
      2. 6.21.2. Unbounce Revenue and Gross Margin
      3. 6.21.3. Product portfolio
      4. 6.21.4. Recent initiatives
    22. 6.22. Webtrends Optimize
      1. 6.22.1. Company Overview
      2. 6.22.2. Webtrends Optimize Revenue and Gross Margin
      3. 6.22.3. Product portfolio
      4. 6.22.4. Recent initiatives
    23. 6.23. VWO
      1. 6.23.1. Company Overview
      2. 6.23.2. VWO Revenue and Gross Margin
      3. 6.23.3. Product portfolio
      4. 6.23.4. Recent initiatives
    24. 6.24. Zarget
      1. 6.24.1. Company Overview
      2. 6.24.2. Zarget Revenue and Gross Margin
      3. 6.24.3. Product portfolio
      4. 6.24.4. Recent initiatives
  7. CHAPTER 7. AB Testing — Industry Analysis
    1. 7.1. AB Testing Market – Key Trends
      1. 7.1.1. Market Drivers
      2. 7.1.2. Market Restraints
      3. 7.1.3. Market Opportunities
    2. 7.2. Value Chain Analysis
    3. 7.3. Technology Roadmap and Timeline
    4. 7.4. AB Testing Market – Attractiveness Analysis
      1. 7.4.1. By Type
      2. 7.4.2. By Application
      3. 7.4.3. By Region
  8. CHAPTER 8. Marketing Strategy Analysis, Distributors
    1. 8.1. Marketing Channel
    2. 8.2. Direct Marketing
    3. 8.3. Indirect Marketing
    4. 8.4. Marketing Channel Development Trend
    5. 8.5. Economic/Political Environmental Change
  9. CHAPTER 9. Report Conclusion
  10. CHAPTER 10. Research Approach & Methodology
    1. 10.1. Report Description
    2. 10.2. Research Scope
    3. 10.3. Research Methodology
      1. 10.3.1. Secondary Research
      2. 10.3.2. Primary Research
      3. 10.3.3. Models
        1. 10.3.3.1. Company Share Analysis Model
        2. 10.3.3.2. Revenue Based Modeling
        3. 10.3.3.3. Research Limitations

        List of Figures

        FIG. 1 Global AB Testing Market, 2015-2025 (USD Million)
        FIG. 2 Global AB Testing Market Share, by Type, 2018 & 2025 (USD Million)
        FIG. 3 Global Web Based AB Testing Market, 2015-2025 (USD Million)
        FIG. 4 Global Cloud Based AB Testing Market, 2015-2025 (USD Million)
        FIG. 5 Global AB Testing Market Share, by Application, 2018 & 2025 (USD Million)
        FIG. 6 Global SMEs AB Testing Market, 2015-2025 (USD Million)
        FIG. 7 Global Large Enterprises AB Testing Market, 2015-2025 (USD Million)
        FIG. 8 Global AB Testing Market Share, by Region, 2018 & 2025
        FIG. 9 North America AB Testing Market, 2015-2025
        FIG. 10 U.S. AB Testing Market, 2015-2025
        FIG. 11 Canada AB Testing Market, 2015-2025
        FIG. 12 Europe AB Testing Market, 2015-2025
        FIG. 13 Germany AB Testing Market, 2015-2025
        FIG. 14 France AB Testing Market, 2015-2025
        FIG. 15 U.K. AB Testing Market, 2015-2025
        FIG. 16 Italy AB Testing Market, 2015-2025
        FIG. 17 Spain AB Testing Market, 2015-2025
        FIG. 18 Rest of Europe AB Testing Market, 2015-2025
        FIG. 19 Asia Pacific AB Testing Market, 2015-2025
        FIG. 20 China AB Testing Market, 2015-2025
        FIG. 21 Japan AB Testing Market, 2015-2025
        FIG. 22 India AB Testing Market, 2015-2025
        FIG. 23 South  Korea AB Testing Market, 2015-2025
        FIG. 24 South-East Asia AB Testing Market, 2015-2025
        FIG. 25 Rest of Asia Pacific AB Testing Market, 2015-2025
        FIG. 26 Latin America AB Testing Market, 2015-2025
        FIG. 27 Brazil AB Testing Market, 2015-2025
        FIG. 28 Mexico AB Testing Market, 2015-2025
        FIG. 29 Rest of Latin America AB Testing Market, 2015-2025
        FIG. 30 The Middle-East and Africa AB Testing Market, 2015-2025
        FIG. 31 GCC Countries AB Testing Market, 2015-2025
        FIG. 32 South Africa AB Testing Market, 2015-2025
        FIG. 33 Rest of Middle-East Africa AB Testing Market, 2015-2025
        FIG. 34 Competitor Market Share – Revenue
        FIG. 35 Adobe Revenue and Growth Rate
        FIG. 36 Adobe Market Share
        FIG. 37 AB Tasty Revenue and Growth Rate
        FIG. 38 AB Tasty Market Share
        FIG. 39 BounceX Revenue and Growth Rate
        FIG. 40 BounceX Market Share
        FIG. 41 Campaigner Revenue and Growth Rate
        FIG. 42 Campaigner Market Share
        FIG. 43 Bound Revenue and Growth Rate
        FIG. 44 Bound Market Share
        FIG. 45 ClickTale Revenue and Growth Rate
        FIG. 46 ClickTale Market Share
        FIG. 47 Dynamic Yield Revenue and Growth Rate
        FIG. 48 Dynamic Yield Market Share
        FIG. 49 Convert Experiences Revenue and Growth Rate
        FIG. 50 Convert Experiences Market Share
        FIG. 51 Evergage Revenue and Growth Rate
        FIG. 52 Evergage Market Share
        FIG. 53 Instapage Revenue and Growth Rate
        FIG. 54 Instapage Market Share
        FIG. 55 Google Revenue and Growth Rate
        FIG. 56 Google Market Share
        FIG. 57 Kameleoon Revenue and Growth Rate
        FIG. 58 Kameleoon Market Share
        FIG. 59 Leanplum Revenue and Growth Rate
        FIG. 60 Leanplum Market Share
        FIG. 61 Leadpages Revenue and Growth Rate
        FIG. 62 Leadpages Market Share
        FIG. 63 Monetate Revenue and Growth Rate
        FIG. 64 Monetate Market Share
        FIG. 65 Oracle Revenue and Growth Rate
        FIG. 66 Oracle Market Share
        FIG. 67 Optimizely Revenue and Growth Rate
        FIG. 68 Optimizely Market Share
        FIG. 69 Persado Revenue and Growth Rate
        FIG. 70 Persado Market Share
        FIG. 71 SiteSpect Revenue and Growth Rate
        FIG. 72 SiteSpect Market Share
        FIG. 73 Qubit Revenue and Growth Rate
        FIG. 74 Qubit Market Share
        FIG. 75 Unbounce Revenue and Growth Rate
        FIG. 76 Unbounce Market Share
        FIG. 77 Webtrends Optimize Revenue and Growth Rate
        FIG. 78 Webtrends Optimize Market Share
        FIG. 79 VWO Revenue and Growth Rate
        FIG. 80 VWO Market Share
        FIG. 81 Zarget Revenue and Growth Rate
        FIG. 82 Zarget Market Share
        FIG. 83 Market Dynamics
        FIG. 84 Global AB Testing – Value Chain Analysis
        FIG. 85 Technology Roadmap and Timeline
        FIG. 86 Market Attractiveness Analysis – By Type
        FIG. 87 Market Attractiveness Analysis – By Application
        FIG. 88 Market Attractiveness Analysis – By Region
        FIG. 89 Market Channel
        FIG. 90 Marketing Channel Development Trend
        FIG. 91 Growth in World Gross Product, 2008-2018

        List of Tables

        TABLE 1 Global AB Testing Market, 2018 & 2025 (USD Million)
        TABLE 2 Global AB Testing market, by Type, 2015-2025 (USD Million)
        TABLE 3 Global AB Testing market, by Application, 2015-2025 (USD Million)
        TABLE 4 Global AB Testing market, by Region, 2015-2025 (USD Million)
        TABLE 5 North America AB Testing Market, by Type, 2015-2025 (USD Million)
        TABLE 6 North America AB Testing Market, by Application, 2015-2025 (USD Million)
        TABLE 7 Europe AB Testing Market, by Type, 2015-2025 (USD Million)
        TABLE 8 Europe AB Testing Market, by Application, 2015-2025 (USD Million)
        TABLE 9 Asia Pacific AB Testing Market, by Type, 2015-2025 (USD Million)
        TABLE 10 Asia Pacific AB Testing Market, by Application, 2015-2025 (USD Million)
        TABLE 11 Latin America AB Testing Market, by Type, 2015-2025 (USD Million)
        TABLE 12 Latin America AB Testing Market, by Application, 2015-2025 (USD Million)
        TABLE 13 The Middle-East and Africa AB Testing Market, by Type, 2015-2025 (USD Million)
        TABLE 14 The Middle-East and Africa AB Testing Market, by Application, 2015-2025 (USD Million)
        TABLE 15 Global AB Testing Market - Company Revenue Analysis 2015-2018 (USD Million)
        TABLE 16 Global AB Testing Market - Company Revenue Share Analysis 2015-2018(%)
        TABLE 17 Acquisitions and Mergers
        TABLE 18 New Product/Service Launch
        TABLE 19 Research & Development Activities
        TABLE 20 Market Drivers
        TABLE 21 Market Restraints
        TABLE 22 Market Opportunities
        

Industry Major Market Players

  •  Dynamic Yield
  •  Convert Experiences
  •  Evergage
  •  Instapage
  •  Google
  •  Kameleoon
  •  Leanplum
  •  Leadpages
  •  Monetate
  •  Oracle
  •  Optimizely
  •  Persado
  •  SiteSpect
  •  Qubit
  •  Unbounce
  •  Webtrends Optimize
  •  VWO
  •  Zarget